• Aperçu
  • Avis
  • Commentaires
  • Nouveautés

Ultimate Fibonacci Indicator for Precision Trading

🔥 Découvrez l'indicateur révolutionnaire de Fibonacci pour un trading ultra-précis ! 🔥

Libérez la puissance de Fibonacci avec cet outil innovant !

Prêt à porter votre trading à un niveau supérieur ? Dites adieu aux approximations et bonjour à la précision avec l’Indicateur de Niveaux Fibonacci pour les 5 dernières bougies journalières. Votre meilleur allié pour l'analyse technique et le trading basé sur l'action des prix.

Pourquoi les traders adorent cet indicateur ?
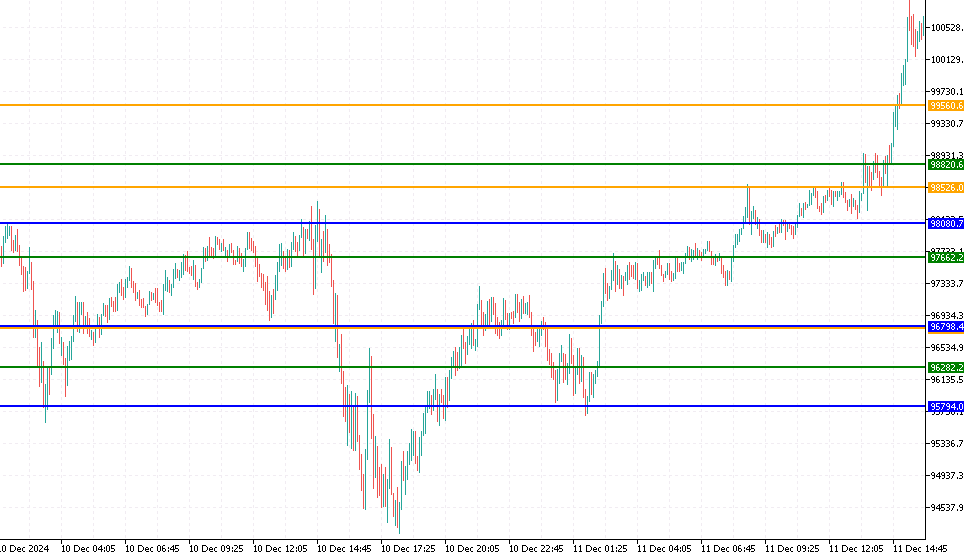
 Précision maximale : Trace automatiquement les niveaux clés de Fibonacci — 50%, 61,8% et 38,2% — sur les 5 dernières bougies journalières.
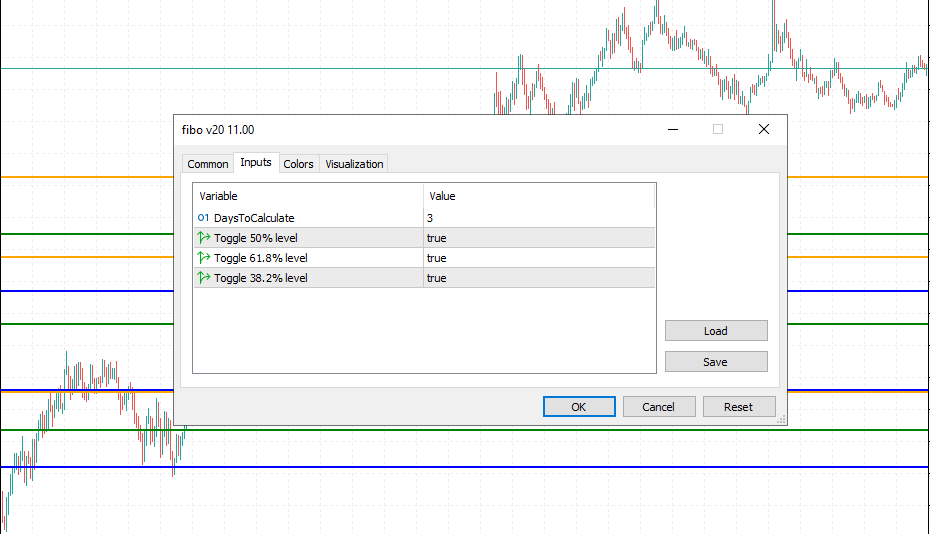
 Personnalisation totale : Activez ou désactivez les niveaux spécifiques en fonction de votre style de trading.
 Design intelligent : Des lignes horizontales claires et visuellement attrayantes avec des couleurs et des épaisseurs personnalisables pour une analyse limpide.
 Mise à jour en temps réel : Synchronisation automatique à chaque tick pour que vos graphiques reflètent les dernières dynamiques du marché.
 Facilité d’utilisation : Supprime automatiquement les objets obsolètes pour garder vos graphiques nets et organisés.

Comment fonctionne cet outil révolutionnaire ?

 Calculs intelligents : Exploite les retracements de Fibonacci basés directement sur les points hauts et bas des bougies journalières précédentes.
 Visualisation intuitive : Chaque niveau est tracé avec fluidité pour identifier instantanément les zones potentielles de support et de résistance.
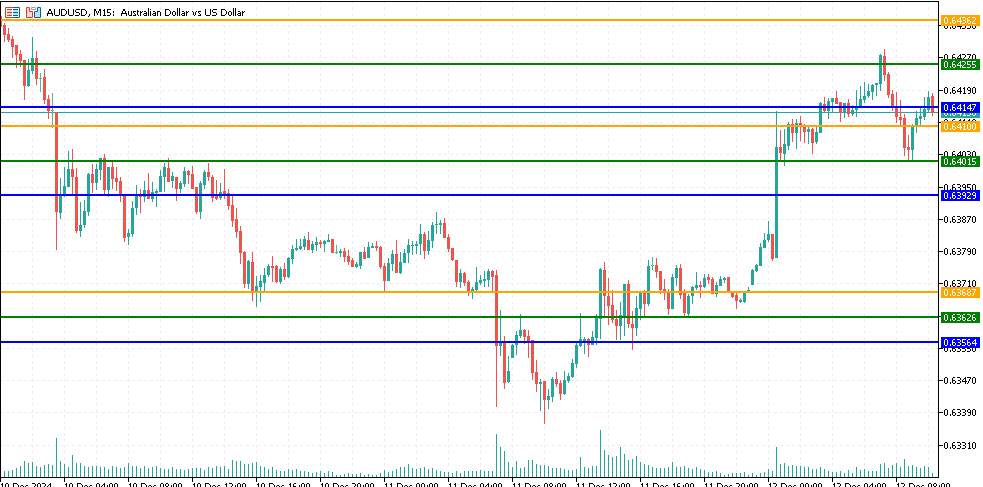
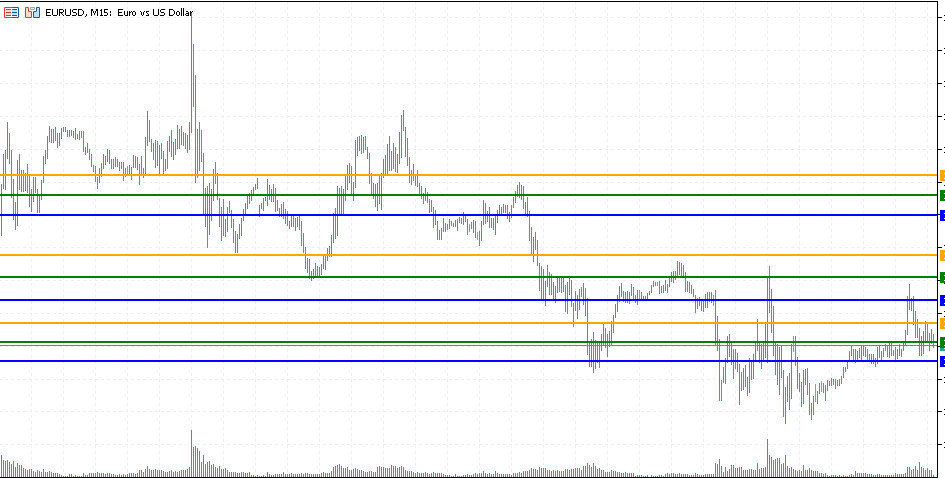
 Idéal pour tous les marchés : Forex, matières premières, indices ou crypto-monnaies — cet indicateur s’adapte parfaitement à tout actif.

Caractéristiques principales

  • Choix dynamique des jours : Sélectionnez le nombre de bougies précédentes à analyser — parfait pour différents cadres temporels et stratégies.
  • Codage couleur : Repérez facilement les niveaux grâce à des lignes horizontales distinctes.
  • Léger et efficace : Conçu pour fonctionner sans latence, même dans des marchés à forte volatilité.

Pourquoi avez-vous besoin de cet indicateur dès aujourd'hui ?

📈 Améliorez votre avantage : Comprenez mieux les retracements et inversions de tendance pour optimiser vos configurations de trading.
💡 Gagnez du temps : Oubliez le traçage manuel des niveaux de Fibonacci. Laissez cet outil faire le travail pendant que vous vous concentrez sur l'exécution.
🚀 Prenez une longueur d’avance sur le marché : Démarquez-vous avec des outils d’analyse professionnelle déjà utilisés par les meilleurs traders.

Qu'attendez-vous ?

Ce n’est pas seulement un indicateur — c’est votre clé pour maîtriser le trading avec Fibonacci. Que vous soyez un trader expérimenté ou débutant, cet outil est indispensable à votre arsenal.

💎 Procurez-vous-le dès maintenant sur MQL5 et transformez votre trading dès aujourd'hui ! 💎

Ne vous contentez pas de trader — trader intelligemment, avec précision et succès grâce à Fibonacci !


Produits recommandés
Owl Smart Levels MT5
Sergey Ermolov
4.07 (28)
Version MT4   |  FAQ L' indicateur Owl Smart Levels est un système de trading complet au sein d'un seul indicateur qui comprend des outils d'analyse de marché populaires tels que les fractales avancées de Bill Williams , Valable ZigZag qui construit la structure d'onde correcte du marché et les niveaux de Fibonacci qui marquent les niveaux exacts d'entrée. sur le marché et les endroits où prendre des bénéfices. Description détaillée de la stratégie Mode d'emploi de l'indicateur Conseiller-Assis
Noize Absorption Index - is the manual trading system that measures the difference of pressure between bears forces and bulls forces. Green line - is a noize free index that showing curent situation. Zero value of index shows totally choppy/flat market.Values above zero level shows how powerfull bullish wave is and values below zero measures bearish forces.Up arrow appears on bearish market when it's ready to reverse, dn arrow appears on weak bullish market, as a result of reverse expectation.
Your Trend Friend
Luigi Nunes Labigalini
5 (1)
The trend is your friend! Look at the color of the indicator and trade on that direction. It does not  repaint. After each candle is closed, that's the color of the trend. You can focus on shorter faster trends or major trends, just test what's most suitable for the symbol and timeframe you trade. Simply change the "Length" parameter and the indicator will automatically adapt. You can also change the color, thickness and style of the lines. Download and give it a try! There are big movements w
L'une des séquences de numéros s'appelle « Séquence des incendies de forêt ». Il a été reconnu comme l'une des plus belles nouvelles séquences. Sa principale caractéristique est que cette séquence évite les tendances linéaires, même les plus courtes. C'est cette propriété qui a constitué la base de cet indicateur. Lors de l'analyse d'une série chronologique financière, cet indicateur essaie de rejeter toutes les options de tendance possibles. Et seulement s'il échoue, il reconnaît alors la prés
Mine Farm
Maryna Kauzova
Mine Farm is one of the most classic and time-tested scalping strategies based on the breakdown of strong price levels. Mine Farm is the author's modification of the system for determining entry and exit points into the market... Mine Farm - is the combination of great potential with reliability and safety. Why Mine Farm?! - each order has a short dynamic Stop Loss - the advisor does not use any risky methods (averaging, martingale, grid, locking, etc.) - the advisor tries to get the most
The Penta-O is a 6-point retracement harmonacci pattern which usually precedes big market movements. Penta-O patterns can expand and repaint quite a bit. To make things easier this indicator implements a twist: it waits for a donchian breakout in the right direction before signaling the trade. The end result is an otherwise repainting indicator with a very reliable trading signal. The donchian breakout period is entered as an input. [ Installation Guide | Update Guide | Troubleshooting | FAQ | A
L'indicateur DYJ BoS identifie et marque automatiquement les éléments essentiels des changements de structure du marché, notamment : Rupture de structure (BoS) : détectée lorsque le prix effectue un mouvement significatif, franchissant un point de structure précédent. Il marque les lignes de tendance haussière et baissière possibles (UP & DN, c'est-à-dire de nouveaux sommets et de nouveaux creux continus), et une fois que le prix franchit ces lignes, il marque des flèches rouges (BEAR) et ver
SolarTrade Suite Financial Indicator: Jupiter Market Indicator - Votre guide fiable dans le monde des marchés financiers ! Il s'agit d'un indicateur de tendance qui utilise des algorithmes spéciaux innovants et avancés pour calculer sa valeur, et qui présente également un design agréable à l'œil. Il est très facile de comprendre les lectures de cet indicateur : couleur bleue - achat, rouge - vente. Découvrez nos autres produits de la série SolarTrade Suite au bas de la description. Vous sou
KT Renko Patterns MT5
KEENBASE SOFTWARE SOLUTIONS
KT Renko Patterns scans the Renko chart brick by brick to find some famous chart patterns that are frequently used by traders across the various financial markets. Compared to the time-based charts, patterns based trading is easier and more evident on Renko charts due to their uncluttered appearance. KT Renko Patterns features multiple Renko patterns, and many of these patterns are extensively explained in the book titled Profitable Trading with Renko Charts by Prashant Shah. A 100% automated
STRICTLY FOR BOOM INDEX ONLY!!!!! Here I bring the Maximum Trend Arrows OT1.0 MT5 indicator. This indicator is made up of a combination of different trend indicators for entries and exits, for entries an orange arrow will paint on the chart below the current market and a red flag for closing of trades and it produces buy arrows only. When the orange arrow appears, it will appear along with it's sound to notify you. The 1H timeframe is recommended, don't use it anywhere else than on the 1H timefr
KT Horizontal Lines MT5
KEENBASE SOFTWARE SOLUTIONS
In MetaTrader, plotting multiple   horizontal lines   and then tracking their respective price levels can be a hassle. This indicator automatically plots multiple horizontal lines at equal intervals for setting price alerts, plotting support and resistance levels, and other manual purposes. This indicator is suitable for Forex traders who are new and looking for chances to make quick profits from buying and selling. Horizontal lines can help traders find possible areas to start trading when the
This Indicator enhances the default Relative Strength Index (RSI) by introducing several improvements. First, it visually highlights overbought and oversold regions by changing the RSI color from white to red. Second, it includes additional reference lines at 20, 40, 50, 60, and 80, providing a clearer framework for assessing RSI values. The most notable feature is the use of the middle 50-line to indicate the current market cycle. The color of the 50-line dynamically reflects the cycle: green f
Le niveau Premium est un indicateur unique avec une précision de plus de 80 % des prédictions correctes ! Cet indicateur a été testé par les meilleurs Trading Specialists depuis plus de deux mois ! L'indicateur de l'auteur que vous ne trouverez nulle part ailleurs ! À partir des captures d'écran, vous pouvez constater par vous-même la précision de cet outil ! 1 est idéal pour le trading d'options binaires avec un délai d'expiration de 1 bougie. 2 fonctionne sur toutes les paires de devises
Il s'agit d'un indicateur MTF des niveaux de support et de résistance basé sur les   extremums de l'indicateur Advanced ZigZag Dynamic   et/ou   Extended Fractals   avec des étiquettes de prix (peut être désactivé). Des TF plus élevés peuvent être sélectionnés pour le mode MTF. Par défaut, les niveaux sont générés en fonction des points indicateurs ZigZag. Les points indicateurs de fractales peuvent également être utilisés avec ZigZag ou à sa place. Afin de simplifier l'utilisation et d'économis
Atomic Analyst MT5
Issam Kassas
4.32 (19)
Tout d'abord, il convient de souligner que cet indicateur de trading n'est ni repainting, ni redrawing et ne présente aucun délai, ce qui le rend idéal à la fois pour le trading manuel et automatisé. Manuel de l'utilisateur : réglages, entrées et stratégie. L'Analyste Atomique est un indicateur d'action sur les prix PA qui utilise la force et le momentum du prix pour trouver un meilleur avantage sur le marché. Équipé de filtres avancés qui aident à éliminer les bruits et les faux signaux, et à
This indicator obeys the popular maxim that: "THE TREND IS YOUR FRIEND" It paints a Blue line for BUY and also paints a RED line for SELL. (you can change the colors). It gives alarms and alerts of all kinds. IT DOES NOT REPAINT COLOR and can be used for all currency pairs and timeframes. Yes, as easy and simple as that. Even a newbie can use it to make great and reliable trades. MetaTrader 4 Version    
Flow Bookmap
Thalles Nascimento De Carvalho
Flow Bookmap : Visualisez le Flux du Marché et Protégez vos Trades ️ VOUS VOULEZ DOMINER LE MARCHÉ AVEC DES INFORMATIONS PRÉCISES SUR LES ACHETEURS ET LES VENDEURS ? Flow Bookmap est l'outil ultime pour les traders qui souhaitent comprendre en profondeur le comportement du marché. Il transforme les données du flux d'ordres en une interface intuitive sur le graphique MT5, mettant en évidence les zones d'intérêt critiques pour prendre des décisions rapides et sécurisées. Comment ça fonct
Trend Master Chart MT5
Frederic Jacques Collomb
Trend Master Chart est l'indicateur de tendance qu'il vous faut. Il se superpose au graphique et utilise un code couleur pour définir les différentes tendances/impulsions du marché. Il utilise un algorithme qui combine deux moyennes mobiles et différents oscillateurs. Les périodes de ces trois élément sont modifiables. Il fonctionne sur n'importe quel time-frame et n'importe quelle Pair. D'un coup d’œil vous pourrez identifier une tendance haussière ou baissière et les différents points d'entrée
Point Black
Ignacio Agustin Mene Franco
Black Card Pack indicator 5/1 point black It has the strategy of professional bollingers where each arrow gives you a different entry signal. It is used to operate in m1 and in d1 It is used for scalping and intraday, modified for forex markets ! suitable for all pairs modified for synthetic index markets suitable for all pairs! Ideal for volatility and jumps!
Rainbow EA MT5
Jamal El Alama
Description : Rainbow EA MT5 is a simple Expert advisor based on   Rainbow MT5 indicator witch is based on Moving average with period 34. The indicator is incorporated in the EA, therefore, it is not required for the EA to operate, but if you wish, you can download it from   my product page . The Expert Advisor settings are as follows : Suitable for Timeframes up to H1 The parameters below can be set according to your trading rules. StopLoss ( Stop Loss in pips) TakeProfit ( Take Profit in pips
Awesome Oscillator by Bill Williams with the ability to fine-tune and replace the averaging algorithms of the indicator, which significantly expands the possibilities of using this oscillator in algorithmic trading and brings it closer in its properties to such an indicator as the MACD. To reduce price noise, the final indicator is processed with an additional Smooth averaging. The indicator has the ability to give alerts, send mail messages and push signals when the direction of movement of th
SuperTrend MT5
KEENBASE SOFTWARE SOLUTIONS
KT SuperTrend is a modified version of the classic SuperTrend indicator with new useful features. Whether its Equities, Futures, and Forex, the beginners' traders widely use the Supertrend indicator.  Buy Signal: When price close above the supertrend line. Sell Signal: When price close below the supertrend line. Features A multi-featured SuperTrend coded from scratch. Equipped with a multi-timeframe scanner. The last signal direction and entry price showed on the chart. All kinds of MetaTrader
Renko Gold
Ignacio Agustin Mene Franco
Renko Gold! clearly indicates the floors and ceilings where it goes from 4 lines, the line below that marks the floor in green confirming with the thinnest line clarifies the purchase entry, the same is for sale, the top line marks the ceiling and the thinnest red line marks the sale, This indicator works for all temporalities! For Forex and Synthetic Indices markets! It also works for crypto markets! Good profit! World Investor.
KT Pin Bar MT5
KEENBASE SOFTWARE SOLUTIONS
KT Pin Bar identifies the pin bar formation which is a type of price action pattern which depicts a sign of reversal or rejection of the trend. When combined with support and resistance, BRN and other significant levels, Pin Bar pattern proved to be a very strong sign of reversal. Basically, a pin bar is characterized by a small body relative to the bar length which is closed either in upper or lower 50% part of its length. They have very large wicks and small candle body. A pin bar candlestic
Double HMA MTF for MT5
Pavel Zamoshnikov
4 (4)
This is an advanced multi-timeframe version of the popular Hull Moving Average (HMA) Features Two lines of the Hull indicator of different timeframes on the same chart. The HMA line of the higher timeframe defines the trend, and the HMA line of the current timeframe defines the short-term price movements. A graphical panel with HMA indicator data from all timeframes at the same time . If the HMA switched its direction on any timeframe, the panel displays a question or exclamation mark with a tex
To download MT4 version please click here . - This is the exact conversion from TradingView: " PA-Adaptive Hull Parabolic " By "Loxx". - This is a non-repaint and light processing load indicator - You can message in private chat for further changes you need. - All input options are available. - Buffers are available for processing within EAs. - Highlight option is omitted as does not show good in Metatrader. 
LT Rainbow Trend
Thiago Duarte
5 (1)
Do you, like me, like to trade with the trend? Then this indicator will help you! Rainbow Trend is a trend indicator, which uses several Moving Averages on the chart. It measures different trend strenght zones for different periods: very long term, long term, mid term, short term and very short term. Each zone has its color, and it is possible to have sound alert when the prices leaves a zone and enters another. Its configuration is very simple. If you find any bug or have any suggestions, conta
Volality Index Scalper
Lesedi Oliver Seilane
5 (1)
Volality Index scalper indicator  Meant for Volality pairs such as Volality 10, 25, 50, 75 and 100 The indicator works on all timeframes from the 1 minute to the monthly timeframe the indicator is non repaint the indicator has 3 entry settings 1 color change on zero cross 2 color change on slope change 3 color change on signal line cross Orange line is your sell signal Blue line is your buy signal.
This indicator uses the metaquotes ZigZag indicator as base to plot fibonacci extension and fibonacci retracement based in the Elliot waves. A fibonacci retracement will be plotted on every wave draw by the ZigZag. A fibonacci extension will be plotted only after the 2nd wave. Both fibonacci will be updated over the same wave tendency. Supporting until 9 consecutive elliot waves. Parameters: Depth: How much the algorithm will iterate to find the lowest and highest candles Deviation: Amount of
Trend Monitor MT5
Pavel Zamoshnikov
4.5 (2)
The indicator generates early signals basing on ADX reading data combined with elements of price patterns. Works on all symbols and timeframes. The indicator does not redraw its signals. You see the same things on history and in real time. For better visual perception signals are displayed as arrows (in order not to overload the chart). Features The best results are obtained when the indicator works on two timeframes. For example: M30 – the indicator shows the main trend; M5 – the indicator gen
Les acheteurs de ce produit ont également acheté
Golden Trend Indicator MT5
Noha Mohamed Fathy Younes Badr
4.88 (16)
Golden Trend indicator  is The best indicator for predicting trend movement this indicator never lags and never repaints and never back paints    and give  arrow buy and sell    before the candle appear  and it will help you and  will make your trading decisions clearer its work on all currencies and  gold and crypto and all time frame This unique  indicator uses very secret algorithms to catch the  trends, so you can trade using this indicator and see the trend clear on charts  manual guide and
CBT Quantum Maverick Système de Trading Binaire Haute Efficacité CBT Quantum Maverick est un système de trading binaire hautement performant, conçu pour les traders recherchant précision, simplicité et discipline. Aucune personnalisation n'est nécessaire : ce système est optimisé pour des résultats efficaces dès son installation. Avec un peu de pratique, il est facile de maîtriser les signaux. Caractéristiques principales : Précision des signaux : Signaux basés sur la bougie actuelle, ciblant
Top indicator for MT5   providing accurate signals to enter a trade without repainting! It can be applied to any financial assets:   forex, cryptocurrencies, metals, stocks, indices .  Watch  the video  (6:22) with an example of processing only one signal that paid off the indicator! MT4 version is here It will provide pretty accurate trading signals and tell you when it's best to open a trade and close it. Most traders improve their trading results during the first trading week with the help of
Quantum TrendPulse
Bogdan Ion Puscasu
5 (13)
Présentation de   Quantum TrendPulse   , l'outil de trading ultime qui combine la puissance de   SuperTrend   ,   RSI   et   Stochastic   dans un seul indicateur complet pour maximiser votre potentiel de trading. Conçu pour les traders qui recherchent précision et efficacité, cet indicateur vous aide à identifier les tendances du marché, les changements de dynamique et les points d'entrée et de sortie optimaux en toute confiance. Caractéristiques principales : Intégration SuperTrend :   suivez f
TPSproTREND PrO MT5
Roman Podpora
4.69 (16)
TPSpro TREND PRO  - is a trend indicator that automatically analyzes the market and provides information about the trend and each of its changes, as well as giving signals for entering trades without redrawing! The indicator uses each candle, analyzing them separately. referring to different impulses - up or down impulse. Exact entry points into transactions for currencies, crypto, metals, stocks, indices!  ИНСТРУКЦИЯ RUS         INSTRUCTIONS  ENG       R ecommended to use with an indicator   -
TPSpro RFI Levels MT5
Roman Podpora
4.53 (19)
INSTRUCTIONS       RUS   -   ANGLAIS       Il   est recommandé de l'utiliser avec un indicateur       -       TPSpro   TENDANCE PRO -   Version MT4         Bonus: 6 months of  "RFI SIGNALS"  subscription with your purchase! Un élément clé du trading est constitué par les zones ou les niveaux à partir desquels les décisions d'achat ou de vente d'un instrument de trading sont prises. Malgré les tentatives des principaux acteurs de dissimuler leur présence sur le marché, ils laissent inévitable
Bill Williams Advanced
Siarhei Vashchylka
5 (9)
Bill Williams Advanced is designed for automatic chart analysis using Bill Williams' "Profitunity" system. The indicator analyzes four timeframes at once. Manual (Be sure to read before purchasing) Advantages 1. Automatically analyzes the chart using the "Profitunity" system of Bill Williams. The found signals are placed in a table in the corner of the screen. 2. Equipped with a trend filter based on the Alligator indicator. Most of the system signals are recommended to be used only according t
Ce tableau de bord affiche les derniers   modèles harmoniques   disponibles pour les symboles sélectionnés, ce qui vous permettra de gagner du temps et d'être plus efficace /   version MT4 . Indicateur gratuit:   Basic Harmonic Pattern Colonnes de l'indicateur Symbol :   les symboles sélectionnés apparaissent Trend   :   haussière ou baissière Pattern :   type de motif (gartley, papillon, chauve-souris, crabe, requin, cypher ou ABCD) Entry:   prix d'entrée SL:   prix du stop loss TP1:   1er
Présentation       Quantum Breakout PRO   , l'indicateur révolutionnaire MQL5 qui transforme la façon dont vous négociez les zones d'évasion ! Développé par une équipe de traders expérimentés avec une expérience commerciale de plus de 13 ans,       Évasion quantique PRO       est conçu pour propulser votre parcours commercial vers de nouveaux sommets grâce à sa stratégie de zone de discussion innovante et dynamique. Quantum Breakout Indicator vous donnera des flèches de signalisation sur les z
RelicusRoad Pro MT5
Relicus LLC
4.78 (18)
Maintenant 147 $ (augmentant à 499 $ après quelques mises à jour) - Comptes illimités (PCS ou Mac) Manuel d'utilisation RelicusRoad + Vidéos de formation + Accès au groupe Discord privé + Statut VIP UNE NOUVELLE FAÇON DE REGARDER LE MARCHÉ RelicusRoad est l'indicateur de trading le plus puissant au monde pour le forex, les contrats à terme, les crypto-monnaies, les actions et les indices, offrant aux traders toutes les informations et tous les outils dont ils ont besoin pour rester rentables
FxaccurateLS
Shiv Raj Kumawat
WHY IS OUR FXACCCURATE LS MT5 THE PROFITABLE ? PROTECT YOUR CAPITAL WITH RISK MANAGEMENT Gives entry, stop and target levels from time to time. It finds Trading opportunities by analyzing what the price is doing during established trends. POWERFUL INDICATOR FOR A RELIABLE STRATEGIES We have made these indicators with a lot of years of hard work. It is made at a very advanced level. Established trends provide dozens of trading opportunities, but most trend indicators completely ignore them! The
L'indicateur de Carré Gann est un puissant outil d'analyse du marché basé sur l'article "Formule Mathématique pour les Prédictions de Marché" écrit par W.D. Gann. Cet outil utilise des concepts mathématiques et des théories de Gann pour réaliser une analyse précise du marché. Il utilise les carrés de 144, 90, 52 et aussi le carré de 9. De plus, il intègre la méthode du  pour le carré de 9 et sa relation avec les canaux et le modèle en étoile de ce carré. Manuel d'Utilisateur et Application : Ava
BookMap HeatMap
Roberto Spadim
1 (2)
This Indicator creates a heatmap based on depth of market of the current symbol or another symbol. Other symbol is useful when you trade futures market and a contract has 'mini' and 'full' split. For example, in Brazil (B3 - BMF&Bovespa), WDO and DOL are future Forex contract of BRL/USD (where 1 DOL = 5 WDO) and big banks work mostly with DOL (where liquidity is important). Please use with M1 timeframe , objects are too small to be displayed at higher timeframes (MT5 limit). The number of level
Berma Bands
Muhammad Elbermawi
5 (3)
L'indicateur Berma Bands (BB) est un outil précieux pour les traders qui cherchent à identifier et à capitaliser sur les tendances du marché. En analysant la relation entre le prix et les BB, les traders peuvent déterminer si un marché est dans une phase de tendance ou de range. Visitez le [ Berma Home Blog ] pour en savoir plus. Les bandes de Berma sont composées de trois lignes distinctes : la bande de Berma supérieure, la bande de Berma moyenne et la bande de Berma inférieure. Ces lignes sont
Royal Scalping Indicator M5
Vahidreza Heidar Gholami
5 (6)
Royal Scalping Indicator is an advanced price adaptive indicator designed to generate high-quality trading signals. Built-in multi-timeframe and multi-currency capabilities make it even more powerful to have configurations based on different symbols and timeframes. This indicator is perfect for scalp trades as well as swing trades. Royal Scalping is not just an indicator, but a trading strategy itself. Features Price Adaptive Trend Detector Algorithm Multi-Timeframe and Multi-Currency Trend Low
CONTACT US  after purchase to get the Indicator Manual. Try Now—Limited 50% Discount for First 10 Buyers! Download the  Metatrader 4 Version Read the product description carefully before purchasing the product.  Due to regulatory restrictions, our service is unavailable in certain countries such as India, Pakistan, and Bangladesh. William Delbert Gann (W.D. Gann) was an exceptional market analyst, whose trading technique was based on a complex blend of mathematics, geometry, astrology, and anc
Gold Trend 5
Sergei Linskii
5 (1)
Gold Trend - il s'agit d'un bon indicateur technique boursier. L'algorithme de l'indicateur analyse le mouvement du prix d'un actif et reflète la volatilité et les zones d'entrée potentielles. Les meilleurs signaux de l'indicateur: - Pour la VENTE = histogramme rouge + pointeur SHORT rouge + flèche de signalisation jaune dans la même direction. - Pour l'ACHETER = histogramme bleu + pointeur LONG bleu + flèche de signalisation aqua dans la même direction. Avantages de l'indicateur: 1. L'in
Quantum Heiken Ashi PRO MT5
Bogdan Ion Puscasu
4.44 (9)
Présentation du   Quantum Heiken Ashi PRO Conçues pour fournir des informations claires sur les tendances du marché, les bougies Heiken Ashi sont réputées pour leur capacité à filtrer le bruit et à éliminer les faux signaux. Dites adieu aux fluctuations de prix déroutantes et bonjour à une représentation graphique plus fluide et plus fiable. Ce qui rend le Quantum Heiken Ashi PRO vraiment unique, c'est sa formule innovante, qui transforme les données traditionnelles des chandeliers en barres col
Advanced Supply Demand MT5
Bernhard Schweigert
4.5 (14)
La meilleure solution pour tout commerçant débutant ou expert ! Cet indicateur est un outil de trading unique, de haute qualité et abordable car nous avons intégré un certain nombre de fonctionnalités propriétaires et une nouvelle formule. Avec cette mise à jour, vous pourrez afficher des zones à double horaire. Vous pourrez non seulement afficher un TF plus élevé, mais afficher les deux, le graphique TF, PLUS le TF supérieur : AFFICHAGE DES ZONES NICHÉES. Tous les traders Supply Demand vont ado
Indicateur unique qui met en œuvre une approche professionnelle et quantitative pour signifier le trading de réversion. Il capitalise sur le fait que le prix dévie et revient à la moyenne de manière prévisible et mesurable, ce qui permet des règles d'entrée et de sortie claires qui surpassent largement les stratégies de trading non quantitatives. [ Installation Guide | Update Guide | Troubleshooting | FAQ | All Products ] Des signaux de trading clairs Étonnamment facile à échanger Couleurs et t
Golden Spikes Detector
Batsirayi L Marango
3.25 (4)
Golden Spikes Detector Cet indicateur est basé sur une stratégie avancée principalement pour les pics de trading sur les indices Boom et Crash. Des algorithmes complexes ont été mis en œuvre pour détecter uniquement les entrées à forte probabilité. Il alerte sur les entrées potentielles d’achat et de vente. Pour échanger des pics sur le courtier Deriv ou Binary, prenez uniquement les alertes Buy Boom et Sell Cash. Il a été optimisé pour être chargé sur une période de 5 minutes, bien qu'une analy
Tout d'abord, il convient de souligner que ce système de trading est un indicateur non repeint, non redessiné et non retardé, ce qui le rend idéal pour le trading manuel et automatisé. Cours en ligne, manuel et téléchargement de préréglages. Le "Système de Trading Smart Trend MT5" est une solution de trading complète conçue pour les traders débutants et expérimentés. Il combine plus de 10 indicateurs premium et propose plus de 7 stratégies de trading robustes, ce qui en fait un choix polyvalent
Volume Horizon is a horizontal volume indicator that allows you to observe the density of market participants' volumes across various price and time intervals. Volume histograms can be constructed based on ascending or descending market waves, as well as individual bars. This tool enables more precise determination of entry or exit points, relying on levels of maximum volumes or volume-weighted average prices (VWAP). What makes Volume Horizon unique? 1. Segmentation into ascending and descendi
EMA Scalper Indicator is an indicator of EMA lines and reversal EMA lines. Each pair of EMA channels area that can be used to make reversal entry. After the EMA lines are widening because of major trend, the area can be used to find profitable entry and exit, especially after EMA reversal. Do the cut loss whenever candle closed outside the area. The A, B, C, D, and E area are colored differently. Solid lines: Normal EMA lines. Dashed lines: Reversal EMA lines.
Kecia Footprint Orderflow
Niccolo Filippo Palombi
5 (1)
IF YOU WANT TO TEST IT : private message me ( MT5 demo testing doesn't work ) * UPDATE * VOLUME PROFILE ADDED Designed to help traders gain a deeper understanding of the market’s true order flow dynamics . By visualizing the “ footprints ” left by candles, this indicator reveals how the delta ( the difference between buying and selling pressure ) changes during the candle formation, as well as how volume fluctuates at different price levels. These insights are essential for traders seeking to id
Quantum Trend Sniper
Bogdan Ion Puscasu
4.73 (51)
Présentation       Quantum Trend Sniper Indicator   , l'indicateur révolutionnaire MQL5 qui transforme la façon dont vous identifiez et négociez les inversions de tendance ! Développé par une équipe de traders expérimentés avec une expérience commerciale de plus de 13 ans,       Indicateur Quantum Trend Sniper       est conçu pour propulser votre parcours de trading vers de nouveaux sommets grâce à sa manière innovante d'identifier les inversions de tendance avec une précision extrêmement élevée
TPA True Price Action indicator reveals the true price action of the market makers through 100% non-repainting signals strictly at the close of a candle! TPA shows entries and re-entries, every time the bulls are definitely stronger than the bears and vice versa. Not to confuse with red/green candles. The shift of power gets confirmed at the earliest stage and is ONE exit strategy of several. There are available now two free parts of the TPA User Guide for our customers. The first "The Basics"
AT Forex Indicator MT5
Marzena Maria Szmit
5 (5)
The AT Forex Indicator MT5 is a sophisticated trading tool designed to provide traders with a comprehensive analysis of multiple currency pairs. This powerful indicator simplifies the complex nature of the forex market, making it accessible for both novice and experienced traders. AT Forex Indicator uses advanced algorithms to detect trends, patterns and is an essential tool for traders aiming to enhance their forex trading performance. With its robust features, ease of use, and reliable signal
Ce tableau de bord découvre et affiche les zones   d'offre   et de   demande   sur le graphique, à la fois en mode scalping et à long terme, en fonction de votre stratégie de trading pour les symboles sélectionnés. En outre, le mode scanner du tableau de bord vous permet de vérifier tous les symboles souhaités en un coup d'œil et de ne manquer aucune position appropriée /   Version MT4 Indicateur gratuit:   Basic Supply Demand Caractéristiques Permet de visualiser les opportunités de tradin
Royal Wave Pro M5
Vahidreza Heidar Gholami
3.5 (4)
Royal Wave is a Trend-Power oscillator which has been programmed to locate and signal low-risk entry and exit zones. Its core algorithm statistically analyzes the market and generates trading signals for overbought, oversold and low volatile areas. By using a well-designed alerting system, this indicator makes it easier to make proper decisions regarding where to enter and where to exit trades. Features Trend-Power Algorithm Low risk Entry Zones and Exit Zones Predictions for Overbought and Over
Plus de l'auteur
Le Range Breakout EA est un système de trading automatisé puissant conçu pour tirer parti des opportunités de cassures durant les premières heures d’activité du marché. À l’aide d’une stratégie bien définie, cet EA identifie la plage de prix de la première heure de la journée et place des ordres en attente pour capturer l’élan de la cassure. Il inclut également un mécanisme facultatif de Martingale pour maximiser les profits et récupérer après une perte. Caractéristiques principales : 1. Straté
Filtrer:
Aucun avis
Répondre à l'avis
Version 11.11 2024.12.12
Minor fixes