Archimede Volume Profiler
- Utilitaires
- Luigi Lopez
- Version: 1.0
- Activations: 10
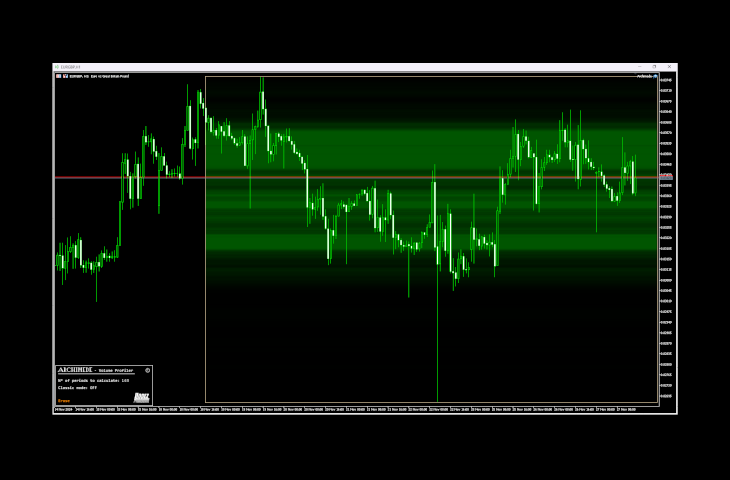
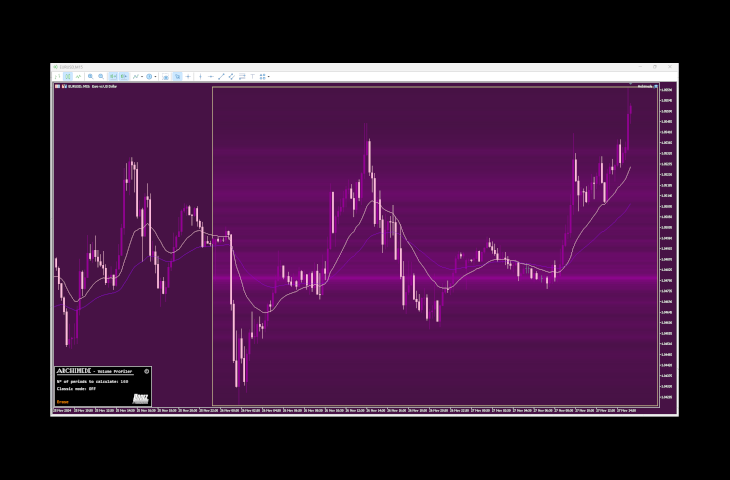
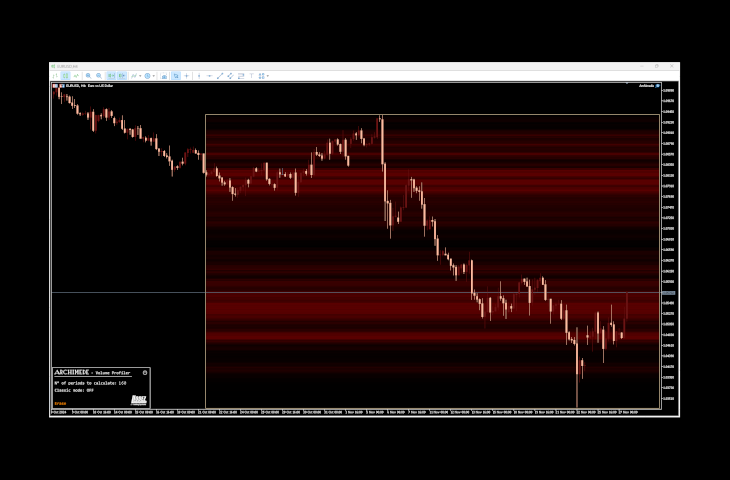
This tool highlights on the chart the areas of greatest interest to a trader with bands or lines of varying colour intensity indicating the levels on which the price on the chart in question has been stationary the longest.
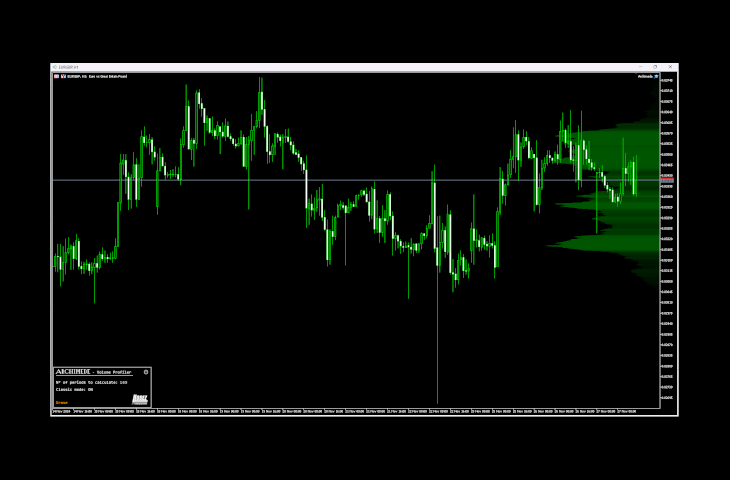
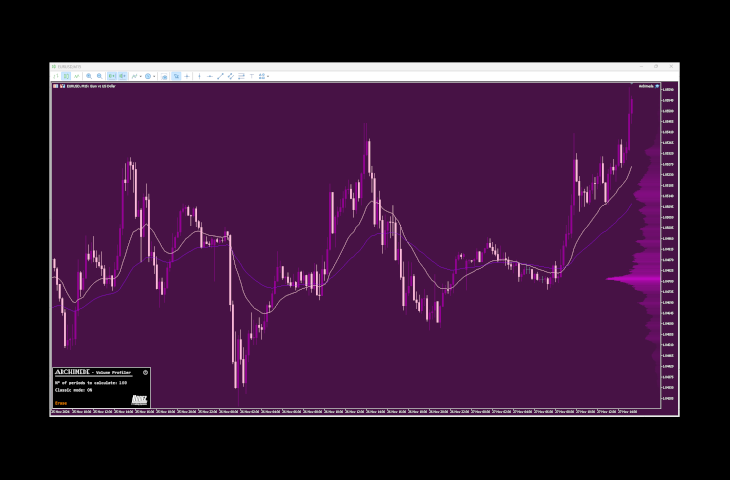
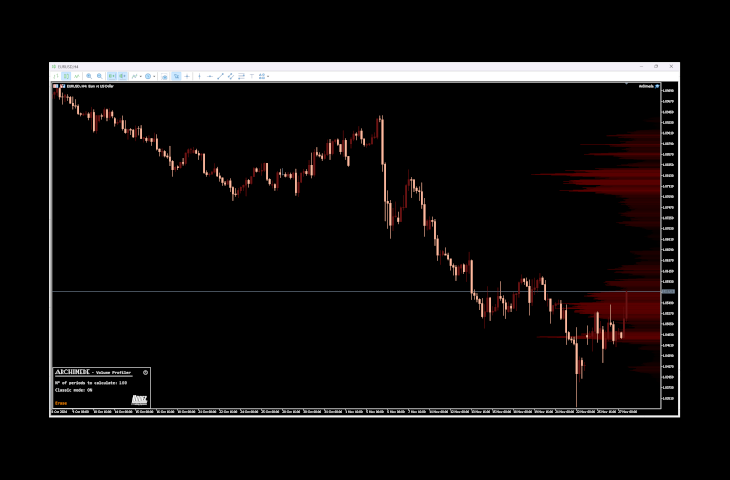
It works in the classic mode, drawing a histogram on the right-hand side of the chart, or in a new mode consisting of bands of varying colour intensity, with the most intensely coloured ones representing the price levels with the most intense volumes.
Volumes are always calculated based on the 1-minute timeframe, whatever the timeframe of the chart. This makes Archimedes extremely accurate whatever the timeframe on which the user is working.
Extremely simple in its use, with a convenient and unobtrusive interface.
Input parameters:
- Language (English, Italian or Spanish).
- Font type.
- Colour of the volumes to be drawn.