• Aperçu
  • Avis
  • Commentaires

AVP Market Sentiment

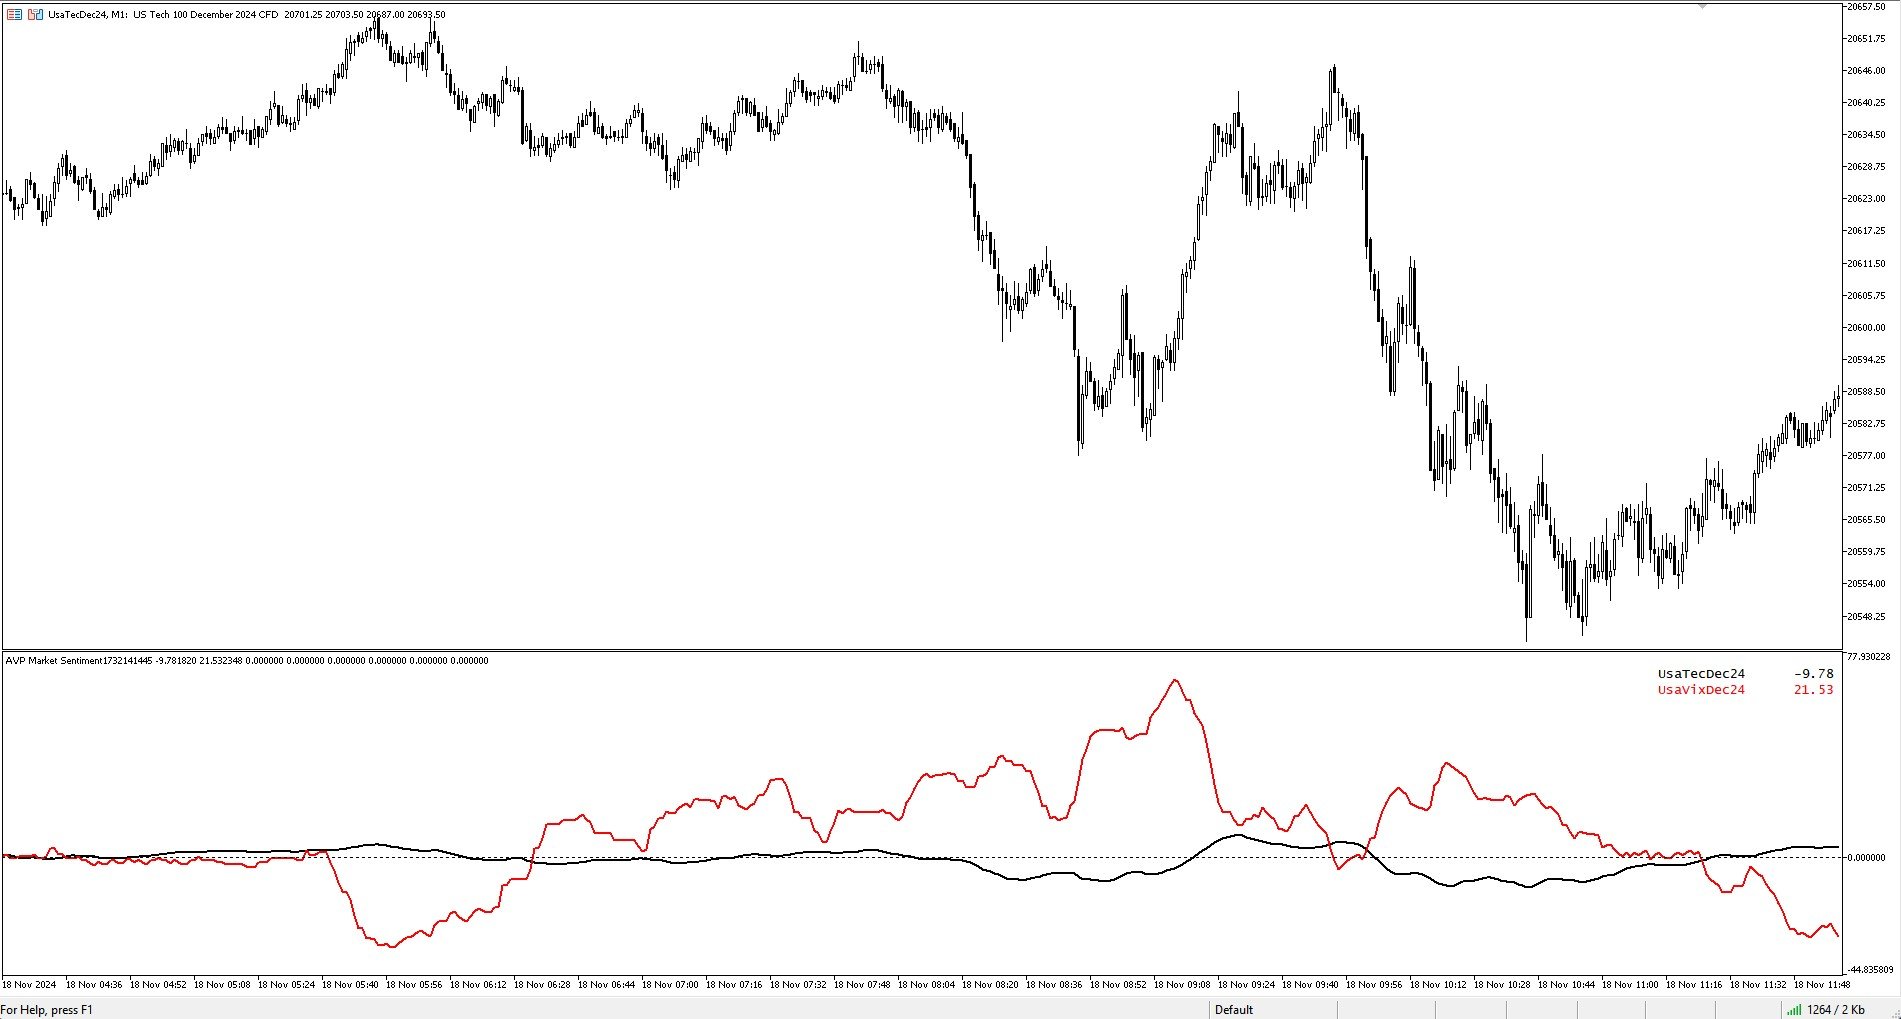
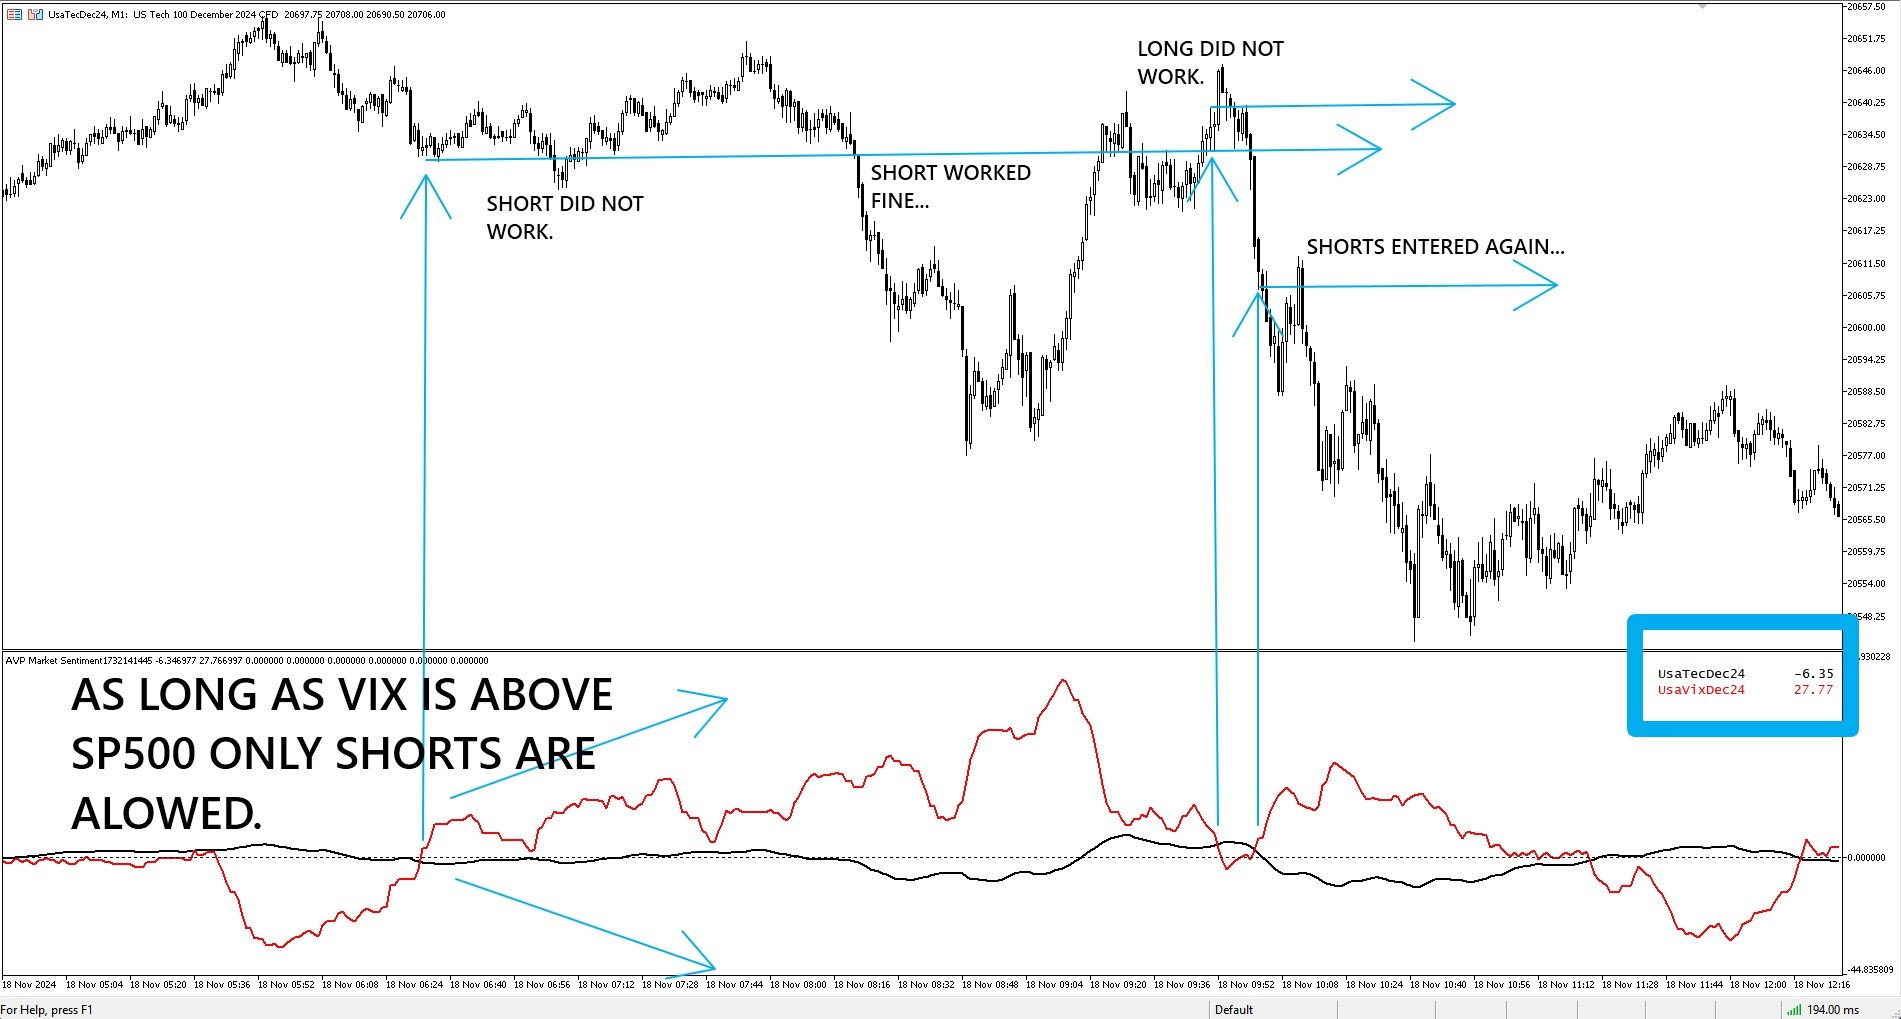
AVP Market Sentiment est un outil développé pour analyser la relation entre plusieurs actifs dans la même fenêtre de sous-graphique. Il est particulièrement utile pour comparer des tickers avec une interrelation bien étudiée (comme les indices futurs versus le VIX, par exemple). Il est très utile lorsque vous souhaitez suivre plusieurs tickers simultanément pour prendre des décisions concernant l'un ou plusieurs d'entre eux. L'outil permet aux utilisateurs de choisir les types de moyennes mobiles utilisées sur la plateforme, ainsi que les périodes de ces moyennes et de personnaliser les couleurs de chacune des lignes affichées. Un outil léger, rapide dans les calculs et extrêmement polyvalent dans son analyse.

L'importance de l'analyse inter-marché dans les investissements à revenu variable

Dans le monde dynamique des investissements à revenu variable, l'analyse de marché est un outil essentiel pour les investisseurs qui cherchent à maximiser leurs rendements et à minimiser les risques. La complexité des marchés financiers mondiaux nécessite une compréhension approfondie des interrelations entre divers actifs, y compris les paires de devises, les métaux précieux comme l'or et l'argent, les indices à terme ainsi que le VIX, l'indice de volatilité.

Interrelations mondiales

Les marchés financiers sont intimement interconnectés. Les mouvements d'un marché peuvent avoir des répercussions importantes sur d'autres. Par exemple, les fluctuations des paires de devises comme EUR/USD peuvent directement affecter la valeur des matières premières comme l'or et l'argent. Cela se produit parce que la valeur de ces matières premières est souvent cotée en dollars américains, les rendant sensibles aux fluctuations des taux de change.

De plus, la politique monétaire des grandes économies comme les États-Unis et la zone euro influence les taux de change et, par conséquent, les marchés des matières premières. Par exemple, lorsque la Réserve fédérale modifie les taux d'intérêt, cela peut déclencher une série de réactions en chaîne qui affectent tout, des marchés boursiers aux prix du pétrole.

Métaux précieux et devises

L'or et l'argent sont considérés comme des actifs refuges, surtout en période d'incertitude économique. La relation entre ces métaux et les devises est complexe. Lorsque le dollar se renforce, le prix de l'or a tendance à baisser, et vice versa. Les investisseurs suivent de près ces dynamiques pour ajuster leurs stratégies d'investissement, recherchant une protection ou un levier selon les besoins.

Historiquement, l'or a été perçu comme une protection contre l'inflation et la dévaluation des devises. Lors de crises financières, comme celle de 2008, le prix de l'or a explosé à mesure que les investisseurs cherchaient de la sécurité. L'argent, bien que moins précieux que l'or, joue également un rôle important, notamment dans les applications industrielles, ce qui ajoute une couche supplémentaire de complexité à son analyse.

Indices à terme et le VIX

Les indices à terme, tels que le S&P 500 et le Dow Jones, offrent un aperçu précoce du sentiment du marché. Ce sont des indicateurs précieux pour prédire les mouvements du marché et ajuster les positions. Le VIX, connu sous le nom d'"indice de la peur", mesure la volatilité attendue du marché. Un VIX élevé indique une plus grande incertitude, ce qui peut entraîner des ajustements dans les portefeuilles d'investissement pour atténuer les risques.

Par exemple, pendant les périodes de forte volatilité, les investisseurs peuvent choisir d'augmenter leurs positions dans des actifs refuges ou d'ajuster leurs stratégies de couverture. Le VIX ne reflète pas seulement la peur du marché, il peut également être utilisé comme un outil de négociation, permettant aux investisseurs de spéculer sur la volatilité future.

Stratégies d'analyse de marché

Pour réaliser une analyse efficace, les investisseurs doivent envisager une combinaison d'analyse fondamentale et technique. L'analyse fondamentale implique l'étude des facteurs économiques, financiers et d'autres éléments qualitatifs pouvant influencer la valeur d'un actif. Cela inclut l'analyse des rapports économiques, des décisions de politique monétaire et des événements géopolitiques.

D'autre part, l'analyse technique se concentre sur les modèles de prix et de volume sur le marché. Des outils comme les moyennes mobiles, les bandes de Bollinger et les indicateurs de momentum sont utilisés pour identifier les tendances et les points d'entrée et de sortie. La combinaison de ces approches peut fournir une vue plus complète du marché.

Conclusion

L'analyse de marché dans le domaine des investissements à revenu variable est cruciale pour naviguer dans l'environnement financier mondial complexe. Comprendre les interrelations entre les actifs, les devises, les métaux précieux et les indices de volatilité permet aux investisseurs de prendre des décisions éclairées, en ajustant leurs stratégies pour saisir des opportunités et se protéger contre les risques. Dans un monde où l'information est un pouvoir, l'analyse de marché est la clé du succès dans l'investissement à revenu variable.


Produits recommandés
Notre indicateur   Basic Support and Resistance   est la solution dont vous avez besoin pour augmenter votre analyse technique.Cet indicateur vous permet de projeter les niveaux de support et de résistance sur le graphique /   Version MT4 Caractéristiques Intégration des niveaux de Fibonacci: avec la possibilité d'afficher les niveaux de Fibonacci aux côtés des niveaux de support et de résistance, notre indicateur vous donne un aperçu encore plus profond du comportement du marché et des zones
L'indicateur SMC Venom Model BPR est un outil professionnel pour les traders travaillant dans le concept Smart Money (SMC). Il identifie automatiquement deux modèles clés sur le graphique des prix: FVG   (Fair Value Gap) est une combinaison de trois bougies, dans laquelle il y a un écart entre la première et la troisième bougie. Forme une zone entre les niveaux où il n'y a pas de support de volume, ce qui conduit souvent à une correction des prix. BPR   (Balanced Price Range) est une combinaiso
Was: $249  Now: $149   Market Profile defines a number of day types that can help the trader to determine market behaviour. A key feature is the Value Area, representing the range of price action where 70% of trading took place. Understanding the Value Area can give traders valuable insight into market direction and establish the higher odds trade. It is an excellent addition to any system you may be using. Inspired by Jim Dalton’s book “Mind Over Markets”, this indicator is designed to suit the
Introducing the Power Trade Plus indicator designed by a small group of traders with a few years of experience trading the market profitably.  The Power Trade Plus is derived from the Power Trade indicator,  the indicator strive in powerful sniper entries and take profit levels,  with an algorithm that's can determine the markets volatility and Provides entries based on the current market volatility. This indicator is much more effective in stock ,currencies and indices.
The Riko Trend indicator is a revolutionary trend trading and filtering solution with all the important features of a trend tool built into one tool! The Riko Trend indicator is good for any trader, suitable for any trader for both forex and binary options. You don’t need to configure anything, everything is perfected by time and experience, it works great during a flat and in a trend. The Riko Trend indicator is a technical analysis tool for financial markets that reflects the current price f
Mine Farm
Maryna Kauzova
Mine Farm is one of the most classic and time-tested scalping strategies based on the breakdown of strong price levels. Mine Farm is the author's modification of the system for determining entry and exit points into the market... Mine Farm - is the combination of great potential with reliability and safety. Why Mine Farm?! - each order has a short dynamic Stop Loss - the advisor does not use any risky methods (averaging, martingale, grid, locking, etc.) - the advisor tries to get the most
This is my first ExpertAdvisor, but it came along with more than 7 years in experience trading Forex , Crypto and Index.                                                                                SHEERAN: The Advanced Multi-Timeframe EA for Dynamic and Adaptive Trading   EA SHEERAN, is designed for traders who demand precision, flexibility, and reliability across multiple timeframes. Whether you’re targeting short-term gains on the M30 chart or looking for sustained moves on the H4, this E
ProEngulfing For MT5
Ashkan Hazegh Nikrou
Version gratuite de ProEngulfing : QualifiedEngulfing, avec une limitation d'un signal par jour et des fonctionnalités réduites. Pour suivre les dernières actualités sur tous les produits Koala, rejoignez le canal Koala Trading Solution dans la communauté mql5 en cliquant sur le lien ci-dessous : https ://www .mql5 .com /en /channels /koalatradingsolution La version MT4 de ce produit est téléchargeable via le lien suivant : https ://www .mql5 .com /en /market /product /52023 Présentation de Pro
KT Renko Patterns MT5
KEENBASE SOFTWARE SOLUTIONS
KT Renko Patterns analyse le graphique Renko brique par brique afin de détecter des figures techniques bien connues, fréquemment utilisées par les traders sur divers marchés financiers. Par rapport aux graphiques basés sur le temps, les Renko offrent une vue épurée, rendant les figures plus faciles à reconnaître et à exploiter. KT Renko Patterns comprend plusieurs figures Renko, dont la majorité sont expliquées en détail dans le livre “Profitable Trading with Renko Charts” de Prashant Shah. Un
Your Trend Friend
Luigi Nunes Labigalini
5 (1)
The trend is your friend! Look at the color of the indicator and trade on that direction. It does not  repaint. After each candle is closed, that's the color of the trend. You can focus on shorter faster trends or major trends, just test what's most suitable for the symbol and timeframe you trade. Simply change the "Length" parameter and the indicator will automatically adapt. You can also change the color, thickness and style of the lines. Download and give it a try! There are big movements w
Mean Reversion Supply Demand Indicator Mean Reversion Supply Demand is the indicator to detect the important supply demand zone in your chart. The concept of supply demand trading relies on the quantity mismatching between buying and selling volumes in the financial market. Typically, supply demand zone serves to predict the turning point. The wave pattern, for any supply demand zone to work as an successful trade, looks like the price must touch the base zone, move away and then return to zone
Volality Index Scalper
Lesedi Oliver Seilane
5 (1)
Volality Index scalper indicator  Meant for Volality pairs such as Volality 10, 25, 50, 75 and 100 The indicator works on all timeframes from the 1 minute to the monthly timeframe the indicator is non repaint the indicator has 3 entry settings 1 color change on zero cross 2 color change on slope change 3 color change on signal line cross Orange line is your sell signal Blue line is your buy signal.
Awesome Oscillator by Bill Williams with the ability to fine-tune and replace the averaging algorithms of the indicator, which significantly expands the possibilities of using this oscillator in algorithmic trading and brings it closer in its properties to such an indicator as the MACD. To reduce price noise, the final indicator is processed with an additional Smooth averaging. The indicator has the ability to give alerts, send mail messages and push signals when the direction of movement of th
Profile Map MT5
Dmitriy Sapegin
5 (5)
Market Profile helps the trader to identify the behavior if major market players and define zones of their interest. The key feature is the clear graphical display of the range of price action, in which 70% of the trades were performed. Understanding of the location of volume accumulation areas can help traders increase the probability of success. The tool can be used as an independent system as well as in combination with other indicators and trading systems. this indicator is designed to suit
Initial Balance MT5
Ricardo Almeida Branco
The Initial Balance (Initial Balance / Initial Balance) is a concept related to the study of volume (to learn more, study about Market Profile and Auction Market Theory. You can find some videos in English when searching for "Initial Balance Market Profile"). The IB defines a range in which prices were negotiated in the first hour of trading.The amplitude of the range is important and the break in the range defined by the Initial Balance may have occurred due to the movement of several players
Provided Trend is a complex signal formation indicator. As a result of the work of internal algorithms, you can see only three types of signals on your chart. The first is a buy signal, the second is a sell signal, and the third is a market exit signal. Options: CalcFlatSlow - The first parameter that controls the main function of splitting the price chart into waves. CalcFlatFast - The second parameter that controls the main function of splitting the price chart into waves. CalcFlatAvg - Para
NeuroExt
Dmytryi Voitukhov
4 (11)
https://t.me/mql5_neuroExt   actual version Signal https://www.mql5.com/ru/signals/1511461 You can use any tool. The bases will be automatically created at the start of the Learn. If you need to start learning from 0 - just delete the base files. Initial deposit - from 200 ye. Options: DO NOT ATTEMPT TO TEST WITHOUT NEURAL NETWORK TRAINING! it is enough for the balance graph after training to be horizontal. generating a training base is extremely simple.  there is a ready-made training for U
FREE
Noize Absorption Index - is the manual trading system that measures the difference of pressure between bears forces and bulls forces. Green line - is a noize free index that showing curent situation. Zero value of index shows totally choppy/flat market.Values above zero level shows how powerfull bullish wave is and values below zero measures bearish forces.Up arrow appears on bearish market when it's ready to reverse, dn arrow appears on weak bullish market, as a result of reverse expectation.
Unlock powerful breakout opportunities The 123 Pattern is one of the most popular, powerful and flexible chart patterns. The pattern is made up of three price points: a bottom, a peak or valley, and a Fibonacci retracement between 38.2% and 71.8%. A pattern is considered valid when the price breaks beyond the last peak or valley, moment at which the indicator plots an arrow, rises an alert, and the trade can be placed. [ Installation Guide | Update Guide | Troubleshooting | FAQ | All Products ]
Avant d'installer l'indicateur HeatMap assurez vous d'utiliser un broker qui vous donne accès au Depth of market (DOM) !! Cet indicateur crée sur votre graphiques une heatmap vous permettant de voir les ordres limites d'achat ou de vente facilement et en temps réel. Vous avez la possibilité de changer de réglage et les couleurs de la HeatMap afin de s'adapter à  tous les marchés et à tous les graphiques. Voici un exemple de réglage que vous pouvez utiliser  avec le SPX500 sur le broker AMPGloba
This indicator allows you to enjoy the two most popular products for analyzing request volumes and market deals at a favorable price: Actual Depth of Market Chart Actual Tick Footprint Volume Chart This product combines the power of both indicators and is provided as a single file. The functionality of Actual COMBO Depth of Market AND Tick Volume Chart is fully identical to the original indicators. You will enjoy the power of these two products combined into the single super-indicator! Below is
Range Directional Force Indicator – Designed for You to Optimize! The Range Directional Force Indicator is a cutting-edge tool designed to empower traders by visualizing market dynamics and directional strength. Built to offer insights into market trends and reversals, this indicator is an invaluable asset for traders seeking precision in their strategies. However, it is important to note that this indicator is not optimized, leaving room for you to tailor it to your unique trading preferences.
The Antique Trend Indicator is a revolutionary trend trading and filtering solution with all the important features of a trend tool built into one tool! The Antique Trend indicator is good for any trader, suitable for any trader both for Forex and binary options. There is no need to configure anything, everything has been perfected by time and experience, it works great during flats and trends. The Antique Trend indicator is a tool for technical analysis of financial markets, reflecting curren
Gecko EA MT5
Profalgo Limited
5 (1)
NEW PROMO: Only a few copies copies available at 349$ Next price: 449$ Make sure to check out our " Ultimate EA combo package " in our   promo blog ! Gecko runs a simple, yet very effective, proven strategy.  It looks for important recent support and resistance levels and will trade the breakouts.  This is a "real" trading system, which means it will use a SL to protect the account.  It also means it will not use any dangerous techniques like martingale, grid or averaging down. The EA shows its
This is the famous Sunflower indicator for Metatrader5. This indicator marks possible tops and bottoms on price charts. The indicator identifies tops and bottoms in the asset's price history, keep in mind that the current sunflower of the last candle repaints, as it is not possible to identify a top until the market reverses and it is also not possible to identify a bottom without the market stop falling and start rising. If you are looking for a professional programmer for Metatrader5, please
STRICTLY FOR BOOM INDEX ONLY!!!!! Here I bring the Maximum Trend Arrows OT1.0 MT5 indicator. This indicator is made up of a combination of different trend indicators for entries and exits, for entries an orange arrow will paint on the chart below the current market and a red flag for closing of trades and it produces buy arrows only. When the orange arrow appears, it will appear along with it's sound to notify you. The 1H timeframe is recommended, don't use it anywhere else than on the 1H timefr
How to use Pair Trading Station Pair Trading Station is recommended for H1 time frame and you can use it for any currency pairs. To generate buy and sell signal, follow few steps below to apply Pair Trading Station to your MetaTrader terminal. When you load Pair Trading Station on your chart, Pair Trading station will assess available historical data in your MetaTrader platforms for each currency pair. On your chart, the amount of historical data available will be displayed for each currency pai
Pullback Hunter
Anton Polkovnikov
PULLBACK HUNTER What is every trader's cherished dream? To see without delay the places where the reversal will happen. This, of course, is from the category of magic, though... nothing is impossible. But for now I've prepared for you an indicator that marks in real time the end of corrections to the current movement or in short - catches pullbacks.What is the main point? Many people practice rebounds when the price moves in the direction of the open position. And they do them on the formation o
L'indicateur DYJ BoS identifie et marque automatiquement les éléments essentiels des changements de structure du marché, notamment : Rupture de structure (BoS) : détectée lorsque le prix effectue un mouvement significatif, franchissant un point de structure précédent. Il marque les lignes de tendance haussière et baissière possibles (UP & DN, c'est-à-dire de nouveaux sommets et de nouveaux creux continus), et une fois que le prix franchit ces lignes, il marque des flèches rouges (BEAR) et ver
Les acheteurs de ce produit ont également acheté
Golden Trend Indicator MT5
Noha Mohamed Fathy Younes Badr
4.88 (17)
Golden Trend indicator  is The best indicator for predicting trend movement this indicator never lags and never repaints and never back paints    and give  arrow buy and sell    before the candle appear  and it will help you and  will make your trading decisions clearer its work on all currencies and  gold and crypto and all time frame This unique  indicator uses very secret algorithms to catch the  trends, so you can trade using this indicator and see the trend clear on charts  manual guide and
TPSpro RFI Levels MT5
Roman Podpora
4.55 (20)
INSTRUCTIONS       RUS   -   ANGLAIS       Il   est recommandé de l'utiliser avec un indicateur       -       TPSpro   TENDANCE PRO -   Version MT4         Bonus: 6 months of  "RFI SIGNALS"  subscription with your purchase! Un élément clé du trading est constitué par les zones ou les niveaux à partir desquels les décisions d'achat ou de vente d'un instrument de trading sont prises. Malgré les tentatives des principaux acteurs de dissimuler leur présence sur le marché, ils laissent inévitable
TPSproTREND PrO MT5
Roman Podpora
4.72 (18)
VERSION MT4        —        ИНСТРУКЦИЯ RUS           —        INSTRUCTIONS  ENG Fonctions principales : Signaux d'entrée précis SANS RENDU ! Si un signal apparaît, il reste d’actualité ! Il s'agit d'une différence importante par rapport aux indicateurs de redessinage, qui peuvent fournir un signal puis le modifier, ce qui peut entraîner une perte de fonds en dépôt. Vous pouvez désormais entrer sur le marché avec plus de probabilité et de précision. Il existe également une fonction de coloration
Quantum TrendPulse
Bogdan Ion Puscasu
5 (13)
Présentation de   Quantum TrendPulse   , l'outil de trading ultime qui combine la puissance de   SuperTrend   ,   RSI   et   Stochastic   dans un seul indicateur complet pour maximiser votre potentiel de trading. Conçu pour les traders qui recherchent précision et efficacité, cet indicateur vous aide à identifier les tendances du marché, les changements de dynamique et les points d'entrée et de sortie optimaux en toute confiance. Caractéristiques principales : Intégration SuperTrend :   suivez f
CBT Quantum Maverick Système de Trading Binaire Haute Efficacité CBT Quantum Maverick est un système de trading binaire hautement performant, conçu pour les traders recherchant précision, simplicité et discipline. Aucune personnalisation n'est nécessaire : ce système est optimisé pour des résultats efficaces dès son installation. Avec un peu de pratique, il est facile de maîtriser les signaux. Caractéristiques principales : Précision des signaux : Signaux basés sur la bougie actuelle, ciblant
Royal Scalping Indicator M5
Vahidreza Heidar Gholami
5 (6)
Royal Scalping Indicator is an advanced price adaptive indicator designed to generate high-quality trading signals. Built-in multi-timeframe and multi-currency capabilities make it even more powerful to have configurations based on different symbols and timeframes. This indicator is perfect for scalp trades as well as swing trades. Royal Scalping is not just an indicator, but a trading strategy itself. Features Price Adaptive Trend Detector Algorithm Multi-Timeframe and Multi-Currency Trend Low
Timeframes Trend Scanner   is a trend analyzer or trend screener indicator that helps you know the trend in   all timeframes of selected symbol you are watching . This indicator provides clear & detailed analysis results on a beautiful dashboard, let you able to use this result right away without need to do any additional analysis. How it works Step 1: Calculate values of 23 selected & trusted technical indicators (Oscillator & Moving Average indicators) Step 2: Analyze all indicators using bes
Visual Heatmap Book Analyzer
Alexandre Moraes De Souza Lima
Visual Heatmap Book Analyser This indicator monitors the market liquidity and generates colors based on order patterns, quantities, and renewal activities in the book. This allows you to visualize the order flow and identify areas of high and low liquidity and activity. The indicator uses machine learning techniques to analyze the order behavior in the book, enabling it to detect patterns and trends in orders, allowing you to make informed decisions about your trading operations. The color pale
KT Candlestick Patterns MT5
KEENBASE SOFTWARE SOLUTIONS
KT Candlestick Patterns identifie et marque en temps réel les 24 figures de chandeliers japonais les plus fiables. Depuis le 18e siècle, les traders japonais utilisent ces figures pour prévoir la direction des prix. Il est vrai que tous les modèles ne se valent pas, mais lorsqu’ils sont combinés à des méthodes comme les supports et résistances, ils offrent une lecture plus précise du marché. Cet indicateur inclut de nombreux motifs étudiés en détail dans le livre de Steve Nison : "Japanese Can
Top indicator for MT5   providing accurate signals to enter a trade without repainting! It can be applied to any financial assets:   forex, cryptocurrencies, metals, stocks, indices .  Watch  the video  (6:22) with an example of processing only one signal that paid off the indicator! MT4 version is here It will provide pretty accurate trading signals and tell you when it's best to open a trade and close it. Most traders improve their trading results during the first trading week with the help of
[ MT4 Version ] Are you tired of spending months on demo or live accounts to test your trading strategies? The Backtesting Simulator is the ultimate tool designed to elevate your backtesting experience to new heights. Utilizing Metatrader historical symbol information, it offers an unparalleled simulation of real market conditions. Take control of your testing speed, test ideas quickly or at a slower pace, and witness remarkable improvements in your testing performance. Forget about wasting tim
Pro Thunder V10 : L’indicateur ultime pour le trading d’options binaires ! Élevez votre trading à un niveau supérieur avec Pro Thunder V10 , l'apogée du trading d'options binaires ! Propulsé par la technologie avancée de réseaux neuronaux IA , cet indicateur révolutionnaire est conçu pour offrir une précision et une fiabilité inégalées. Des signaux en temps réel qui ne se repeignent pas jusqu’à des performances impeccables, même sur des marchés volatils, Pro Thunder V10 est votre allié
MetaForecast M5
Vahidreza Heidar Gholami
5 (3)
MetaForecast prédit et visualise l'avenir de n'importe quel marché en se basant sur les harmoniques des données de prix. Bien que le marché ne soit pas toujours prévisible, s'il y a un motif dans les prix, MetaForecast peut prédire l'avenir aussi précisément que possible. Comparé à d'autres produits similaires, MetaForecast peut générer des résultats plus précis en analysant les tendances du marché. Paramètres d'entrée Past size (Taille passée) Spécifie le nombre de barres que MetaForecast util
KT Trend Trading Suite MT5
KEENBASE SOFTWARE SOLUTIONS
KT Trend Trading Suite is a multi-featured indicator that incorporates a trend following strategy combined with multiple breakout points as the entry signals. Once a new trend is established, it provides several entry opportunities to ride the established trend successfully. A pullback threshold is used to avoid the less significant entry points. MT4 Version is available here  https://www.mql5.com/en/market/product/46268 Features It combines several market dynamics into a single equation to
PZ Trend Trading MT5
PZ TRADING SLU
3.8 (5)
Capture every opportunity: your go-to indicator for profitable trend trading Trend Trading is an indicator designed to profit as much as possible from trends taking place in the market, by timing pullbacks and breakouts. It finds trading opportunities by analyzing what the price is doing during established trends. [ Installation Guide | Update Guide | Troubleshooting | FAQ | All Products ] Trade financial markets with confidence and efficiency Profit from established trends without getting whip
RelicusRoad Pro MT5
Relicus LLC
4.78 (18)
Maintenant 147 $ (augmentant à 499 $ après quelques mises à jour) - Comptes illimités (PCS ou Mac) Manuel d'utilisation RelicusRoad + Vidéos de formation + Accès au groupe Discord privé + Statut VIP UNE NOUVELLE FAÇON DE REGARDER LE MARCHÉ RelicusRoad est l'indicateur de trading le plus puissant au monde pour le forex, les contrats à terme, les crypto-monnaies, les actions et les indices, offrant aux traders toutes les informations et tous les outils dont ils ont besoin pour rester rentables
This indicator is based on the mathematics of the great trader W.D. Ganna. With its help, you can easily find strong levels by analyzing swings to find the optimal entry point. The indicator works on all instruments and all timeframes. The indicator is fully manual and has control buttons. All you need to do is press the NEW button, a segment will appear, which you can place on any movement, swing or even 1 candle that you want to analyze. By placing the segment, press the OK button. A grid (th
CONTACT US  after purchase to get the Indicator Manual. Try Now—Limited Discount for the next 10 Buyers! Download the  Metatrader 4 Version Read the product description carefully before purchasing the product.  Due to regulatory restrictions, our service is unavailable in certain countries such as India, Pakistan, and Bangladesh. Disclaimer: • Our products are available only on mql5.com. • We never contact anyone or sell our products privately. • We do not provide any personal trading advice.
This indicator identifies and displays zones, as it were areas of strength, where the price will unfold. The indicator can work on any chart, any instrument, at any timeframe. The indicator has two modes. The indicator is equipped with a control panel with buttons for convenience and split into two modes. Manual mode: To work with manual mode, you need to press the NEW button, a segment will appear. This segment is stretched over the movement and the LVL button is pressed. The level is displayed
PZ Swing Trading MT5
PZ TRADING SLU
5 (5)
Protect against whipsaws: revolutionize your swing trading approach Swing Trading is the first indicator designed to detect swings in the direction of the trend and possible reversal swings. It uses the baseline swing trading approach, widely described in trading literature. The indicator studies several price and time vectors to track the aggregate trend direction and detects situations in which the market is oversold or overbought and ready to correct. [ Installation Guide | Update Guide | Tro
Advanced Supply Demand MT5
Bernhard Schweigert
4.5 (14)
La meilleure solution pour tout commerçant débutant ou expert ! Cet indicateur est un outil de trading unique, de haute qualité et abordable car nous avons intégré un certain nombre de fonctionnalités propriétaires et une nouvelle formule. Avec cette mise à jour, vous pourrez afficher des zones à double horaire. Vous pourrez non seulement afficher un TF plus élevé, mais afficher les deux, le graphique TF, PLUS le TF supérieur : AFFICHAGE DES ZONES NICHÉES. Tous les traders Supply Demand vont ado
LIMITED! JUST 10 COPIES AVAILABLE!  BONUS AUX VIP Club 2024 : Include EA CAP, CEP, LDH, PSC307 & AO4C to enhance the performance of this tool to its maximum potential  Click Here to Download Files   ( for users only ) FREE Trading Education Available Daily via Zoom --- For More Info or Instant Message Click link ---  https://t.me/abcdwave Transform your trading with the "Five Magic Bullets" Indicator, tailored for traders who embrace the power of Elliott Wave Chaos Theory. Spec
Blahtech Supply Demand MT5
Blahtech Limited
4.54 (13)
Was: $299  Now: $149  Supply Demand uses previous price action to identify potential imbalances between buyers and sellers. The key is to identify the better odds zones, not just the untouched ones. Blahtech Supply Demand indicator delivers functionality previously unavailable on any trading platform. This 4-in-1 indicator not only highlights the higher probability zones using a multi-criteria strength engine, but also combines it with multi-timeframe trend analysis, previously confirmed swings
Trend Forecaster
Alexey Minkov
5 (6)
!SPECIAL SALE!  The Trend Forecaster indicator utilizes a unique proprietary algorithm to determine entry points for a breakout trading strategy. The indicator identifies price clusters, analyzes price movement near levels, and provides a signal when the price breaks through a level. The Trend Forecaster indicator is suitable for all financial assets, including currencies (Forex), metals, stocks, indices, and cryptocurrencies. You can also adjust the indicator to work on any time frames, althoug
Découvrez les véritables motifs cachés du marché avec le système de trading PREDATOR AURORA — le boss final des indicateurs de trading hybrides. Voyez ce que les autres ne voient pas ! Le système de trading PREDATOR AURORA est une puissance conçue pour ceux qui refusent de se cacher dans l'ombre de la médiocrité. Ce n'est pas juste un autre indicateur ; c'est le code de triche ; c'est votre avantage déloyal, un système de chasse hybride sophistiqué qui suit les mouvements du marché avec une
TPA True Price Action indicator reveals the true price action of the market makers through 100% non-repainting signals strictly at the close of a candle! TPA shows entries and re-entries, every time the bulls are definitely stronger than the bears and vice versa. Not to confuse with red/green candles. The shift of power gets confirmed at the earliest stage and is ONE exit strategy of several. There are available now two free parts of the TPA User Guide for our customers. The first "The Basics"
Elliott Wave Trend was designed for the scientific wave counting. This tool focuses to get rid of the vagueness of the classic Elliott Wave Counting using the guideline from the template and pattern approach. In doing so, firstly Elliott Wave Trend offers the template for your wave counting. Secondly, it offers Wave Structural Score to assist to identify accurate wave formation. It offers both impulse wave Structural Score and corrective wave Structure Score. Structural Score is the rating to sh
Royal Wave Pro M5
Vahidreza Heidar Gholami
3.5 (4)
Royal Wave is a Trend-Power oscillator which has been programmed to locate and signal low-risk entry and exit zones. Its core algorithm statistically analyzes the market and generates trading signals for overbought, oversold and low volatile areas. By using a well-designed alerting system, this indicator makes it easier to make proper decisions regarding where to enter and where to exit trades. Features Trend-Power Algorithm Low risk Entry Zones and Exit Zones Predictions for Overbought and Over
Introduction to Fractal Pattern Scanner Fractal Indicator refers to the technical indicator that makes use of the fractal geometry found in the financial market. Fractal Pattern Scanner is the advanced Fractal Indicator that brings the latest trading technology after the extensive research and development work in the fractal geometry in the financial market. The most important feature in Fractal Pattern Scanner is the ability to measure the turning point probability as well as the trend probabil
Hello I Want to introduce The Forex Buy Sell Arrow Premium MT5 i recently release this premium indicator! its 1000% Non Repaint Indicator, It Work Perfectly Well,, i tested it day by day, Just mind blowing Result,  Including Powerful trend Algorithm! How It Work? well, it work market trend formula, when trend Bullish Or when trend Bearish,  Recommend Timeframe M30, H1 it work all timeframe, and all currency pair, 100% non repaint, How to take signal From Forex Buy Sell Arrow Premium Ind
Filtrer:
Aucun avis
Répondre à l'avis