The First Red MT4
- Indicateurs
- Krzysztof Janusz Stankiewic
- Version: 1.0
- Activations: 5
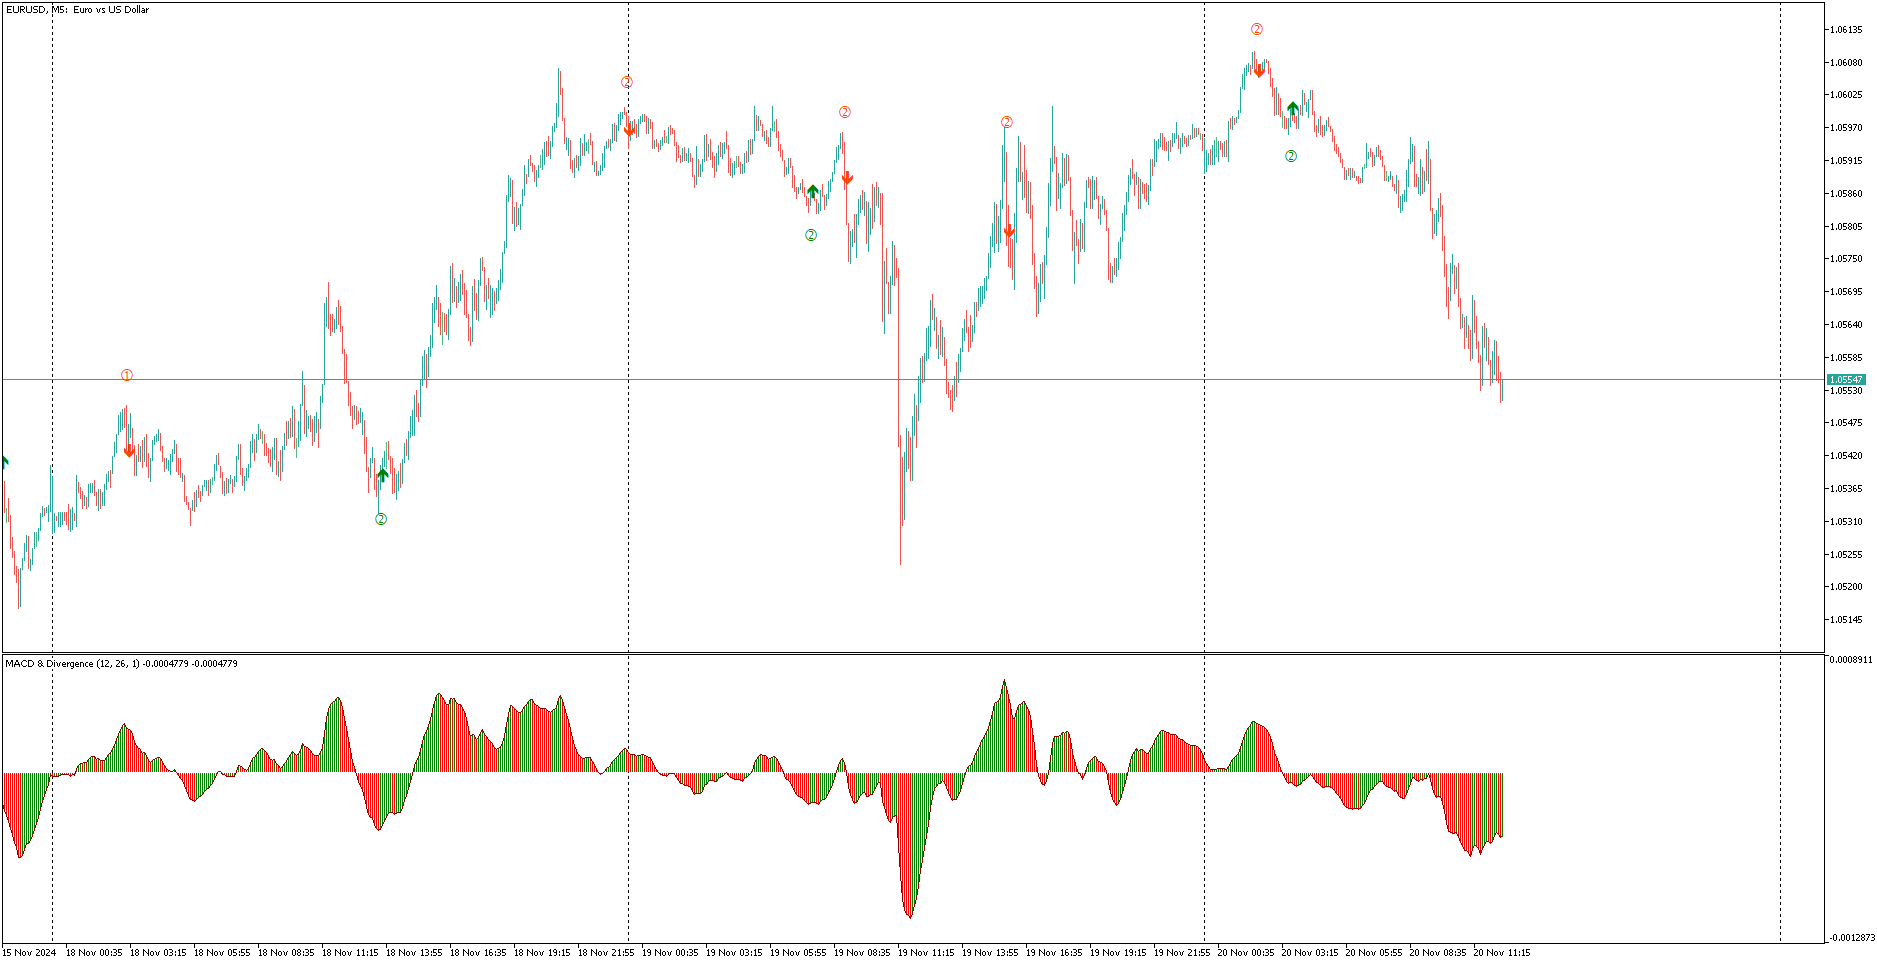
L'indicateur "The First Red", basé sur la stratégie créée par Dariusz Dargo, est conçu pour identifier et marquer les chandeliers sur le graphique qui répondent aux conditions de la stratégie "The First Red" et de ses extensions, telles que "Second Red", "First Green" et "Second Green". La stratégie se concentre sur l'analyse des extrêmes locaux et les signaux de l'oscillateur MACD.
-
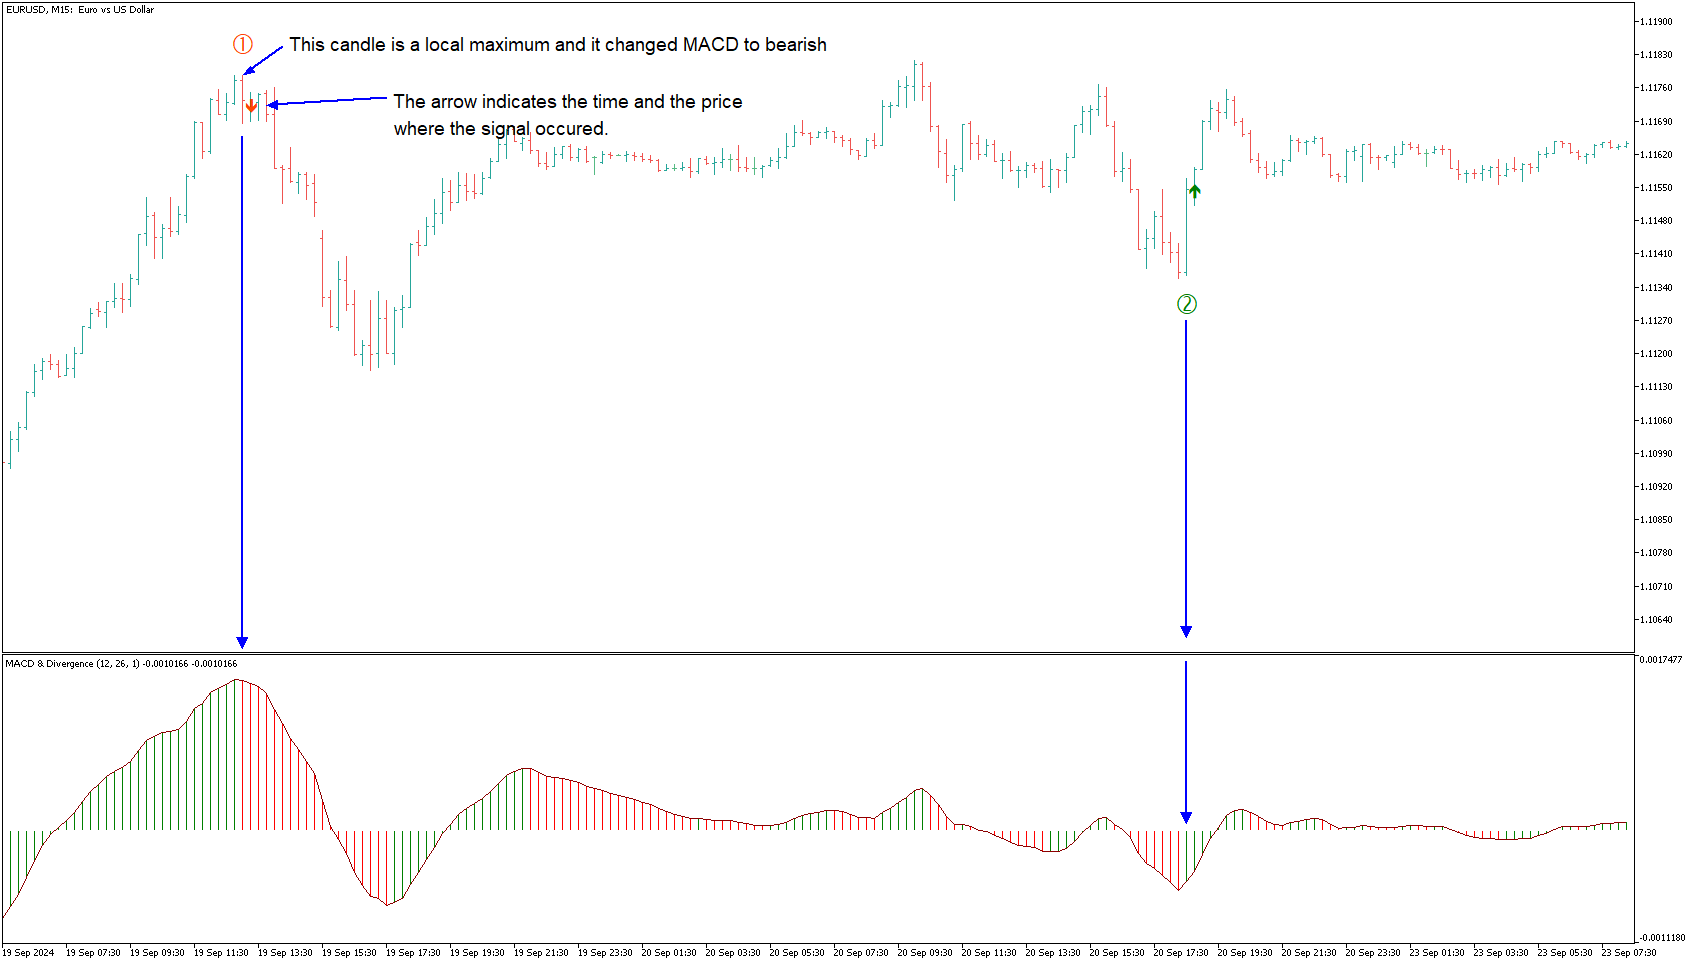
Premier chandelier rouge (First Red Candle): Un chandelier est marqué comme "First Red" lorsqu'il établit un maximum local et que l'histogramme du MACD passe en direction baissière. Symbole sur le graphique : une flèche rouge pointant vers le bas au-dessus du chandelier.
-
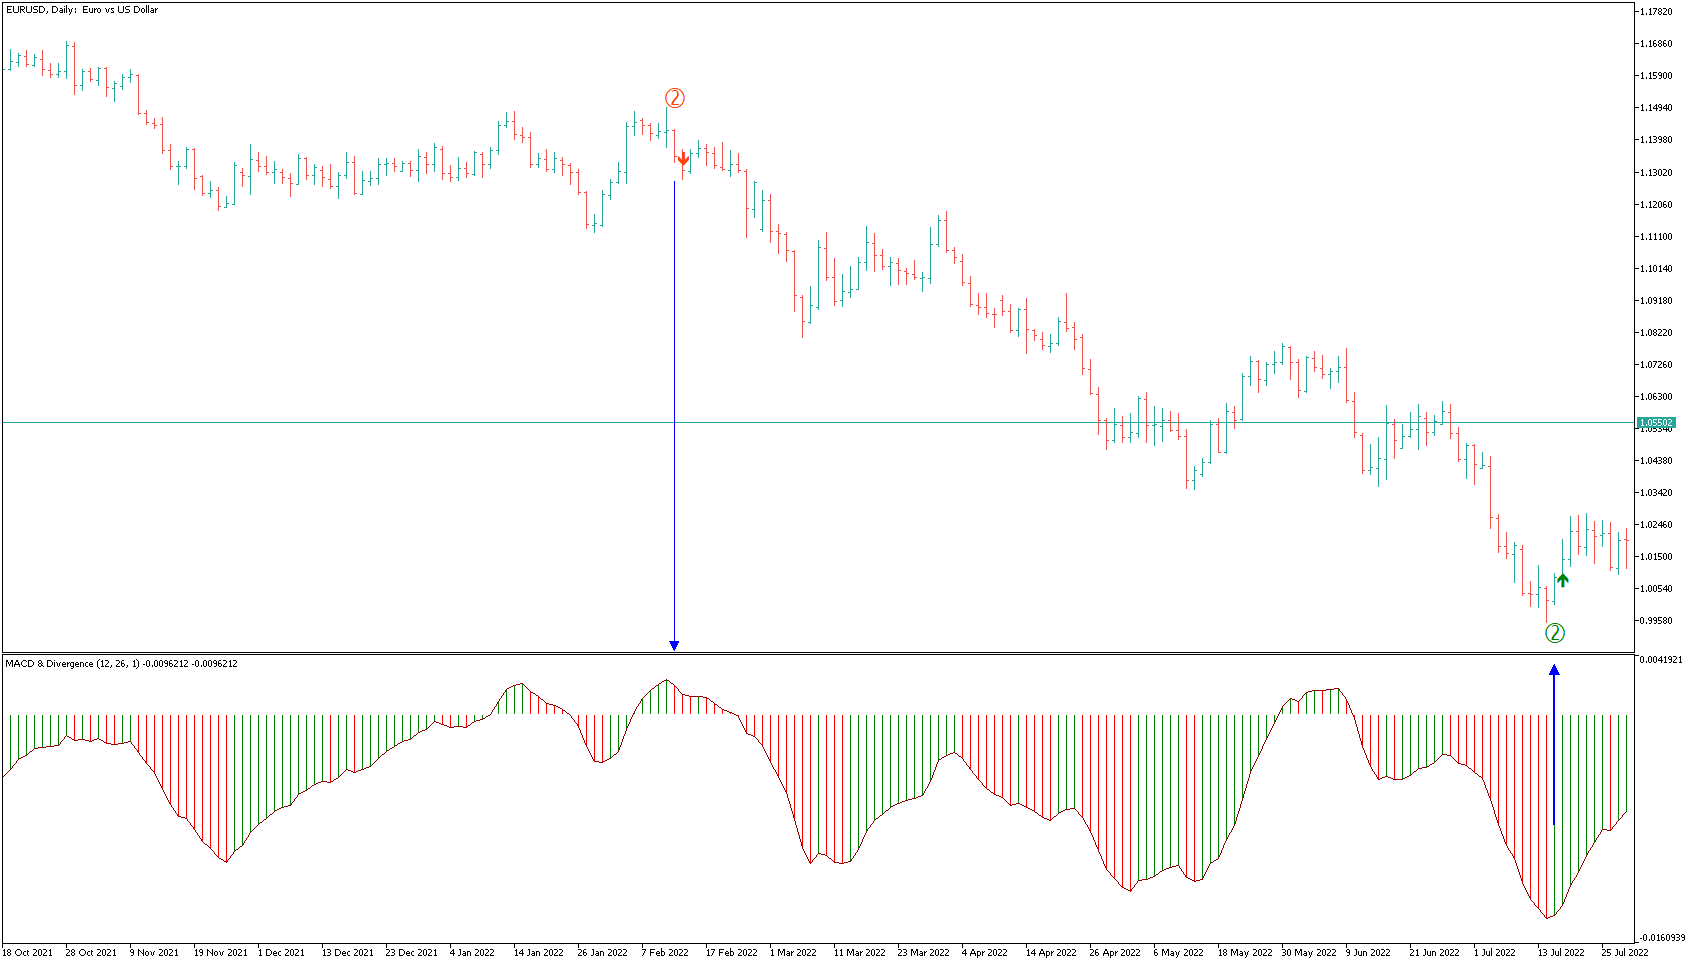
Deuxième chandelier rouge (Second Red Candle): Le deuxième chandelier baissier suivant le "First Red", confirmant le changement de direction. Symbole sur le graphique : un numéro rouge "2" au-dessus du chandelier.
-
Premier chandelier vert (First Green Candle): Un chandelier est marqué comme "First Green" lorsqu'il établit un minimum local et que l'histogramme du MACD passe en direction haussière. Symbole sur le graphique : une flèche verte pointant vers le haut en dessous du chandelier.
-
Deuxième chandelier vert (Second Green Candle): Le deuxième chandelier haussier suivant le "First Green", confirmant le changement de direction. Symbole sur le graphique : un numéro vert "2" en dessous du chandelier.
Caractéristiques de l'indicateur :
- Marquage visuel des chandeliers directement sur le graphique.
- Intégration avec l'oscillateur MACD pour une identification précise des changements de momentum.
- Couleurs et symboles personnalisables pour une interprétation facile.
Objectif : L'indicateur est destiné aux traders cherchant des points de retournement dynamiques et des signaux d'entrée précis, et il peut être utilisé efficacement sur les graphiques chandeliers standard et les graphiques Range Bar.