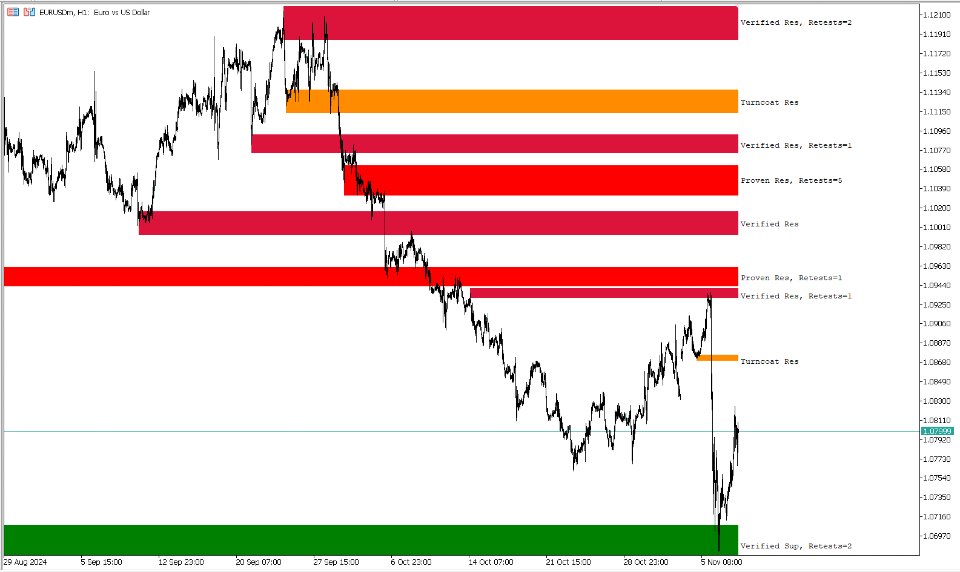
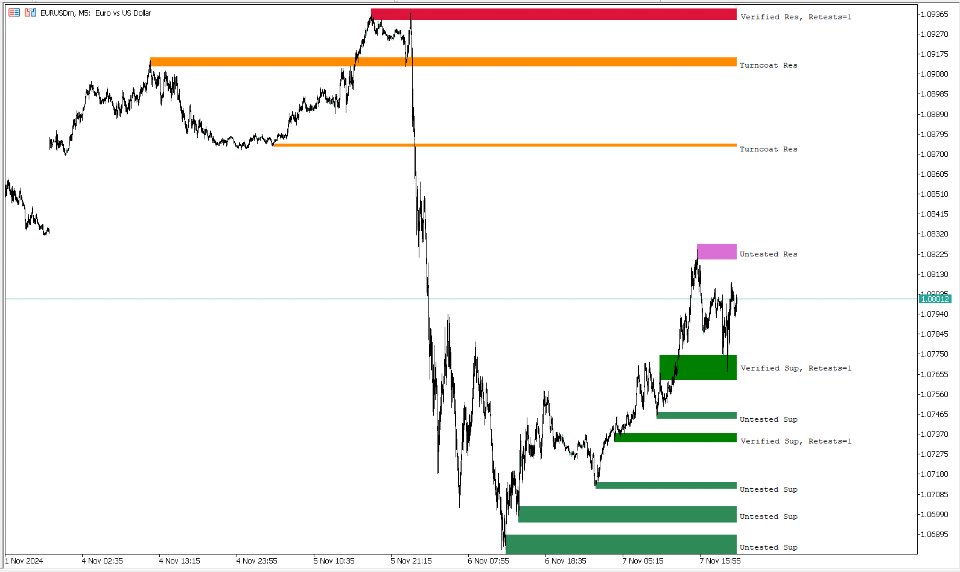
Accurate Support and Resistant Zones
- Indicateurs
- Ibrahim Fathallah Abdel Halim Abdel Khaleq
- Version: 3.5
- Activations: 5
This indicator identifies and visually displays Support and Resistance zones on a financial chart, providing traders with critical insights into market structure and potential price action areas. Here's how it operates:
Key Features:
-
Zone Identification:
- Detects Support Zones (price levels where buying pressure is historically strong).
- Detects Resistance Zones (price levels where selling pressure is historically strong).
- Categorizes zones into:
- Weak Zones
- Untested Zones
- Turncoat Zones (previously broken levels acting as their opposite)
- Verified Zones
- Proven Zones
-
Customization Options:
- BackLimit: Controls the number of historical candles analyzed for zone detection.
- Zone Visibility: Toggle display of weak, untested, and broken zones.
- Zone Aesthetics: Customize zone colors, line styles, widths, and label formats.
- Merge & Extend Zones: Automatically merge overlapping zones and extend zone boundaries for better visibility.
-
Fractal-Based Zone Detection:
- Uses Fast and Slow Fractals to identify key price points for zone creation.
- ATR (Average True Range) is incorporated to refine the zone boundaries dynamically.
-
Alerts:
- Alerts when the price enters a zone, with options for popup notifications and sound alerts.
- Customizable alert delay to avoid repeated notifications.
-
Dynamic Labels:
- Displays zone strength and type as labels, such as "Verified Support" or "Proven Resistance."
- Labels include test counts for verified/proven zones.
Core Functionalities:
-
Zone Drawing:
- Automatically draws rectangles on the chart to represent support and resistance zones.
- Zones are color-coded based on their strength and type.
-
Nearest Zones:
- Identifies and highlights the nearest support and resistance zones to the current price.
-
History Mode:
- Allows users to backtrack in time and visualize historical zones by clicking on the chart.
-
Alert System:
- Alerts traders when the price enters predefined support or resistance zones.
- Configurable delay between alerts.
-
Fractal-Based Logic:
- Combines fast and slow fractals to detect price reversal points.
- Refines these points into zones using ATR to account for price volatility.
Inputs:
- Zone Customization:
- Control visibility, colors, styles, and extension of zones.
- Alert Options:
- Enable/disable sound or popup alerts.
- Fractal Settings:
- Adjust fractal sensitivity for fine-tuned zone detection.
- Global Variables:
- Optionally store zone data as global variables for cross-script access.
Use Case:
- Trend Reversals:
- Identify areas where the price is likely to reverse due to historical buying or selling pressure.
- Breakout Trading:
- Spot zones where breakouts are likely to occur.
- Zone Testing:
- Monitor test counts to assess the strength of support or resistance.
- Dynamic Adjustments:
- Automatically adapts to market volatility with ATR-based adjustments.
This indicator is designed for traders who want a detailed yet customizable visualization of support and resistance zones. It integrates seamlessly into any trading strategy, providing actionable insights for both intraday and swing trading styles.


