SMA Grid Visual Indicator MT4
- Indicateurs
- AL MOOSAWI ABDULLAH JAFFER BAQER
- Version: 1.2
- Activations: 5
SMA Grid Visual Indicator
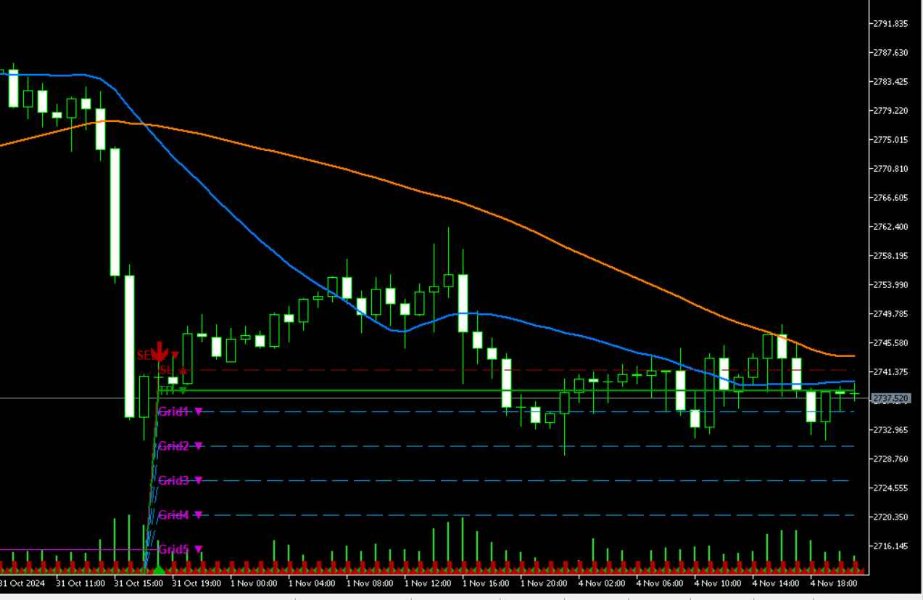
The SMA Grid Visual Indicator is a sophisticated, customizable tool designed for traders who want precise and actionable insights directly on their charts. This indicator uses two moving averages, a fast and a slow SMA, to identify trend directions and potential buy/sell signals, enhancing trading decisions with a visually intuitive setup.
Key Features:
-
Dynamic SMA Crossovers:
- The indicator utilizes Fast and Slow Simple Moving Averages (SMAs) to detect trend direction. Buy and sell signals are triggered at crossover points, clearly marked on the chart to highlight potential entry points.
-
Adaptive Grid Levels:
- Automatically generates grid levels above or below each entry signal, which can be based on either a manual point value or the Average True Range (ATR). This adaptive grid spacing helps in setting precise profit targets or multiple trade entries in line with market volatility.
-
Customizable Stop Loss (SL) and Take Profit (TP) Lines:
- Automatically plots SL and TP levels relative to each buy or sell signal, giving traders predefined exit points and protecting against adverse market moves. Line colors, styles, and thicknesses are fully customizable.
-
Enhanced Visuals and Alerts:
- The indicator’s buy and sell signals, grid lines, and SL/TP levels are color-coded and easy to interpret. Visual labels are included to clearly mark each signal and grid level. Alerts can be sent via push notifications, email, sound, or on-screen popups, allowing traders to stay informed even when away from the platform.
-
Highly Configurable Settings:
- Set the desired number of bars to analyze, custom text sizes for signal labels, adjustable grid sizes, SMA periods, and even SL/TP points. This flexibility caters to both short-term and long-term trading strategies.
-
Optimized Performance:
- Built for MetaTrader 5 (MT5), the SMA Grid Visual Indicator has been optimized for performance to ensure it runs smoothly on all timeframes without lag, even with a high number of bars or grid levels.
Use Cases:
- Scalping & Day Trading: Identifying quick entry and exit points with the SMA crossovers on lower timeframes.
- Swing Trading: Utilizing ATR-based grid spacing to follow trends and capture multi-level profits over a longer duration.
- Risk Management: Utilizing the customizable TP/SL levels for disciplined trade management, ensuring consistent adherence to risk parameters.
The SMA Grid Visual Indicator is a must-have for traders seeking a powerful, visually driven, and customizable tool to enhance trading decisions. Whether you’re a scalper or a long-term trader, this indicator provides clear insights and adaptable tools to help you capture the best opportunities in the market.
