Trend Fusion Xplorer MT5
- Indicateurs
- Ismail Babaoglu
- Version: 1.5
- Mise à jour: 13 novembre 2024
- Activations: 5
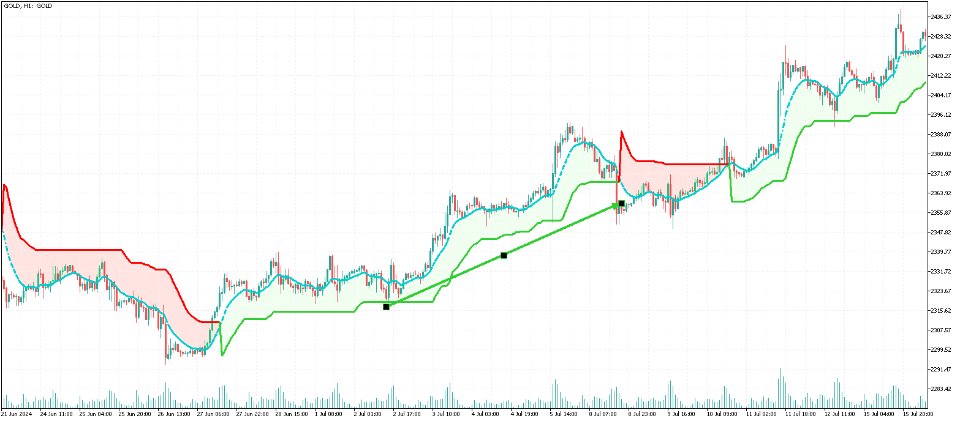
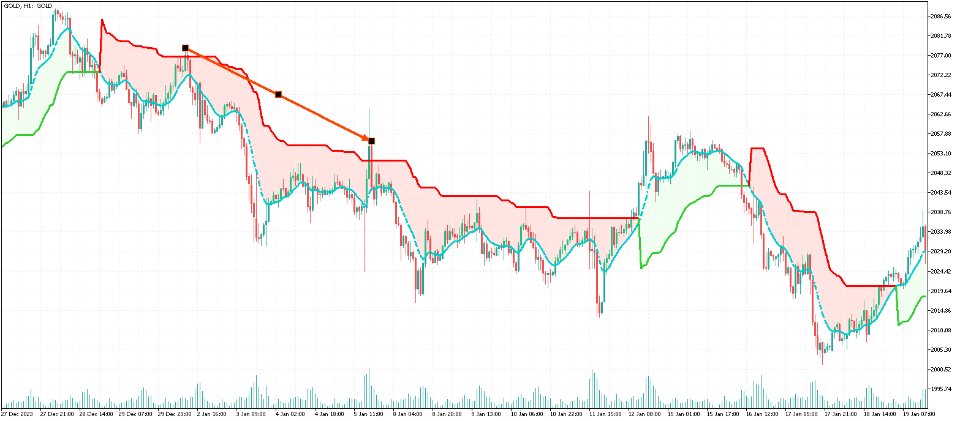
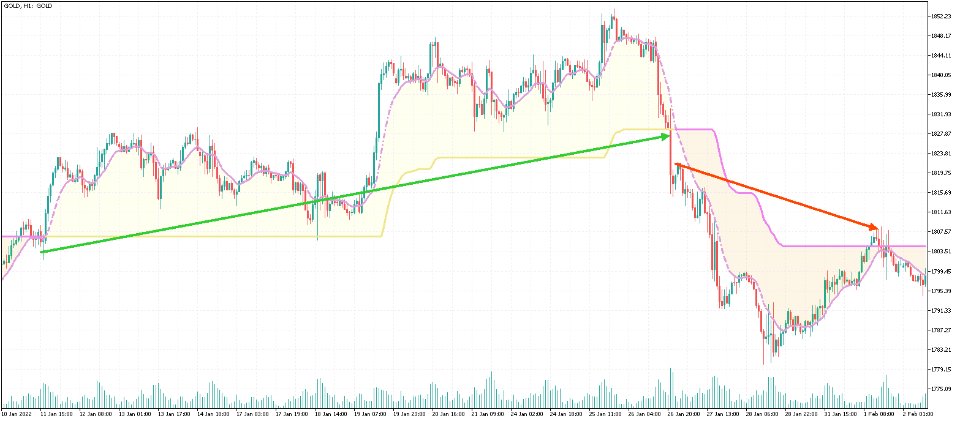
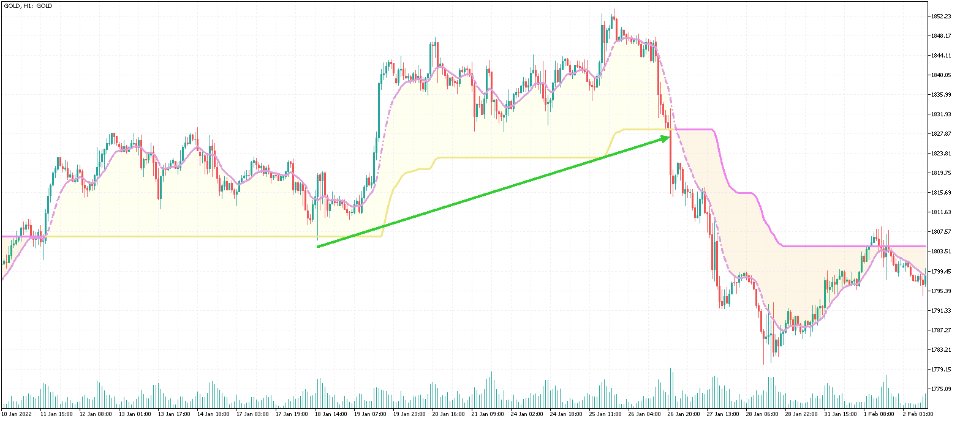
TrendFusionXplorer consists of three powerful trend-analyzing indicators —TRP, PMax and OTT— developed by Kivanc Ozbilgic. Each indicator displays the trend's support and resistance levels based on its unique properties and methodology. TrendFusionXplorer assists in determining entry and exit points for markets and can also be used for setting trailing stop-loss (SL) and take-profit (TP) levels on open positions.
Specifications
1. Trend Reversal Predictor (TRP):
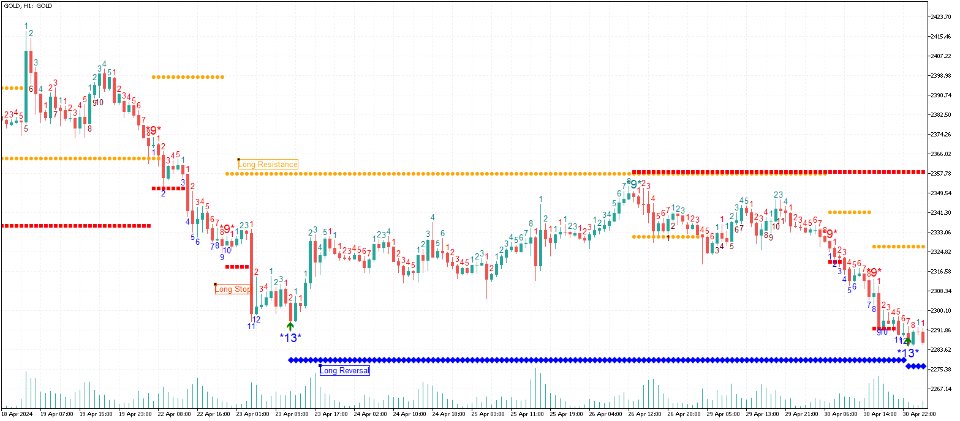
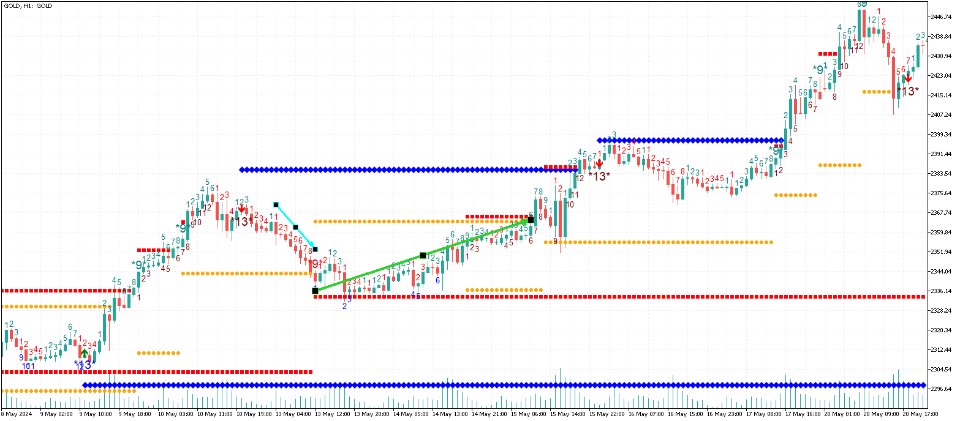
TRP follows Thomas R. DeMark's approach, where bars are counted based on specific rules to predict price reversal levels. Candles are sequentially counted from 1 to 9 in the same direction if they are higher than the candle four bars before, until a stop or reversal. A "9" signifies a potential reversal setup. A secondary count, from 1 to 13, occurs after this, and reaching 13 indicates a stronger reversal.
TRP has no adjustable parameters, and its support and resistance levels remain valid until broken.
Position Entry
- A potential buy position occurs when a "9" is above and near the stop level, with no candles below support.
- A potential sell position occurs when a "9" is below and near the stop level, with no candles above resistance.
- Follow resistance and stop rules closely.
2. Profit Maximizer (PMax):
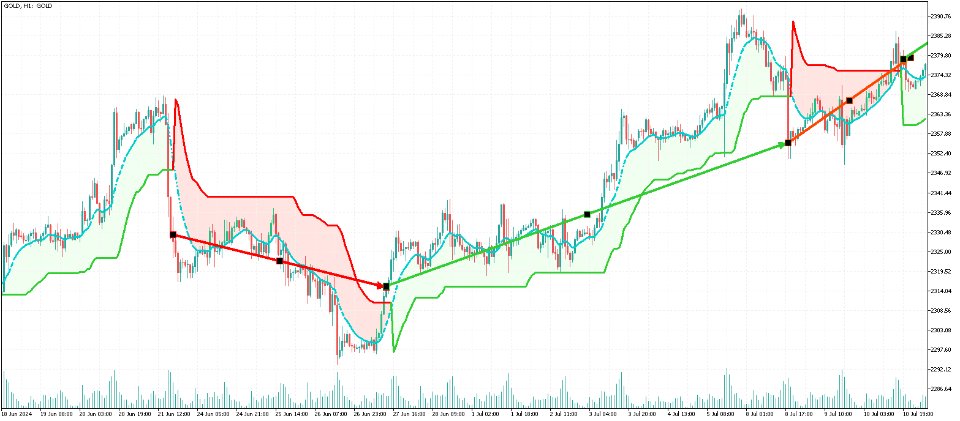
PMax has three parameters: the period and type of moving average (MA), the period of the average true rate (ATR), and the ATR multiplier, which calculates the distance to the MA.
PMax becomes more sensitive to trend movements with a smaller MA period and less sensitive with a larger MA period.
Similarly, a smaller ATR period increases sensitivity, while a larger ATR period reduces it.
Trend Identification
- The trend is upward when the MA is higher than the PMax.
- The trend is downward when the MA is lower than the PMax.
Position Entry
- A possible buy position arises when the MA crosses PMax upward.
- A possible sell position arises when the MA crosses PMax downward.
- A possible buy position arises when the price crosses above PMax.
- A possible sell position arises when the price crosses below PMax.
- *After approximately 10 candles following an MA-PMax cross, a possible touch to the PMax line may serve as a trend-aligned entry point (buy in an upward trend, sell in a downward trend).
3. Optimized Trend Tracker (OTT):
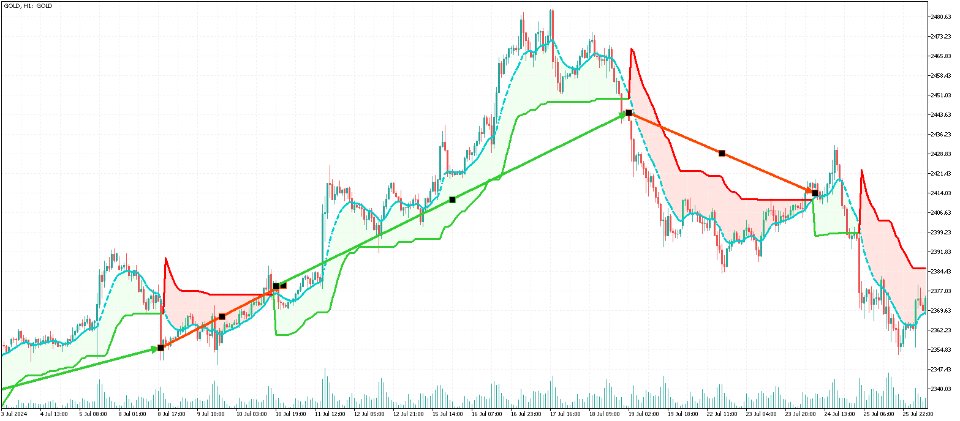
OTT has three parameters: the period and type of moving average (MA) and the percentage used to calculate the distance to the MA.
OTT becomes more sensitive to trend movements with a smaller MA period and less sensitive with a larger MA period.
Lower percentages increase sensitivity, while higher percentages decrease it.
Trend Identification
- The trend is upward when the MA is higher than the OTT.
- The trend is downward when the MA is lower than the OTT.
Position Entry
- A potential buy position occurs when the MA crosses OTT upward.
- A potential sell position occurs when the MA crosses OTT downward.
- A possible buy position arises when the price crosses above OTT.
- A possible sell position arises when the price crosses below OTT.
- *Similar to PMax, a touch to the OTT line after about 10 candles from an MA-OTT cross may serve as a trend-aligned entry point.

