• Aperçu
  • Avis (4)
  • Commentaires (3)
  • Nouveautés

RSI Kernel Optimized MT4 with Scanner

5
Special offer: ALL TOOLS, just $35 each!

New tools will be $30 for the first week or the first 3 purchases

Trading Tools Channel on MQL5: Join my MQL5 channel to update the latest news from me

Nous vous présentons le RSI Kernel Optimized with Scanner, un outil révolutionnaire qui redéfinit l'analyse RSI traditionnelle en intégrant l'algorithme puissant de l'estimation de densité par noyau (KDE). Cet indicateur avancé fournit non seulement des informations en temps réel sur les tendances du marché, mais il inclut également un tableau de bord pour scanner simultanément plusieurs paires de devises et unités de temps. Voyons pourquoi cet outil est un ajout essentiel à votre arsenal de trading.

See more MT5 version at: RSI Kernel Optimized with Scanner for MT5

See more products at: https://www.mql5.com/en/users/ndhsfy/seller

See more information about the indicator at: Enhancing RSI Analysis with Kernel Optimization

See instructions for using the indicator for EA (iCustom) here (with code available): Create EA with RSI Kernel Optimized indicator (iCustom)

Caractéristiques clés :

  • Détection innovante de pivots : Utilisant l'algorithme KDE, cet indicateur évalue la probabilité qu'une bougie forme un point pivot, offrant aux traders une perspective unique sur les renversements de tendance.
  • Pas de repainting : Les signaux fournis par cet indicateur sont confirmés une fois la bougie fermée. Cela signifie que le signal ne changera pas par la suite, vous permettant de commencer votre stratégie de trading avec confiance à l'ouverture de la prochaine bougie.
  • Algorithme KDE personnalisable : Les traders ont un contrôle total sur les paramètres KDE, y compris la largeur de bande et les fonctions de noyau, garantissant que l'indicateur s'adapte aux différentes conditions du marché.
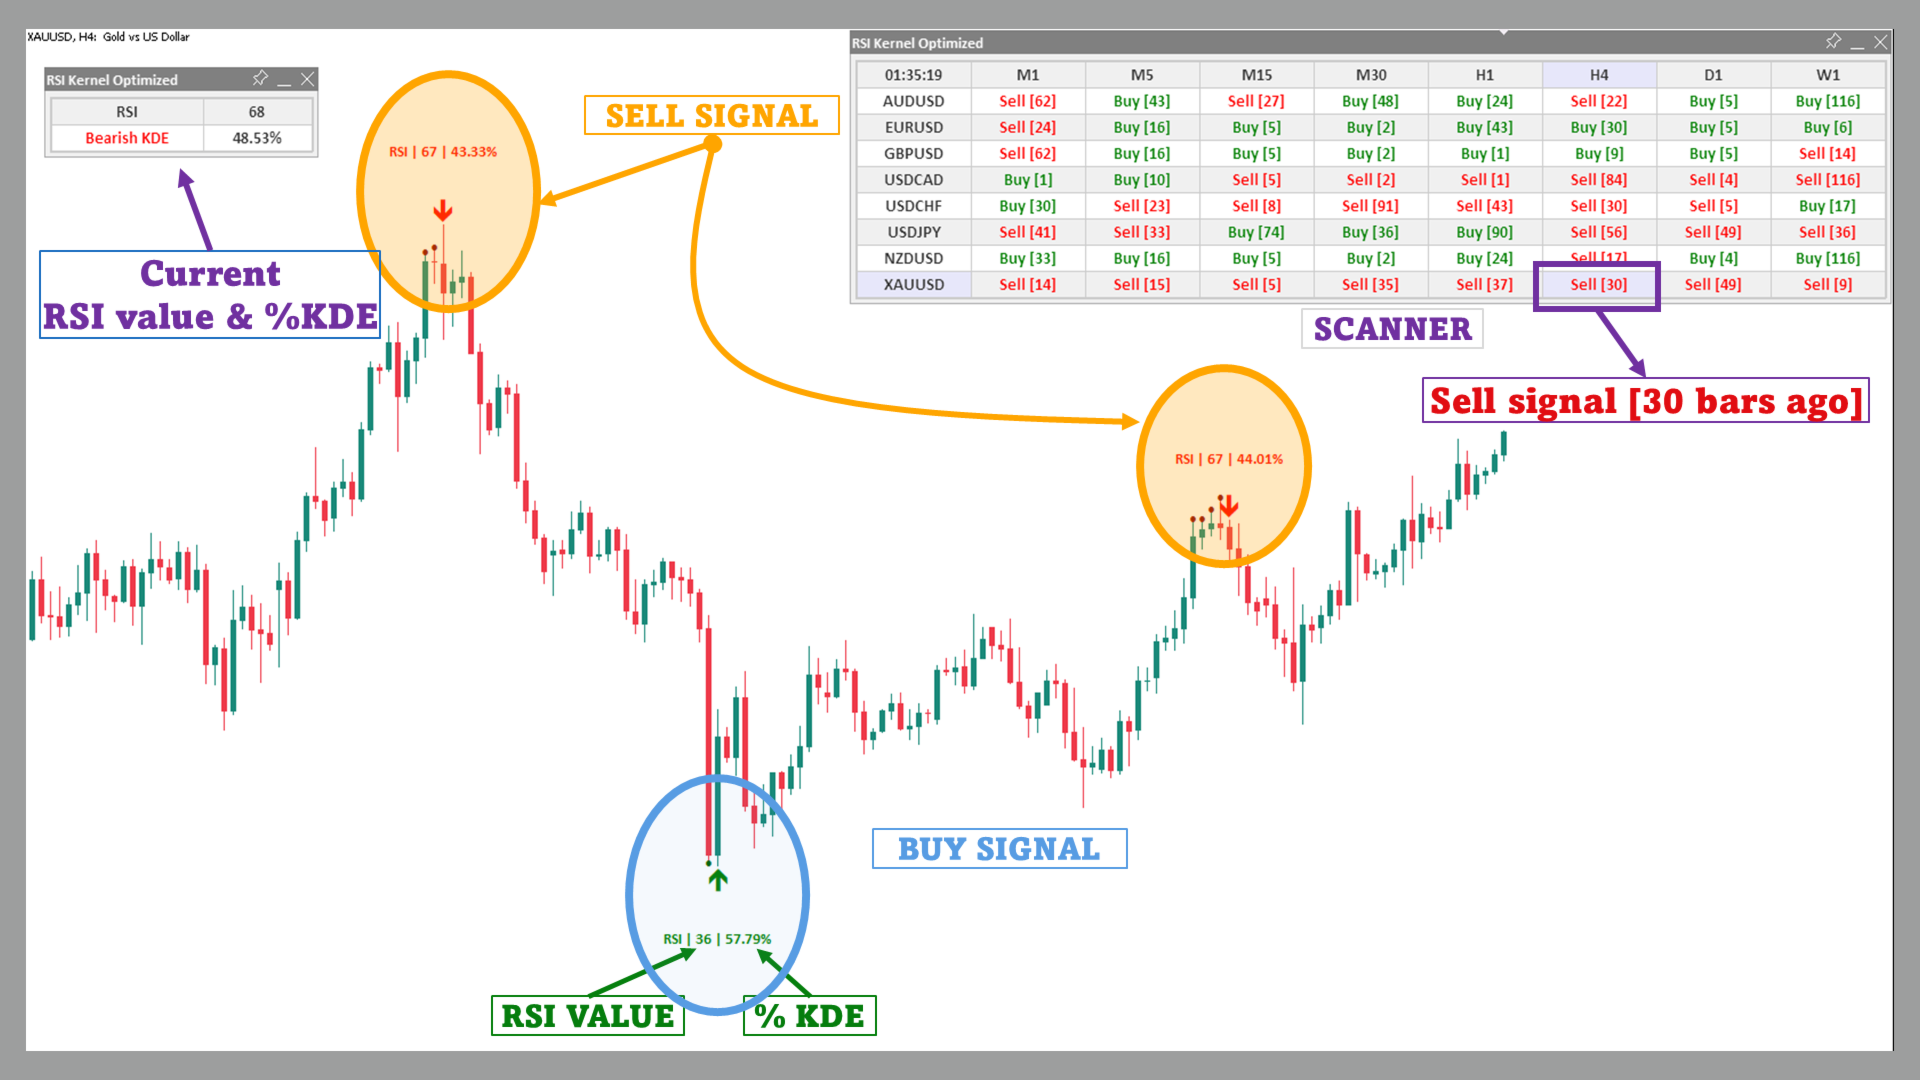
  • Tableau de bord en temps réel : Suivez les marchés grâce à un tableau de bord en temps réel qui affiche les valeurs RSI et KDE sur plusieurs paires de devises et unités de temps.
  • Alertes pour les pivots potentiels : Ne manquez jamais un moment clé sur le marché. L'indicateur vous alerte lorsque la probabilité d'un point pivot augmente, vous permettant d'agir rapidement.
  • Visualisation améliorée : L'indicateur offre des options visuelles personnalisables, garantissant que vos graphiques restent clairs et informatifs.

Comment interpréter le pourcentage de KDE :

Le pourcentage de KDE est une métrique cruciale qui mesure dans quelle mesure la valeur actuelle du RSI correspond à la distribution KDE. Ce pourcentage aide les traders à évaluer la probabilité qu'un point pivot se forme :

  • Faible pourcentage de KDE : Indique une faible probabilité de pivot, suggérant que la tendance actuelle pourrait se poursuivre.
  • Pourcentage modéré de KDE : Signale une probabilité accrue de pivot, incitant les traders à rechercher une confirmation supplémentaire.
  • Pourcentage élevé de KDE : Indique fortement qu'un pivot est imminent, correspondant aux conditions de surachat ou de survente dans l'analyse RSI traditionnelle. Ces moments sont souvent critiques pour entrer ou sortir d'un trade.

Comment ça fonctionne :

L'indicateur RSI Kernel Optimized calcule le RSI pour chaque bougie et identifie les points pivots potentiels. En utilisant l'algorithme KDE, il crée des distributions de probabilité pour les RSI de pivots élevés et bas, puis détermine la probabilité qu'une bougie forme un pivot. Ce processus innovant permet aux traders de recevoir des alertes opportunes pour les renversements ou les continuations de tendance, ce qui en fait un outil inestimable pour des décisions de trading précises.

  • Calcul du RSI : L'indicateur calcule le RSI pour chaque bougie et les stocke dans des tableaux pour les pivots hauts et bas.
  • Calcul du KDE : Il applique l'algorithme KDE aux deux tableaux de pivots en utilisant des fonctions de noyau personnalisables (Uniforme, Gaussien ou Sigmoïde) et des paramètres de largeur de bande.
  • Détection des pivots : Lorsque les valeurs de KDE dépassent le seuil fixé, l'indicateur affiche des flèches sur le graphique, indiquant des pivots potentiels haussiers ou baissiers.

Qu'est-ce qui le rend unique ?

Contrairement aux indicateurs RSI traditionnels, le RSI Kernel Optimized with Scanner utilise l'algorithme KDE pour prédire les points pivots en temps réel. Une fois que la bougie se ferme, le signal est confirmé et l'indicateur ne repaint pas, ce qui signifie que vous pouvez commencer votre stratégie de trading à l'ouverture de la prochaine bougie si un signal apparaît. Le tableau de bord intégré renforce cette fonctionnalité en fournissant une vue d'ensemble des valeurs RSI et KDE pour plusieurs paires de devises et unités de temps, permettant aux traders de surveiller efficacement le marché.
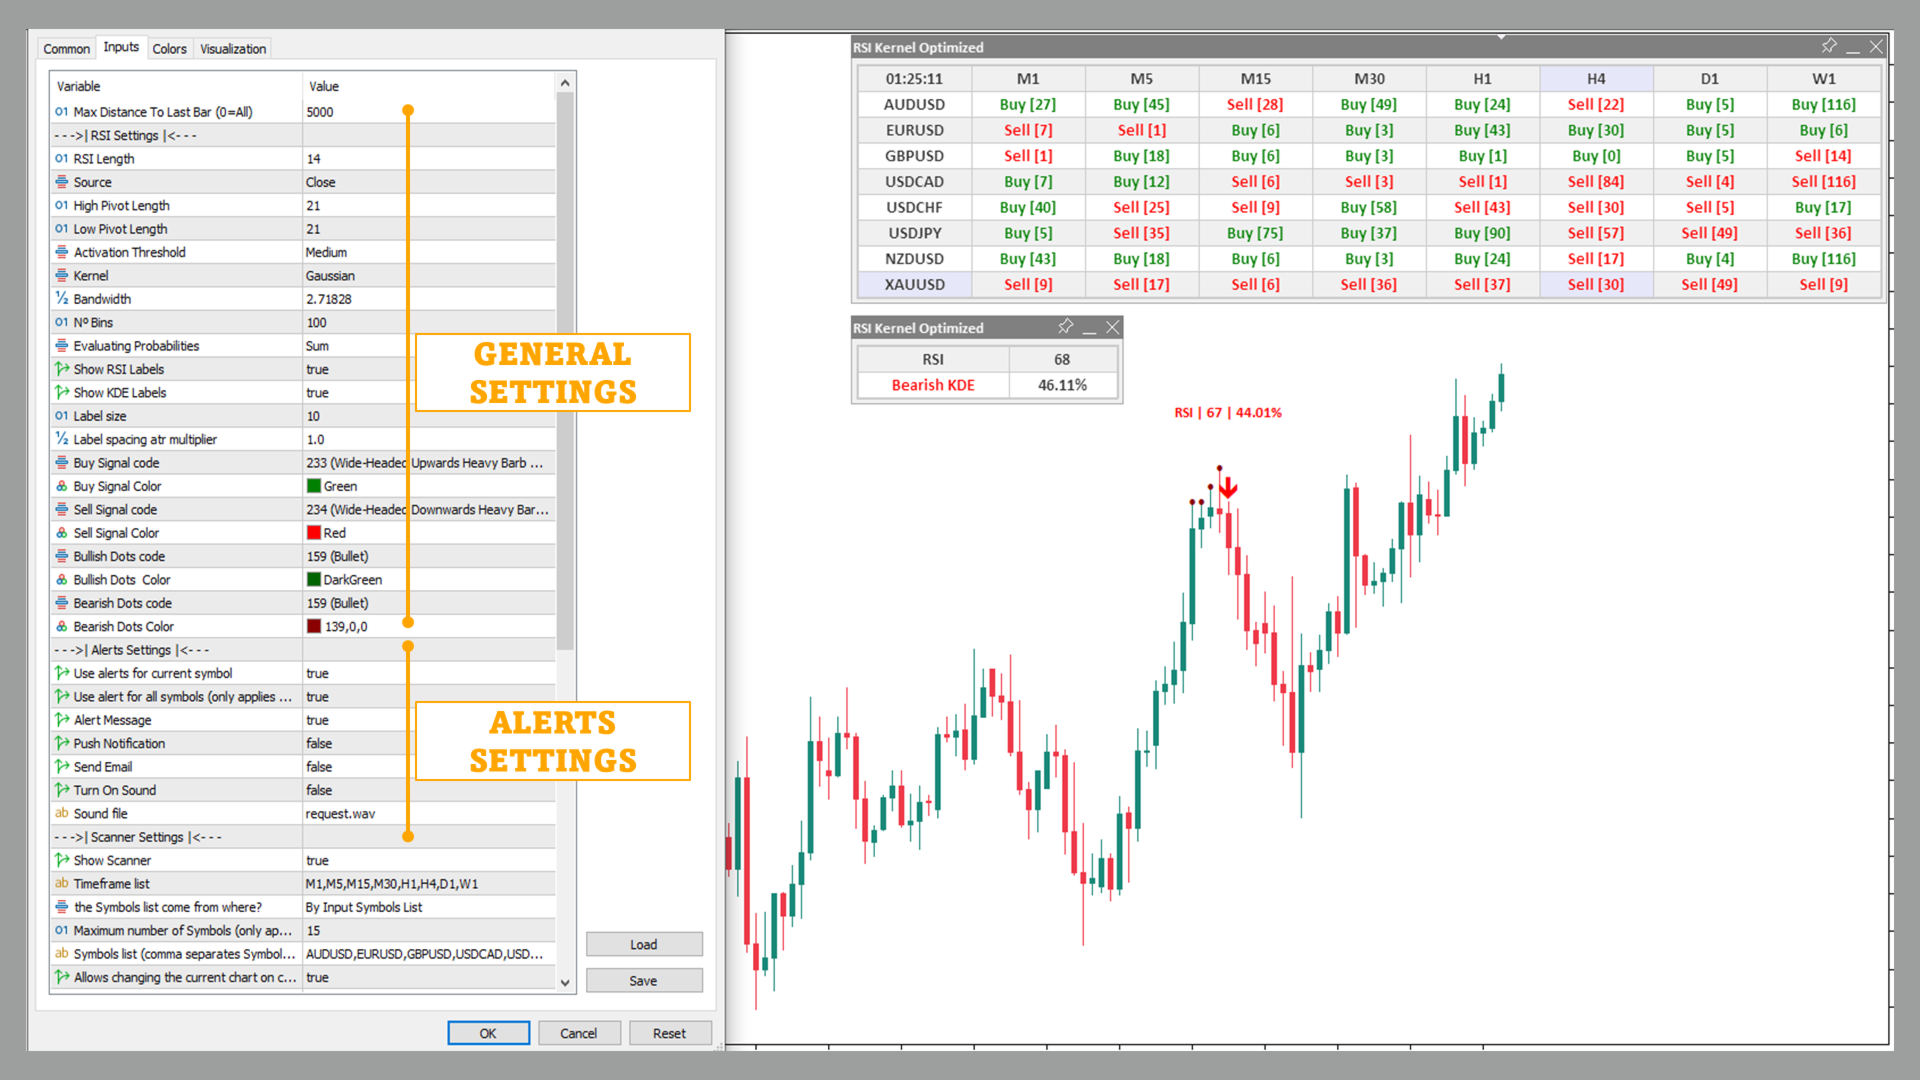
Paramètres :

  • Paramètres RSI : Ajustez la longueur et la source du RSI pour correspondre à votre stratégie de trading.
  • Longueurs de pivots : Personnalisez les longueurs de pivots pour détecter avec précision les pivots hauts et bas.
  • Paramètres KDE : Affinez l'algorithme KDE avec des options pour la largeur de bande, la fonction de noyau et le nombre de bacs pour une flexibilité maximale.
  • Seuil d'activation : Détermine le nombre de flèches affichées. Des valeurs plus élevées entraînent l'affichage de plus de flèches.
  • Fonction de noyau : La fonction de noyau utilisée pour le calcul du KDE. La fonction Gaussienne est couramment utilisée et est basée sur la distribution normale.
  • Largeur de bande : Ce paramètre définit la douceur de la sortie de la fonction KDE.
  • Nombre de bacs : Le nombre d'éléments que contiendra le tableau de probabilité KDE. Des valeurs plus élevées entraînent une précision accrue.

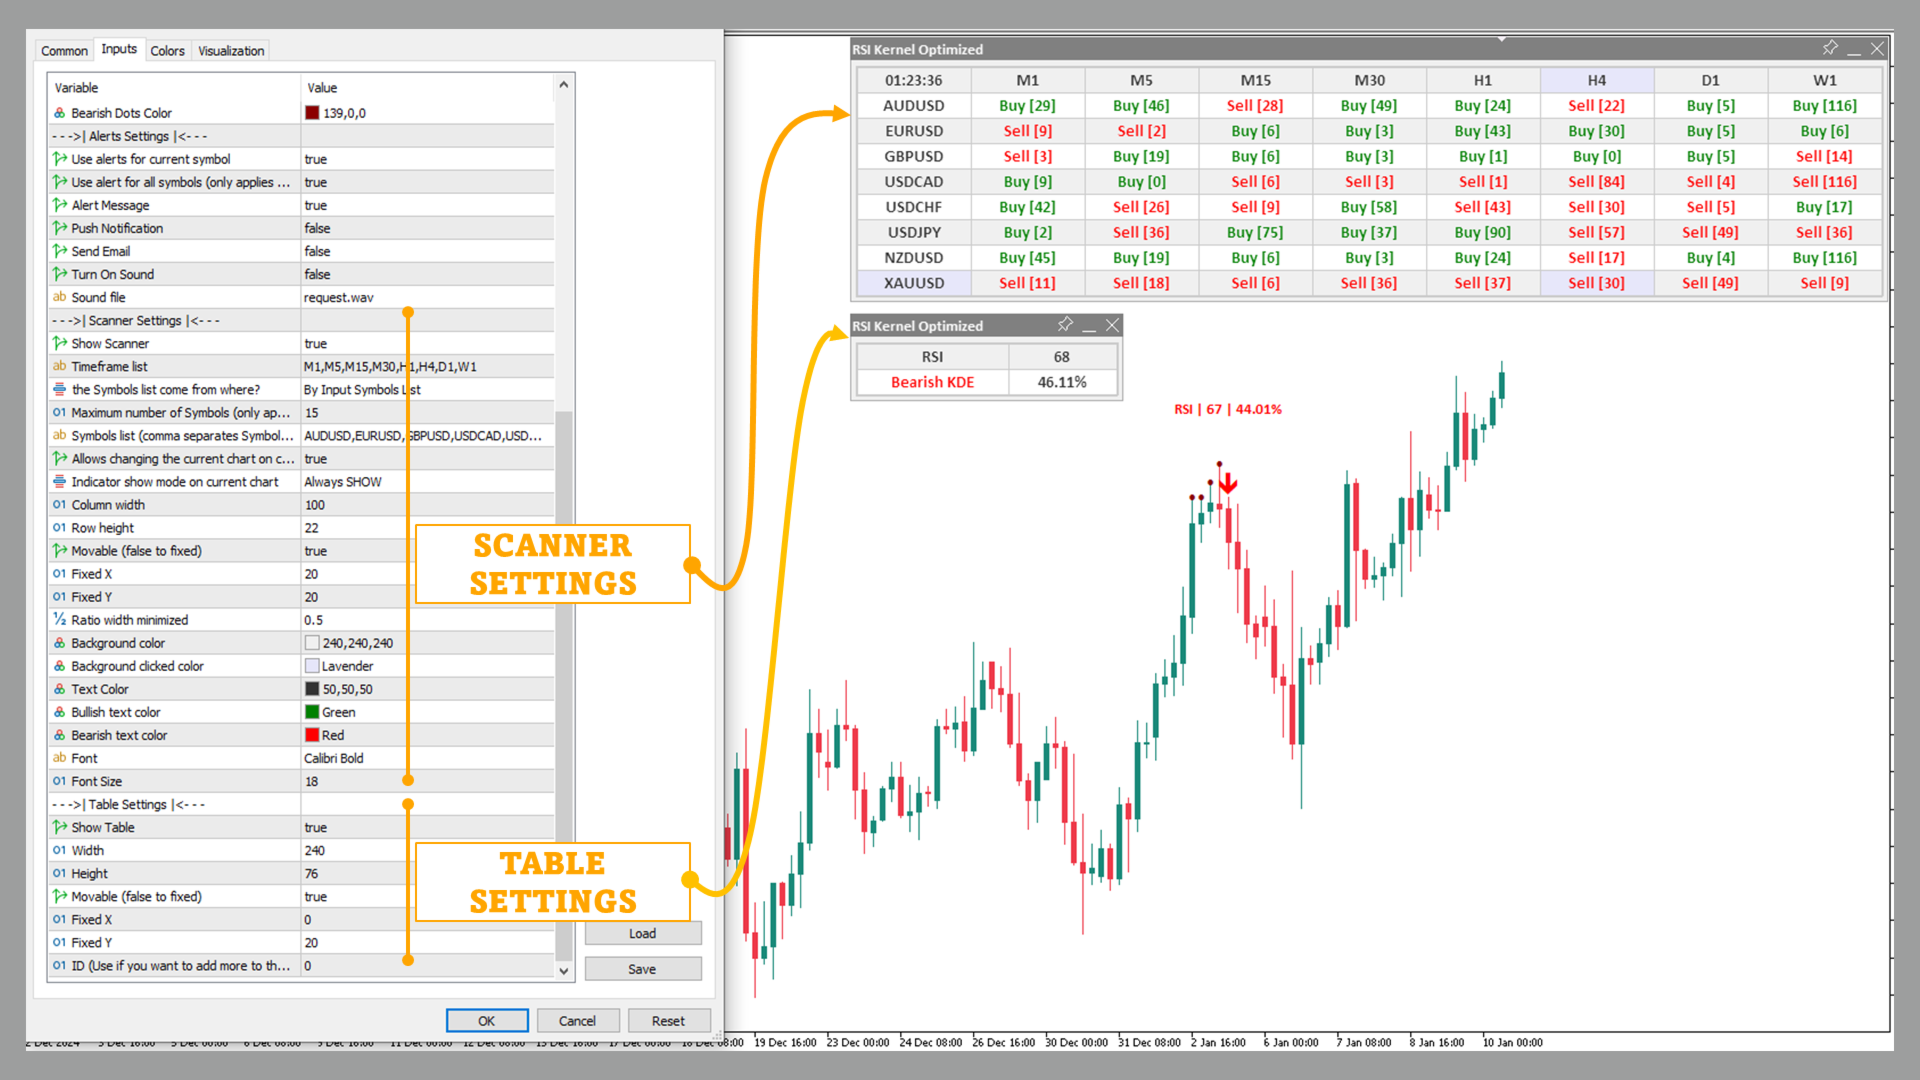
Tableau de bord Scanner RSI & KDE :

Le tableau de bord intégré permet aux traders de scanner plusieurs paires de devises et unités de temps, en fournissant en temps réel les valeurs RSI et KDE pour chacune d'elles. Cette fonctionnalité facilite la détection des opportunités potentielles sur différents marchés, le tout en un coup d'œil.

RSI Kernel Optimized with Scanner est plus qu'un simple indicateur RSI ; c'est un puissant outil de détection de pivots qui intègre des analyses statistiques avancées pour offrir une vision plus claire des mouvements du marché. Avec sa fonction sans repainting, vous pouvez être sûr qu'une fois qu'un signal est affiché, il ne changera pas, ce qui permet des entrées de trades en temps opportun et fiables. Que vous soyez un trader intraday ou un investisseur à long terme, cet indicateur vous fournit les informations nécessaires pour prendre des décisions de trading éclairées.


    Avis 4
    totee toto
    54
    totee toto 2025.02.17 12:07 
     

    Interest indicator. Help for my trading.Well done.

    Yusuf Hamzah
    721
    Yusuf Hamzah 2024.12.17 14:03 
     

    Unique. RSI + KDE. Scientifically sound. The concept provides a good unbiased additional confirmation of a possible reversal. Well done.

    danmar
    1774
    danmar 2024.12.04 06:11 
     

    i buy this one because i read the review of XANKEEZ on the other excellent product that i bought Volumetric Order Blocks MT4 Multi Timeframe and it is also a great one which works very well with volumetric : Well Done and today i upload the new version with new functionalities that i ask yesterday 3 december for future update! so quick and for me he makes my chart clearer and with less space taken for the MTF with use of Y negative to hide upper part of title Then THANK YOU A LOT. few sellers take really the asking of their buyers (even i understand that all asking could not be taken). Here it is a very quick update , user support is excellent, thank you again.

    Produits recommandés
    The Penta-O is a 6-point retracement harmonacci pattern which usually precedes big market movements. Penta-O patterns can expand and repaint quite a bit. To make things easier this indicator implements a twist: it waits for a donchian breakout in the right direction before signaling the trade. The end result is an otherwise repainting indicator with a very reliable trading signal. The donchian breakout period is entered as an input. [ Installation Guide | Update Guide | Troubleshooting | FAQ | A
    Monster Harmonic Indicator
    Paul Geirnaerdt
    4.59 (29)
    Monster Harmonics Indicator is a harmonic pattern indicator. It recognizes Gartley, Bat, Crab, Butterfly, Cypher, White Swan, Black Swan, Shark and several other patterns. Projected patterns that are not yet completed are recognized, too. Monster even shows the PRZ (Potential Reversal Zone). Users can add their own user defined patterns to Monster. Besides the current pattern, Monster also shows all patterns in the symbols history. Monster will provide alerts for developing patterns. Introduced
    Noize Absorption Index MT4
    Ekaterina Saltykova
    5 (1)
    Noize Absorption Index - is the manual trading system that measures the difference of pressure between bears forces and bulls forces. Green line - is a noize free index that showing curent situation. Zero value of index shows totally choppy/flat market.Values above zero level shows how powerfull bullish wave is and values below zero measures bearish forces.Up arrow appears on bearish market when it's ready to reverse, dn arrow appears on weak bullish market, as a result of reverse expectation. S
    RTrends
    Nikolay Likhovid
    The RTrends indicator does two things: first, it automatically draws the layout of the price chart by plotting trend lines and, secondly, it produces bearish and bullish signals. The layout reflects the fractal nature of the market. Trends from different time horizons are applied simultaneously on the chart. Thus, from a single chart a trader can see trend lines of higher timeframes. The lines, depending on the horizon, differ in color and width: the older the horizon, the thicker the line is. T
    EZZ Elite Zig Zag is an indicator for the MetaTrader 4 terminal. This indicator traces the peak of the trend based on the market reversal, thus showing various opportunities in the financial market. EZZ Elite Zig Zag is a visual tool, intuitive, and easy to understand and use.  Test it Yourself by Downloading it for Free. Author Paulo Rocha all rights reserved
    Master Scalping M1 est un indicateur innovant qui utilise un algorithme pour déterminer rapidement et avec précision la tendance. L'indicateur calcule le temps d'ouverture et de fermeture des positions, les algorithmes de l'indicateur vous permettent de trouver les moments idéaux pour entrer dans une transaction (acheter ou vendre un actif), ce qui augmente le succès des transactions pour la plupart des commerçants. Avantages de l'indicateur : Facile à utiliser, ne surcharge pas le graphique ave
    Indicateur Crypto_Forex "3 Black Crows pattern" pour MT4. - L'indicateur "3 Black Crows pattern" est très puissant pour le trading Price Action : Pas de repeinture, pas de délai. - L'indicateur détecte les modèles baissiers "3 Black Crows" sur le graphique : Signal de flèche rouge sur le graphique (voir les images). - Avec alertes PC, Mobile et Email. - Son frère - l'indicateur haussier "3 White Soldiers pattern" est également disponible (suivez le lien ci-dessous). - L'indicateur "3 Black Cro
    Daily Candle Predictor est un indicateur qui prédit le cours de clôture d'une bougie. L'indicateur est principalement destiné à être utilisé sur les graphiques D1. Cet indicateur convient à la fois au trading forex traditionnel et au trading d'options binaires. L'indicateur peut être utilisé comme un système de trading autonome, ou il peut servir de complément à votre système de trading existant. Cet indicateur analyse la bougie actuelle, calcule certains facteurs de force à l'intérieur du corps
    Forex Gump
    Andrey Kozak
    2.4 (5)
    Forex Gump is a fully finished semi-automatic trading system. In the form of arrows, signals are displayed on the screen for opening and closing deals. All you need is to follow the instructions of the indicator. When the indicator shows a blue arrow, you need to open a buy order. When the indicator shows a red arrow, you need to open a sell order. Close orders when the indicator draws a yellow cross. In order to get the most effective result, we recommend using the timeframes H1, H4, D1. There
    Trend Oscillator - est un indicateur Crypto_Forex personnalisé avancé, un outil de trading efficace ! - Une nouvelle méthode de calcul avancée est utilisée - 20 options pour le paramètre « Prix pour le calcul ». - L'oscillateur le plus fluide jamais développé. - Couleur verte pour les tendances à la hausse, couleur rouge pour les tendances à la baisse. - Valeurs de survente : inférieures à 5, Valeurs de surachat : supérieures à 95. - Il existe de nombreuses possibilités de mettre à niveau même
    Infinity Trend Pro
    Yaroslav Varankin
    1 (1)
    This is a trend indicator without redrawing Developed instead of the binary options strategy (by the color of the Martingale candlestick) Also works well in forex trading When to open trades (binary options) A signal will appear in the place with a candle signaling the current candle It is recommended to open a deal for one candle of the current timeframe M1 and M5 When a blue dot appears, open a deal up When a red dot appears, open a trade down. How to open trades on Forex. When a signal is rec
    What are Heiken Ashi Candles? Heiken Ashi, derived from the Japanese term 'Heikin Ashi,' translates to average price bars. It's an indicator depicting price bars on a chart. Formula for Heiken Ashi candles: - Heiken Ashi opening price: (previous candle's opening + closing price) / 2 - Closing price Heiken Ashi: (opening + high + low + closing) / 4 - Heiken Ashi peak: Max of high, opening, or closing price - Heiken Ashi bottom price: Min of low, opening, or closing price How to Read Heiken A
    The Th3Eng PipFinite indicator is based on a very excellent analysis of the right trend direction with perfect custom algorithms. It show the true direction and the best point to start trading. With StopLoss point and Three Take Profit points. Also it show the right pivot of the price and small points to order to replace the dynamic support and resistance channel, Which surrounds the price. And Finally it draws a very helpful Box on the left side on the chart includes (take profits and Stop loss
    The CCI Divergence is a reasonably useful indicator in itself, but it is even more effective when used with divergence pattern trading. The CCI Divergence indicator signal is one of the most potent signals among the indicators that exist in the market. Here is new version for Divergence Indicator using CCI method, with more improvements. Divergences indicate a potential investment point because the directional moment does not confirm the price. A bullish divergence occurs when the underlying va
    The indicator detects and displays Shark harmonic pattern (see the screenshot). The pattern is plotted by the extreme values of the ZigZag indicator (included in the resources, no need to install). After detecting the pattern, the indicator notifies of that by a pop-up window, a mobile notification and an email. The indicator highlights the process of the pattern formation and not just the complete pattern. In the former case, it is displayed in the contour triangles. After the pattern is comple
    This indicator presents an alternative approach to identify Market Structure. The logic used is derived from learning material created by   DaveTeaches (on X) Upgrade v1.10: add option to put protected high/low value to buffer (figure 11, 12) When quantifying Market Structure, it is common to use fractal highs and lows to identify "significant" swing pivots. When price closes through these pivots, we may identify a Market Structure Shift (MSS) for reversals or a Break of Structure (BOS) for co
    This is a new strategy for SUPPLY DEMAND areas It is based on a calculation using the tick volume to detect the big price action in market for both bear /bull actions this smart volume action candles are used to determine the supply and demand areas prices in between main supply and demand lines indicate sideway market  up arrows will be shown when prices moves above the main supply and the secondary supply lines Down arrows will be shown when prices moves below the main demand and the secondary
    Trade with Gann on your side!! MASTER CIRCLE 360 CIRCLE CHART, originally created by Gann admitted that this is “The Mother of all charts”. It is one of the last studies that this great trader left for us. The numeric tab le is apparently quite simple like all the tables and is based on square numbers, the SQUARE OF 12 and is by evolution, one of the most important square numbers. Here we can find CYCLE, PRICE AND TIME thanks to angles and grades, to show past and future support and resistance.
    Fibonacci retracement and extension line drawing tool Fibonacci retracement and extended line drawing tool for MT4 platform is suitable for traders who use  golden section trading Advantages: There is no extra line, no too long line, and it is easy to observe and find trading opportunities Trial version: https://www.mql5.com/zh/market/product/35884 Main functions: 1. Multiple groups of Fibonacci turns can be drawn directly, and the relationship between important turning points can be seen
    The   Fibonacci Confluence Toolkit   is a technical analysis tool designed to help traders identify potential price reversal zones by combining key market signals and patterns. It highlights areas of interest where significant price action or reactions are anticipated, automatically applies Fibonacci retracement levels to outline potential pullback zones, and detects engulfing candle patterns. Its unique strength lies in its reliance solely on price patterns, eliminating the need for user-define
    Chart Patterns Detect 15 patterns (Ascending Triangle, Descending Triangle, Rising Wedge, Falling Wedge, Bullish Flag, Bearish Flag, Bullish Rectangle, Bearish Rectangle Symmetrical triangle, Head and Shoulders, Inverted Head and Shoulders, Triple top, Triple Bottom, Double Top, Double Bottom) Use historical data to calculate the probability of each pattern to succeed (possibility to filter notification according to the chance of success) gives graphic indication about the invalidation level and
    Indicateur Crypto_Forex "Hanging Man pattern" pour MT4. - L'indicateur "Hanging Man pattern" est un indicateur très puissant pour le trading Price Action : Pas de repeinture, pas de délai. - L'indicateur détecte les modèles baissiers de l'homme pendu sur le graphique : signal de flèche rouge sur le graphique (voir les images). - Avec alertes PC, Mobile et Email. - L'indicateur "Hanging Man pattern" est excellent à combiner avec les niveaux de support/résistance. // D'excellents robots et indi
    Key level wedge
    Presley Annais Tatenda Meck
    5 (5)
    The Key level wedge indicator automatically draws rising wedge pattern and falling wedge pattern for you on the chart. This pattern is really good when used as a confirmation entry at key support & resistance, supply & demand and reversal zones. Advantages  The Key level wedge block DOES NOT RE-PAINT, giving you confidence when a signal appears and also helps when looking back.  The Key level wedge includes an on/off button on the chart to easily keep the charts clean after analysis by just o
    Super Reversal Pattern
    Parfait Mujinga Ndalika
    Super Reversal Pattern Indicator Unlock the power of advanced pattern recognition with our Super Reversal Pattern Indicator. Designed for traders seeking precision and reliability, this indicator identifies one of the most effective reversal patterns in technical analysis, offering a significant edge in your trading strategy. Key Features: Non-Repainting Accuracy: Enjoy the confidence of non-repainting technology. Once a Super Reversal Pattern is detected, it remains static, providing consiste
    TWO PAIRS SQUARE HEDGE METER INDICATOR Try this brilliant 2 pairs square indicator It draws a square wave of the relation between your two inputs symbols when square wave indicates -1 then it is very great opportunity to SELL pair1 and BUY Pair2 when square wave indicates +1 then it is very great opportunity to BUY pair1 and SELL Pair2 the inputs are : 2 pairs of symbols         then index value : i use 20 for M30 charts ( you can try other values : 40/50 for M15 , : 30 for M30 , : 10 for H1 ,
    To get access to MT5 version please click here . - This is the exact conversion from TradingView: "Stochastic Momentum Index" By "UCSgears". - This is a popular version of stochastic oscillator on tradingview. - This is a light-load processing and non-repaint indicator. - Buffers are available for the lines on chart. - You can message in private chat for further changes you need. Thanks for downloading
    Blahtech Market Profile
    Blahtech Limited
    4.53 (15)
    Was: $249  Now: $149   Market Profile defines a number of day types that can help the trader to determine market behaviour. A key feature is the Value Area, representing the range of price action where 70% of trading took place. Understanding the Value Area can give traders valuable insight into market direction and establish the higher odds trade. It is an excellent addition to any system you may be using. Blahtech Limited presents their Market Profile indicator for the MetaTrader community. In
    Trend Bilio - an arrow indicator without redrawing shows potential market entry points in the form of arrows of the corresponding color: upward red arrows suggest opening a buy, green down arrows - selling. The entrance is supposed to be at the next bar after the pointer. The arrow indicator Trend Bilio visually "unloads" the price chart and saves time for analysis: no signal - no deal, if an opposite signal appears, then the current deal should be closed. It is Trend Bilio that is considered
    Advance Currency Meter is a currency meter that detects strong market trends. This indicator is good for scalping, intraday trading and swing trading. The indicator will detect short term to long term market trends. This will give you good insight which currencies are best to trade as of the moment. Note : Kindly contact me before you make any purchases. This won't work on your account without my permission. Note :   Works well with my MACD Currency Strength Meter
    Adaptive RSI
    Rasoul Mojtahedzadeh
    5 (2)
    Relative Strength Index (RSI) is one of the most popular and accurate oscillators widely used by traders to capture overbought and oversold areas of price action. Although the RSI indicator works fine for a period of market, it fails to generate profitable signals when market condition changes, and hence produces wrong signals which results in big losses. Have you ever thought about an adaptive RSI indicator that adapts its period of calculation based on the market conditions? The presented indi
    Les acheteurs de ce produit ont également acheté
    Gann Made Easy
    Oleg Rodin
    4.79 (111)
    Gann Made Easy est un système de trading Forex professionnel et facile à utiliser qui est basé sur les meilleurs principes de trading en utilisant la théorie de mr. WD Gann. L'indicateur fournit des signaux d'ACHAT et de VENTE précis, y compris les niveaux Stop Loss et Take Profit. Vous pouvez échanger même en déplacement en utilisant les notifications PUSH. S'il vous plaît contactez-moi après l'achat! Je partagerai avec vous mes astuces de trading et d'excellents indicateurs bonus gratuitement!
    Gold Stuff
    Vasiliy Strukov
    4.86 (247)
    Gold Stuff est un indicateur de tendance conçu spécifiquement pour l'or et peut également être utilisé sur n'importe quel instrument financier. L'indicateur ne se redessine pas et ne traîne pas. Délai recommandé H1. Au niveau de l'indicateur de travail, l'Expert Advisor EA Gold Stuff est entièrement automatique. Vous pouvez le trouver sur mon profil. Vous pouvez obtenir une copie gratuite de notre indicateur Strong Support et Trend Scanner, veuillez envoyer un message privé. moi! Contactez-mo
    Dynamic Forex28 Navigator
    Bernhard Schweigert
    5 (4)
    Dynamic Forex28 Navigator - L'outil de trading Forex de nouvelle génération. ACTUELLEMENT 49 % DE RÉDUCTION. Dynamic Forex28 Navigator est l'évolution de nos indicateurs populaires de longue date, combinant la puissance de trois en un : Advanced Currency Strength28 Indicator (695 avis) + Advanced Currency IMPULSE avec ALERT (520 avis) + CS28 Combo Signals (Bonus). Détails sur l'indicateur https://www.mql5.com/en/blogs/post/758844 Qu'offre l'indicateur de force de nouvelle génération ? Tout
    -   Real price is 80$   - 40% Discount ( It is 49$ now ) - Lifetime update free Contact me for instruction, add group and any questions! Related Products:  Bitcoin Expert , Gold Expert - Non-repaint - I just sell my products in Elif Kaya profile, any other websites are stolen old versions, So no any new updates or support. Introduction The breakout and retest strategy is traded support and resistance levels. it involves price breaking through a previous level.  The break and retest strategy is
    Gold Venamax MT4
    Sergei Linskii
    5 (1)
    Gold Venamax   - c'est le meilleur indicateur technique boursier. L'algorithme de l'indicateur analyse l'évolution des prix d'un actif et reflète la volatilité et les zones d'entrée potentielles. Caractéristiques de l'indicateur: Il s'agit d'un super indicateur avec Magic et deux blocs de flèches de tendance pour un trading confortable et rentable. Le bouton rouge pour changer de bloc est affiché sur le graphique. La magie est définie dans les paramètres de l'indicateur, afin que vous puissie
    Scalper Inside PRO
    Alexey Minkov
    4.76 (63)
    !SPECIAL SALE! An exclusive indicator that utilizes an innovative algorithm to swiftly and accurately determine the market trend. The indicator automatically calculates opening, closing, and profit levels, providing detailed trading statistics. With these features, you can choose the most appropriate trading instrument for the current market conditions. Additionally, you can easily integrate your own arrow indicators into Scalper Inside Pro to quickly evaluate their statistics and profitability
    Currency Strength Wizard est un indicateur très puissant qui vous offre une solution tout-en-un pour un trading réussi. L'indicateur calcule la puissance de telle ou telle paire de devises en utilisant les données de toutes les devises sur plusieurs périodes. Ces données sont représentées sous la forme d'un indice de devise facile à utiliser et de lignes électriques de devise que vous pouvez utiliser pour voir la puissance de telle ou telle devise. Tout ce dont vous avez besoin est d'attacher l'
    Smart Set up Levels
    Mohit Dhariwal
    5 (1)
    Smart Set up leve l is a very powerful indicator based on the concept of order blocks and set up entries with proper fvg and breakouts to make a very nice level to enter like a pro trader. Very easy to use interface and friendly to enter on buy and sell signals. Works Best on M15 Time frame on Gold, Bitcoin and Fx pairs. Daily 4-5 trades on each pair  Works great on gold like a pro on M15 It is non repainting nor lagging It is very powerful indicator giving precise entries and prop acts can be c
    Lux Trend
    Mohamed Hassan
    5 (1)
    The starting price is $75. It will increase to $120 after 30 sales. 18 copies left. After purchase, please contact me to get your trading tips + more information for a great bonus!   Lux Trend is a professional strategy based on using Higher Highs and Lower Highs to identify and draw Trendline Breakouts! Lux Trend  utilizes two Moving Averages to confirm the overall trend direction before scanning the market for high-quality breakout opportunities, ensuring more accurate and reliable trade s
    Golden Trend Indicator
    Noha Mohamed Fathy Younes Badr
    4.9 (10)
    Golden Trend indicator  is The best indicator for predicting trend movement this indicator never lags and never repaints and never back paints    and give  arrow buy and sell    before the candle appear  and it will help you and  will make your trading decisions clearer its work on all currencies and  gold and crypto and all time frame This unique  indicator uses very secret algorithms to catch the  trends, so you can trade using this indicator and see the trend clear on charts  manual guide and
    FX Levels MT4
    Daniel Stein
    5 (2)
    FX Levels : Des zones de Support et Résistance d’une Précision Exceptionnelle pour Tous les Marchés Présentation Rapide Vous recherchez un moyen fiable pour déterminer des niveaux de support et résistance dans n’importe quel marché—paires de devises, indices, actions ou matières premières ? FX Levels associe la méthode traditionnelle « Lighthouse » à une approche dynamique de pointe, offrant une précision quasi universelle. Grâce à notre expérience réelle avec des brokers et à des mises à jour
    Scalper Vault
    Oleg Rodin
    5 (28)
    Scalper Vault est un système de scalpage professionnel qui vous fournit tout ce dont vous avez besoin pour un scalpage réussi. Cet indicateur est un système de trading complet qui peut être utilisé par les traders de forex et d'options binaires. Le délai recommandé est M5. Le système vous fournit des signaux fléchés précis dans le sens de la tendance. Il vous fournit également des signaux supérieurs et inférieurs et des niveaux de marché Gann. Les indicateurs fournissent tous les types d'alertes
    IX Power MT4
    Daniel Stein
    4.71 (7)
    IX Power : Découvrez des insights de marché pour les indices, matières premières, cryptomonnaies et forex Vue d’ensemble IX Power est un outil polyvalent conçu pour analyser la force des indices, matières premières, cryptomonnaies et symboles forex. Tandis que FX Power offre une précision maximale pour les paires de devises en utilisant toutes les données disponibles, IX Power se concentre exclusivement sur les données du symbole sous-jacent. Cela fait de IX Power un excellent choix pour les m
    Easy Breakout
    Mohamed Hassan
    5 (9)
    After your purchase, feel free to contact me for more details on how to receive a bonus indicator called VFI, which pairs perfectly with Easy Breakout for enhanced confluence!   Easy Breakout is a powerful price action trading system built on one of the most popular and widely trusted strategies among traders: the Breakout strategy ! This indicator delivers crystal-clear Buy and Sell signals based on breakouts from key support and resistance zones. Unlike typical breakout indicators, it levera
    MTF Supply Demand Zones
    Georgios Kalomoiropoulos
    4.83 (23)
    Nouvelle génération de zones d'approvisionnement et de demande automatisées. Algorithme nouveau et innovant qui fonctionne sur n'importe quel graphique. Toutes les zones sont créées dynamiquement en fonction de l'action des prix du marché. DEUX TYPES D'ALERTES --> 1) QUAND LE PRIX ATTEINT UNE ZONE 2) QUAND UNE NOUVELLE ZONE SE FORME Vous n'obtenez pas un indicateur inutile de plus. Vous obtenez une stratégie de trading complète avec des résultats prouvés.     Nouvelles fonctionnalités:   
    Trend Screener
    STE S.S.COMPANY
    4.78 (93)
    Indicateur de tendance, solution unique révolutionnaire pour le trading et le filtrage des tendances avec toutes les fonctionnalités de tendance importantes intégrées dans un seul outil ! Il s'agit d'un indicateur multi-période et multi-devises 100 % non repeint qui peut être utilisé sur tous les symboles/instruments : forex, matières premières, crypto-monnaies, indices et actions. OFFRE À DURÉE LIMITÉE : L'indicateur Support and Resistance Screener est disponible pour seulement 50 $ et à vie. (
    Le système PRO Renko est un système de trading très précis spécialement conçu pour le trading de graphiques RENKO. Il s'agit d'un système universel qui peut être appliqué à divers instruments de négociation. Le système neutralise efficacement ce qu'on appelle le bruit du marché en vous donnant accès à des signaux d'inversion précis. L'indicateur est très facile à utiliser et n'a qu'un seul paramètre responsable de la génération du signal. Vous pouvez facilement adapter l'outil à n'importe que
    Gold Trend   - il s'agit d'un bon indicateur technique boursier. L'algorithme de l'indicateur analyse le mouvement du prix d'un actif et reflète la volatilité et les zones d'entrée potentielles. Les meilleurs signaux de l'indicateur: - Pour la VENTE = histogramme rouge + pointeur SHORT rouge + flèche de signalisation jaune dans la même direction. - Pour l'ACHETER = histogramme bleu + pointeur LONG bleu + flèche de signalisation aqua dans la même direction. Avantages de l'indicateur: 1. L'
    TPSproTREND PrO
    Roman Podpora
    4.68 (25)
    TPSpro TREND PRO   est un indicateur de tendance qui analyse automatiquement le marché et fournit des informations sur la tendance et chacun de ses changements, ainsi que des signaux pour entrer dans des transactions sans redessiner ! L'indicateur utilise chaque bougie et les analyse séparément. faisant référence à différentes impulsions - impulsion ascendante ou descendante. Points d'entrée précis dans les transactions sur les devises, les crypto-monnaies, les métaux, les actions, les indices !
    FX Power MT4 NG
    Daniel Stein
    4.94 (18)
    FX Power : Analysez la force des devises pour des décisions de trading plus intelligentes Aperçu FX Power est l'outil essentiel pour comprendre la force réelle des principales devises et de l'or, quelles que soient les conditions du marché. En identifiant les devises fortes à acheter et les faibles à vendre, FX Power simplifie vos décisions de trading et révèle des opportunités à forte probabilité. Que vous suiviez les tendances ou anticipiez les retournements à l'aide de valeurs extrêmes de D
    Découvrez le secret pour réussir le trading Forex avec notre indicateur MT4 personnalisé! Vous êtes-vous déjà demandé comment réussir sur le marché du Forex, gagnant régulièrement des bénéfices tout en minimisant les risques? Voici la réponse que vous avez recherchée! Permettez-nous d'introduire notre indicateur MT4 propriétaire qui révolutionnera votre approche du trading. Polyvalence unique Notre indicateur est spécialement conçu pour les utilisateurs qui préfèrent les formations de bougies
    Beast Super Signal
    Dustin Vlok
    4.73 (89)
    Vous recherchez un puissant indicateur de trading forex qui peut vous aider à identifier facilement des opportunités de trading rentables ? Ne cherchez pas plus loin que le Beast Super Signal. Cet indicateur basé sur les tendances facile à utiliser surveille en permanence les conditions du marché, en recherchant de nouvelles tendances en développement ou en sautant sur celles existantes. Le Beast Super Signal donne un signal d'achat ou de vente lorsque toutes les stratégies internes s'alignent e
    M1 Arrow
    Oleg Rodin
    5 (16)
    Une stratégie intraday basée sur deux principes fondamentaux du marché. L'algorithme est basé sur l'analyse des volumes et des vagues de prix à l'aide de filtres supplémentaires. L'algorithme intelligent de l'indicateur ne donne un signal que lorsque deux facteurs de marché se combinent en un seul. L'indicateur calcule les vagues d'une certaine plage sur le graphique M1 en utilisant les données de la période la plus élevée. Et pour confirmer la vague, l'indicateur utilise une analyse en volume.
    Essayez "Chart Patterns All in One" en mode démo et recevez un bonus. Envoyez-moi un message après l'avoir testé en mode démo pour recevoir votre bonus. Laissez un commentaire après l'achat pour recevoir 8 indicateurs de haute qualité en bonus. L'indicateur Chart Patterns All-in-One aide les traders à visualiser divers modèles de graphiques couramment utilisés dans l'analyse technique. Cet indicateur soutient l'identification des comportements potentiels du marché, mais ne garantit pas de renta
    FX Volume
    Daniel Stein
    4.59 (34)
    FX Volume : Découvrez le Sentiment du Marché tel que perçu par un Courtier Présentation Rapide Vous souhaitez faire passer votre approche de trading au niveau supérieur ? FX Volume vous fournit, en temps réel, des informations sur la manière dont les traders particuliers et les courtiers sont positionnés—bien avant la publication de rapports retardés comme le COT. Que vous visiez des gains réguliers ou recherchiez simplement un avantage plus solide sur les marchés, FX Volume vous aide à repére
    MetaBands M4
    Vahidreza Heidar Gholami
    5 (3)
    MetaBands uses powerful and unique algorithms to draw channels and detect trends so that it can provide traders with potential points for entering and exiting trades. It’s a channel indicator plus a powerful trend indicator. It includes different types of channels which can be merged to create new channels simply by using the input parameters. MetaBands uses all types of alerts to notify users about market events. Features Supports most of the channel algorithms Powerful trend detection algorith
    Enigmera
    Ivan Stefanov
    5 (7)
    ENIGMERA : Le cœur du marché Important : La démo de MQL5.com fonctionne dans le Strategy Tester et peut ne pas refléter pleinement les fonctionnalités d'Enigmera. Consultez la description, les captures d'écran et la vidéo pour plus de détails. N'hésitez pas à m'envoyer un message si vous avez des questions ! Le code de l'indicateur a été entièrement réécrit. La version 3.0 ajoute de nouvelles fonctionnalités et corrige les bugs accumulés depuis le lancement de l'indicateur. Introduction Cet in
    Advanced Supply Demand
    Bernhard Schweigert
    4.91 (294)
    CURRENTLY 26% OFF !! Best Solution for any Newbie or Expert Trader! This indicator is a unique, high quality and affordable trading tool because we have incorporated a number of proprietary features and a new formula. With this update, you will be able to show double timeframe zones. You will not only be able to show a higher TF but to show both, the chart TF, PLUS the higher TF: SHOWING NESTED ZONES. All Supply Demand traders will love it. :) Important Information Revealed Maximize the potentia
    FX Dynamic : Suivez la volatilité et les tendances grâce à une analyse ATR personnalisable Vue d’ensemble FX Dynamic est un outil performant s’appuyant sur les calculs de l’Average True Range (ATR) pour fournir aux traders des informations incomparables sur la volatilité quotidienne et intrajournalière. En définissant des seuils de volatilité clairs — par exemple 80 %, 100 % et 130 % — vous pouvez rapidement repérer des opportunités de profit ou recevoir des avertissements lorsque le marché dé
    Supply Demand Analyzer
    Suvashish Halder
    5 (4)
    Supply Demand Analyzer is an advanced trading indicator meticulously designed for the precise identification, analysis, and management of supply and demand zones. By integrating real-time data and advanced algorithms, this tool enables traders to recognize market phases, price movements, and structural patterns with unparalleled accuracy. It simplifies complex market dynamics into actionable insights, empowering traders to anticipate market behavior, identify trading opportunities, and make info
    Plus de l'auteur
    Special offer : ALL TOOLS , just $35 each! New tools   will be   $30   for the   first week   or the   first 3 purchases !  Trading Tools Channel on MQL5 : Join my MQL5 channel to update the latest news from me Commençons par les fonctionnalités exceptionnelles : L' EA est équipé d'un FILTRE D'ACTUALITÉS et d'un FILTRE RSI. Faible risque (certaines paires de devises ont un DrawDown de < 10 %, voire 5 %). Cet EA n'utilise aucune fonction de martingale ou de grille. L'EA peut afficher des zones v
    Special offer : ALL TOOLS , just $35 each! New tools   will be   $30   for the   first week   or the   first 3 purchases !  Trading Tools Channel on MQL5 : Join my MQL5 channel to update the latest news from me Découvrez la puissance du concept Inversion Fair Value Gap (IFVG) de l’ICT avec l’ Indicateur Inversion Fair Value Gaps ! Cet outil de pointe pousse les Fair Value Gaps (FVG) à un niveau supérieur en identifiant et affichant les zones de FVG inversées — des zones clés de support et de ré
    Special offer : ALL TOOLS , just $35 each! New tools   will be   $30   for the   first week   or the   first 3 purchases !  Trading Tools Channel on MQL5 : Join my MQL5 channel to update the latest news from me Découvrez la puissance du concept Inversion Fair Value Gap (IFVG) de l’ICT avec l’ Indicateur Inversion Fair Value Gaps ! Cet outil de pointe pousse les Fair Value Gaps (FVG) à un niveau supérieur en identifiant et affichant les zones de FVG inversées — des zones clés de support et de ré
    Special offer : ALL TOOLS , just $35 each! New tools   will be   $30   for the   first week   or the   first 3 purchases !  Trading Tools Channel on MQL5 : Join my MQL5 channel to update the latest news from me L'indicateur Volumetric Order Blocks Multi Timeframe est un outil puissant conçu pour les traders cherchant à obtenir des informations approfondies sur le comportement du marché en identifiant les zones clés de prix où les participants importants accumulent des ordres. Ces zones, connues
    Special offer : ALL TOOLS , just $35 each! New tools   will be   $30   for the   first week   or the   first 3 purchases !  Trading Tools Channel on MQL5 : Join my MQL5 channel to update the latest news from me L'Indicateur de Modèle de Renversement en Trois Barres offre un outil puissant pour les traders, identifiant et mettant en évidence automatiquement les modèles de renversement en trois barres directement sur le graphique des prix. Cet indicateur est une ressource précieuse pour détecter
    Special offer : ALL TOOLS , just $35 each! New tools   will be   $30   for the   first week   or the   first 3 purchases !  Trading Tools Channel on MQL5 : Join my MQL5 channel to update the latest news from me L'indicateur Supertrend Fakeout est une version améliorée de l'indicateur classique Supertrend , conçu pour fournir des signaux de tendance plus fiables. En intégrant des fonctionnalités avancées telles que Fakeout Index Limit et Fakeout ATR Mult , cet indicateur aide à filtrer les faux
    FREE
    Volumatic VIDyA MT5
    Duc Hoan Nguyen
    5 (1)
    Special offer : ALL TOOLS , just $35 each! New tools   will be   $30   for the   first week   or the   first 3 purchases !  Trading Tools Channel on MQL5 : Join my MQL5 channel to update the latest news from me Volumatic VIDYA (Variable Index Dynamic Average) est un indicateur avancé conçu pour suivre les tendances et analyser la pression d'achat et de vente à chaque phase d'une tendance. En utilisant la Moyenne Dynamique à Indice Variable (Variable Index Dynamic Average) comme technique centra
    Special offer : ALL TOOLS , just $35 each! New tools   will be   $30   for the   first week   or the   first 3 purchases !  Trading Tools Channel on MQL5 : Join my MQL5 channel to update the latest news from me Le Fibonacci Confluence Toolkit Multi-Timeframe est un outil avancé d'analyse technique conçu pour les traders professionnels, aidant à identifier les zones potentielles de renversement des prix en combinant des signaux et des modèles clés du marché. Avec des capacités d'affichage multi-
    Special offer : ALL TOOLS , just $35 each! New tools   will be   $30   for the   first week   or the   first 3 purchases !  Trading Tools Channel on MQL5 : Join my MQL5 channel to update the latest news from me Maximisez votre avantage commercial avec Follow Line MT5 avec Scanner, un indicateur avancé basé sur la volatilité conçu pour les traders sérieux. Cet outil combine la puissance des Bandes de Bollinger avec des paramètres personnalisables, offrant des informations précises sur les mouvem
    FREE
    Special offer : ALL TOOLS , just $35 each! New tools   will be   $30   for the   first week   or the   first 3 purchases !  Trading Tools Channel on MQL5 : Join my MQL5 channel to update the latest news from me Nous vous présentons le SuperTrend ATR Multiplier with Scanner for MT5 – un outil puissant et polyvalent conçu pour vous aider à anticiper les tendances du marché, avec des fonctionnalités personnalisables et des alertes en temps réel. Basé sur la logique éprouvée du SuperTrend de Kivanc
    FREE
    Special offer : ALL TOOLS , just $35 each! New tools   will be   $30   for the   first week   or the   first 3 purchases !  Trading Tools Channel on MQL5 : Join my MQL5 channel to update the latest news from me Libérez la puissance de l'apprentissage automatique avancé avec le Machine Learning Adaptive SuperTrend , un indicateur de pointe conçu pour s'adapter en douceur aux conditions de marché changeantes. En intégrant le clustering par k-means à la méthodologie SuperTrend, cet indicateur perm
    Special offer : ALL TOOLS , just $35 each! New tools   will be   $30   for the   first week   or the   first 3 purchases !  Trading Tools Channel on MQL5 : Join my MQL5 channel to update the latest news from me I. Introduction Market Structure Trend Targets Scanner est un outil puissant pour analyser les tendances du marché, identifier les points de rupture et gérer les risques grâce à un stop loss dynamique. En suivant les hauts et les bas précédents pour identifier les ruptures, cet outil ai
    Special offer : ALL TOOLS , just $35 each! New tools   will be   $30   for the   first week   or the   first 3 purchases !  Trading Tools Channel on MQL5 : Join my MQL5 channel to update the latest news from me Le Fibonacci Confluence Toolkit Multi-Timeframe est un outil avancé d'analyse technique conçu pour les traders professionnels, aidant à identifier les zones potentielles de renversement des prix en combinant des signaux et des modèles clés du marché. Avec des capacités d'affichage multi-
    Special offer : ALL TOOLS , just $35 each! New tools   will be   $30   for the   first week   or the   first 3 purchases !  Trading Tools Channel on MQL5 : Join my MQL5 channel to update the latest news from me L'indicateur Niveaux de Tendance (Trend Levels) est méticuleusement conçu pour identifier les niveaux de tendance critiques — Haut, Moyen et Bas — pendant les mouvements de marché. Avec des calculs en temps réel basés sur les valeurs les plus hautes, les plus basses et les niveaux moyens
    Special offer : ALL TOOLS , just $35 each! New tools   will be   $30   for the   first week   or the   first 3 purchases !  Trading Tools Channel on MQL5 : Join my MQL5 channel to update the latest news from me L'Indicateur de Modèle de Renversement en Trois Barres offre un outil puissant pour les traders, identifiant et mettant en évidence automatiquement les modèles de renversement en trois barres directement sur le graphique des prix. Cet indicateur est une ressource précieuse pour détecter
    Special offer : ALL TOOLS , just $35 each! New tools   will be   $30   for the   first week   or the   first 3 purchases !  Trading Tools Channel on MQL5 : Join my MQL5 channel to update the latest news from me Libérez la puissance de l'apprentissage automatique avancé avec le Machine Learning Adaptive SuperTrend , un indicateur de pointe conçu pour s'adapter en douceur aux conditions de marché changeantes. En intégrant le clustering par k-means à la méthodologie SuperTrend, cet indicateur perm
    Offre spéciale : ALL TOOLS , seulement 35 $ chacun ! New tools   will be   $30   for the   first week   or the   first 3 purchases !  Trading Tools Channel on MQL5 : Join my MQL5 channel to update the latest news from me Dans un environnement de trading volatile, un outil d’analyse puissant et intuitif peut vous aider à saisir rapidement les opportunités. Fibonacci Trend Scanner intègre non seulement les fonctionnalités traditionnelles de l’indicateur Fibonacci et SuperTrend, mais étend égaleme
    Volumatic VIDyA MT4
    Duc Hoan Nguyen
    5 (2)
    Special offer : ALL TOOLS , just $35 each! New tools   will be   $30   for the   first week   or the   first 3 purchases !  Trading Tools Channel on MQL5 : Join my MQL5 channel to update the latest news from me Volumatic VIDYA (Variable Index Dynamic Average) est un indicateur avancé conçu pour suivre les tendances et analyser la pression d'achat et de vente à chaque phase d'une tendance. En utilisant la Moyenne Dynamique à Indice Variable (Variable Index Dynamic Average) comme technique centra
    Special offer : ALL TOOLS , just $35 each! New tools   will be   $30   for the   first week   or the   first 3 purchases !  Trading Tools Channel on MQL5 : Join my MQL5 channel to update the latest news from me L'indicateur Volumetric Order Blocks Multi Timeframe est un outil puissant conçu pour les traders cherchant à obtenir des informations approfondies sur le comportement du marché en identifiant les zones clés de prix où les participants importants accumulent des ordres. Ces zones, connues
    Special offer : ALL TOOLS , just $35 each! New tools   will be   $30   for the   first week   or the   first 3 purchases !  Trading Tools Channel on MQL5 : Join my MQL5 channel to update the latest news from me L'indicateur Supertrend Fakeout est une version améliorée de l'indicateur classique Supertrend , conçu pour fournir des signaux de tendance plus fiables. En intégrant des fonctionnalités avancées telles que Fakeout Index Limit et Fakeout ATR Mult , cet indicateur aide à filtrer les faux
    FREE
    Special offer : ALL TOOLS , just $35 each! New tools   will be   $30   for the   first week   or the   first 3 purchases !  Trading Tools Channel on MQL5 : Join my MQL5 channel to update the latest news from me Vue d’ensemble OA SnR Power est un outil puissant conçu pour aider les traders à identifier et évaluer la force des niveaux de support et de résistance. En intégrant des facteurs clés tels que le volume de trading, la fréquence des rebonds et le nombre de retests, cet indicateur offre u
    FREE
    Special offer : ALL TOOLS , just $35 each! New tools   will be   $30   for the   first week   or the   first 3 purchases !  Trading Tools Channel on MQL5 : Join my MQL5 channel to update the latest news from me SMC est une approche de trading qui aide les traders à identifier les zones de liquidité, les positions des ordres institutionnels et les points de retournement clés du marché. En utilisant les principes du SMC, les traders peuvent naviguer plus efficacement sur le marché, trouvant les m
    Special offer : ALL TOOLS , just $35 each! New tools   will be   $30   for the   first week   or the   first 3 purchases !  Trading Tools Channel on MQL5 : Join my MQL5 channel to update the latest news from me Dans le paysage actuel du trading financier, où la volatilité est importante, l’identification précise des niveaux de support et de résistance est cruciale pour permettre aux traders de prendre des décisions éclairées. Predictive Ranges Scanner Multi-TF est un outil avancé conçu pour aid
    Special offer : ALL TOOLS , just $35 each! New tools   will be   $30   for the   first week   or the   first 3 purchases !  Trading Tools Channel on MQL5 : Join my MQL5 channel to update the latest news from me I. Introduction Market Structure Trend Targets Scanner est un outil puissant pour analyser les tendances du marché, identifier les points de rupture et gérer les risques grâce à un stop loss dynamique. En suivant les hauts et les bas précédents pour identifier les ruptures, cet outil ai
    SMC System MT4
    Duc Hoan Nguyen
    5 (1)
    Special offer : ALL TOOLS , just $35 each! New tools   will be   $30   for the   first week   or the   first 3 purchases !  Trading Tools Channel on MQL5 : Join my MQL5 channel to update the latest news from me SMC est une approche de trading qui aide les traders à identifier les zones de liquidité, les positions des ordres institutionnels et les points de retournement clés du marché. En utilisant les principes du SMC, les traders peuvent naviguer plus efficacement sur le marché, trouvant les m
    Special offer : ALL TOOLS , just $35 each! New tools   will be   $30   for the   first week   or the   first 3 purchases !  Trading Tools Channel on MQL5 : Join my MQL5 channel to update the latest news from me L'indicateur Zero Lag MA Trend Levels MT5 avec Scanner combine la moyenne mobile à zéro décalage (ZLMA) avec une moyenne mobile exponentielle standard (EMA), offrant aux traders une vue complète de la dynamique du marché et des niveaux de prix clés. De plus, les fonctions de scanner et d
    Special offer : ALL TOOLS , just $35 each! New tools   will be   $30   for the   first week   or the   first 3 purchases !  Trading Tools Channel on MQL5 : Join my MQL5 channel to update the latest news from me L’indicateur Liquidity Pools est un outil avancé qui identifie et marque les zones de liquidité potentielles sur le graphique en analysant les zones de hauts et bas avec des touches fréquentes de mèches, le nombre de revisites et le volume échangé dans chaque zone. Cet outil offre aux tr
    Special offer : ALL TOOLS , just $35 each! New tools   will be   $30   for the   first week   or the   first 3 purchases !  Trading Tools Channel on MQL5 : Join my MQL5 channel to update the latest news from me Maximisez votre avantage commercial avec Follow Line avec Scanner, un indicateur avancé basé sur la volatilité conçu pour les traders sérieux. Cet outil combine la puissance des Bandes de Bollinger avec des paramètres personnalisables, offrant des informations précises sur les mouvements
    FREE
    Special offer : ALL TOOLS , just $35 each! New tools   will be   $30   for the   first week   or the   first 3 purchases !  Trading Tools Channel on MQL5 : Join my MQL5 channel to update the latest news from me L’indicateur AI Channels utilise le clustering K-means mobile , une technique puissante d’apprentissage automatique en analyse de regroupement, pour fournir des informations en temps réel sur les tendances de prix sous-jacentes. Cet indicateur crée des canaux adaptatifs basés sur les don
    FREE
    Special offer : ALL TOOLS , just $35 each! New tools   will be   $30   for the   first week   or the   first 3 purchases !  Trading Tools Channel on MQL5 : Join my MQL5 channel to update the latest news from me Vue d’ensemble OA SnR Power est un outil puissant conçu pour aider les traders à identifier et évaluer la force des niveaux de support et de résistance. En intégrant des facteurs clés tels que le volume de trading, la fréquence des rebonds et le nombre de retests, cet indicateur offre u
    FREE
    Filtrer:
    totee toto
    54
    totee toto 2025.02.17 12:07 
     

    Interest indicator. Help for my trading.Well done.

    Duc Hoan Nguyen
    21592
    Réponse du développeur Duc Hoan Nguyen 2025.02.17 12:16
    Thank you for your review!
    I’m glad to hear that the indicator has been helpful for you.
    Wishing you successful trading!
    Yusuf Hamzah
    721
    Yusuf Hamzah 2024.12.17 14:03 
     

    Unique. RSI + KDE. Scientifically sound. The concept provides a good unbiased additional confirmation of a possible reversal. Well done.

    Duc Hoan Nguyen
    21592
    Réponse du développeur Duc Hoan Nguyen 2024.12.17 14:13
    Thank you for your positive review.
    I'm pleased that product met your expectations.
    Wishing you continued success in your trading!
    danmar
    1774
    danmar 2024.12.04 06:11 
     

    i buy this one because i read the review of XANKEEZ on the other excellent product that i bought Volumetric Order Blocks MT4 Multi Timeframe and it is also a great one which works very well with volumetric : Well Done and today i upload the new version with new functionalities that i ask yesterday 3 december for future update! so quick and for me he makes my chart clearer and with less space taken for the MTF with use of Y negative to hide upper part of title Then THANK YOU A LOT. few sellers take really the asking of their buyers (even i understand that all asking could not be taken). Here it is a very quick update , user support is excellent, thank you again.

    Duc Hoan Nguyen
    21592
    Réponse du développeur Duc Hoan Nguyen 2024.12.04 10:23
    Thank you for your review!
    I'm glad the indicator meets your needs and makes your trading smoother. Supporting customers is always my top priority.
    Wishing you great success!
    XANKEEZ
    366
    XANKEEZ 2024.11.28 03:54 
     

    one of the indicators i was really interested in but i never thought i would be able to use it on MT4. this is really a great tool. one of MUST HAVE tool for trading. thanks to the author who made it possible.

    Duc Hoan Nguyen
    21592
    Réponse du développeur Duc Hoan Nguyen 2024.11.28 09:26
    Thank you for your review! Glad to hear the tool is helpful for you.
    Wishing you successful trading!
    Répondre à l'avis
    Version 2.10 2025.02.27
    Optimized dashboard algorithm
    Version 2.0 2024.12.31
    - Optimized the algorithm to make the indicator a little faster.
    - Improved user experience with the dashboard.
    - Added the feature to hide/show indicator on the current chart.
    Version 1.15 2024.12.03
    - From now on all labels in the indicator will use the font parameter in the scanner section
    - Added label size, label spacing parameter for RSI and KDE Labels
    - Can accept negative numbers for fixed X, Y parameters (be careful when using)
    Version 1.14 2024.12.02
    Added parameters to fixed the dashboards from the beginning (Movable, fixed X, fixed Y)
    Version 1.10 2024.11.01
    Fixed a minor bug related to Alerts