• Aperçu
  • Avis (1)
  • Commentaires
  • Nouveautés

Times and Sales Pro

Times and Sales Pro : Optimisez vos opérations grâce à l'inégalité dans le flux de transactions 📊🚀

🔎 Opportunités sur de petits mouvements de prix
Times and Sales Pro est un outil essentiel pour les analystes qui travaillent avec le flux d'ordres via Times and Trades. Idéal pour les scalpers, il a été conçu pour ceux qui souhaitent tirer parti de petites fluctuations de prix avec une grande précision. Grâce à des calculs avancés, cet indicateur identifie les déséquilibres dans les transactions, fournissant des signaux précieux pour des entrées et sorties rapides.

💡 IMPORTANT : Disponibilité de Times and Trades sur MT5
Avant d'utiliser Times and Sales Pro, assurez-vous que votre courtier propose l'accès à Times and Trades sur MT5. Cet indicateur dépend de ces données pour générer des calculs précis en temps réel, car MT5 ne stocke pas l'historique des transactions. Par conséquent, l'indicateur ne fonctionne qu'en temps réel, offrant une lecture immédiate des transactions exécutées sur le marché.

🚀 Avantages de Times and Sales Pro

  1. Analyse avancée du flux de transactions avec des couleurs claires
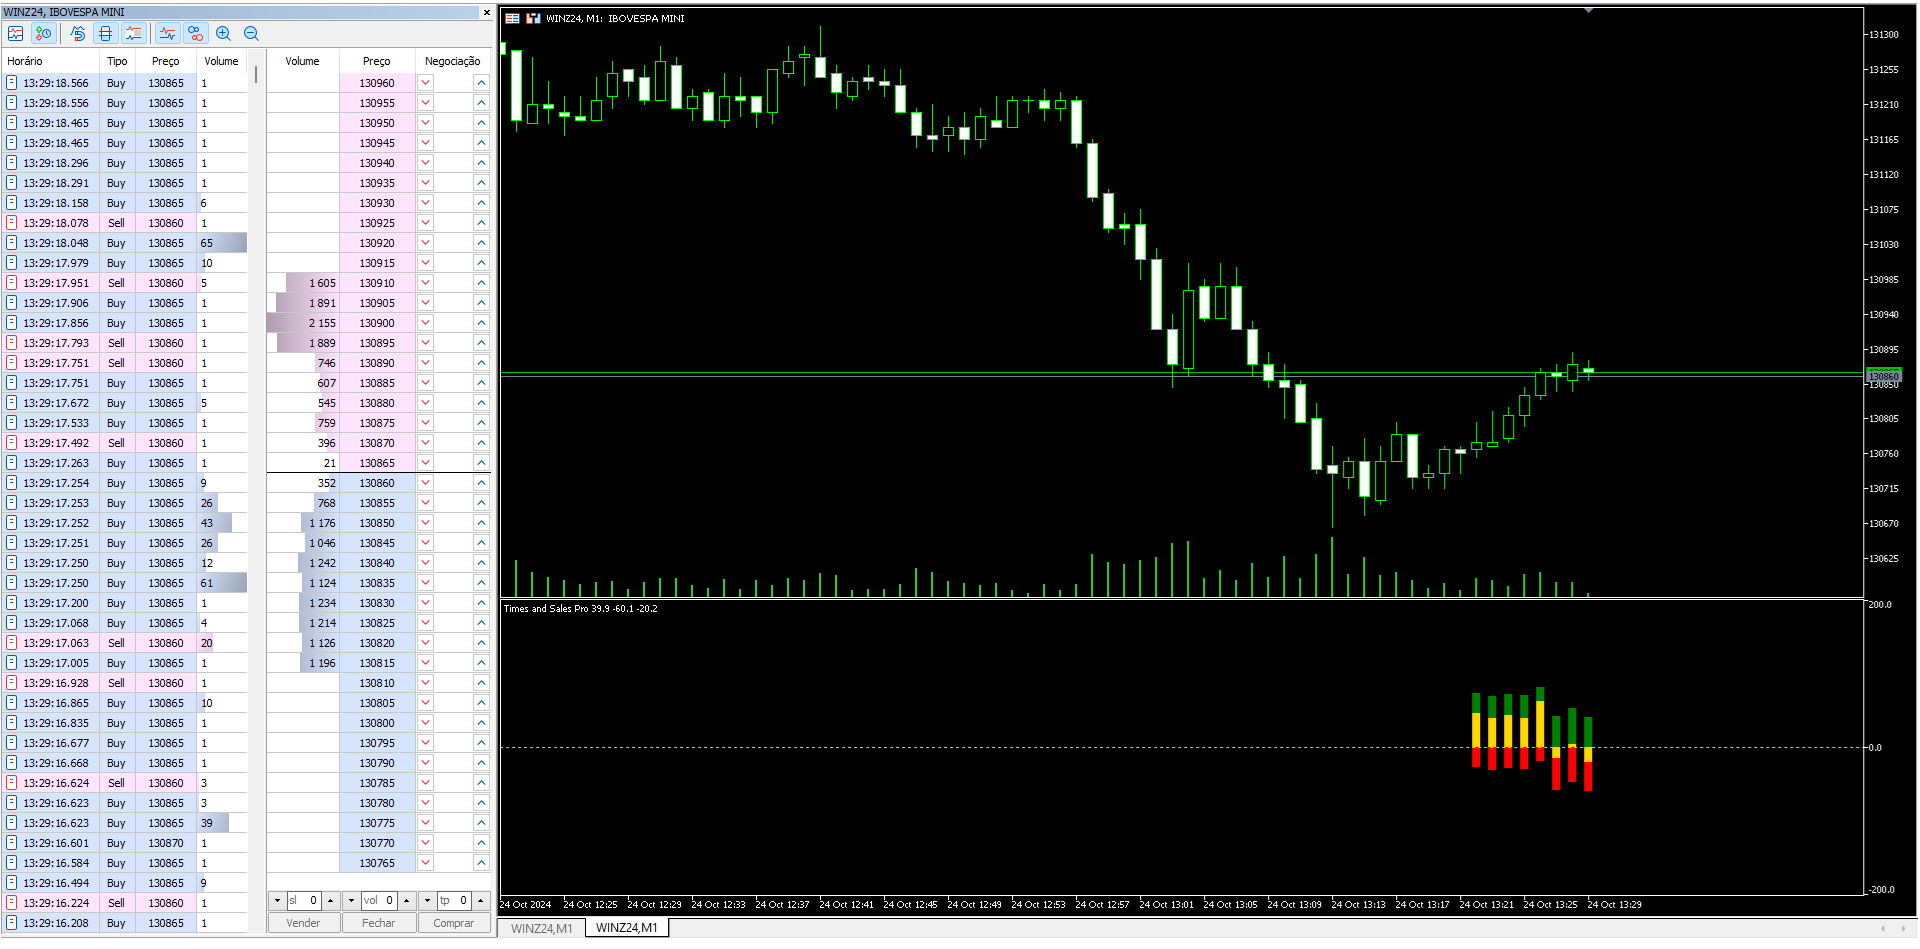
    Times and Sales Pro facilite la visualisation des déséquilibres dans les transactions à l'aide de codes couleur spécifiques :

    • Vert : Représente les ordres d'achat.
    • Rouge : Représente les ordres de vente.
    • Or : Indique le déséquilibre entre les ordres d'achat et de vente.

Ces couleurs permettent une lecture rapide et claire du flux de transactions, idéale pour les opérations à court terme, notamment le scalping.

  1. Signaux d'achat et de vente en temps réel
    Obtenez des signaux clairs et rapides directement sur votre graphique, vous permettant de réagir rapidement aux changements dans le flux de transactions en temps réel.

  2. Idéal pour les traders de flux de transactions
    Si vous tradez en vous basant sur le flux d'ordres exécutés, cet indicateur est parfait pour maximiser votre efficacité. Il offre une vision claire sur le déséquilibre entre les ordres d'achat et de vente, améliorant ainsi vos décisions avec précision.

  3. Compatible avec la création de puissants conseillers experts (EAs)
    Times and Sales Pro offre des buffers pour l'intégration avec des EAs (Conseillers Experts). Configurez vos buffers pour construire un expert robuste :

    • Buffer 0 : Signal d'achat
    • Buffer 1 : Signal de vente
    • Buffer 2 : Déséquilibre (Or)

Ces fonctionnalités vous permettent d'automatiser des stratégies basées sur l'inégalité du flux de transactions et d'optimiser vos opérations.

  1. Facile à utiliser et à configurer
    Avec son interface intuitive et son analyse précise du flux de transactions, Times and Sales Pro simplifie vos opérations, offrant des analyses détaillées en temps réel sans complications.

Produits recommandés
The indicator highlights the points that a professional trader sees in ordinary indicators. VisualVol visually displays different volatility indicators on a single scale and a common align. Highlights the excess of volume indicators in color. At the same time, Tick and Real Volume, Actual range, ATR, candle size and return (open-close difference) can be displayed. Thanks to VisualVol, you will see the market periods and the right time for different trading operations. This version is intended f
FREE
Value Chart Candlesticks
Flavio Javier Jarabeck
4.73 (11)
The idea of a Value Chart indicator was presented in the very good book I read back in 2020 , " Dynamic Trading Indicators: Winning with Value Charts and Price Action Profile ", from the authors Mark Helweg and David Stendahl. The idea is simple and the result is pure genius: Present candlestick Price analysis in a detrended way! HOW TO READ THIS INDICATOR Look for Overbought and Oversold levels. Of course, you will need to test the settings a lot to find the "correct" one for your approach. It
FREE
Weis Waves
Flavio Javier Jarabeck
2.83 (18)
The original author is David Weis, an expert in the Wyckoff Method. The Weis Wave is a modern adaptation of the 1930's Wyckoff Method, another expert in Tape Reading techniques and Chart Analysis. Weis Waves takes market volume and stacks it into waves according to price conditions giving the trader valuable insights about the market conditions. If you want to learn more about this subject you can find tons of videos in YouTube. Just look for "The Wickoff Method", "Weis Wave" and "Volume Spread
FREE
White Weis Volume Ticks
Ricardo Almeida Branco
5 (4)
White Weis Volume This indicator shows the sum of the volume in each wave, bulish or bearish, as idealized by David Weis , but it brings an important addition , which is the marking of the bar with the highest volume of the wave (White Bar)! In coding the indicator, it was sought to optimize the code to require minimal processing during use and not to overload mt5. The indicator can be used for pre-trading analysis and study, where the trader analyzes possible points of support and resistance
Hunttern ZigZag MT5
Hassan Gh Fakhraei
5 (1)
Hunt markets with Hunttern ZigZag . Easy to use with one parameter    You can use it for the following:       -Classic patterns       -Heads and shoulders       -Harmonic patterns       -Elliott Wave       -Support and resistance       -Supply and Demand Single parameter:      -Period (1-120) Features:        -Candle time        -Single parameter        -Light mode template This is version 1 of Hunttern ZigZag. We are very happy to receive feedback from you.
FREE
A countdown timer for the  Volume bar chart generator  and  Tick chart generator  products, which are available for download from the MQL5 Market: Tick chart generator: https://www.mql5.com/en/market/product/29215 Volume bar chart generator: https://www.mql5.com/en/market/product/47197 The counter conveniently displays the number of ticks or transactions (depending on the chart) that need to pass for a new bar to start printing. The user can set the following indicator inputs. Volume type (Tic
FREE
High Low Open Close
Alexandre Borela
4.98 (42)
Si vous aimez ce projet, laissez un examen 5 étoiles. Cet indicateur tire les prix ouverts, élevés, bas et de fermeture pour les prix spécifiés période et il peut être ajusté pour un fuseau horaire spécifique. Il s ' agit là d ' un niveau important qui s ' intéresse à de nombreux domaines institutionnels et professionnels. traders et peut être utile pour vous de connaître les endroits où ils pourraient être plus active. Les périodes disponibles sont les suivantes : Jour précédent. Semaine pré
FREE
Girassol Sunflower MT5 Indicator
Saullo De Oliveira Pacheco
4.33 (6)
This is the famous Sunflower indicator for Metatrader5. This indicator marks possible tops and bottoms on price charts. The indicator identifies tops and bottoms in the asset's price history, keep in mind that the current sunflower of the last candle repaints, as it is not possible to identify a top until the market reverses and it is also not possible to identify a bottom without the market stop falling and start rising. If you are looking for a professional programmer for Metatrader5, please
FREE
LT Donchian Channel
Thiago Duarte
4.83 (6)
Donchian Channel is an indicator created by Richard Donchian. It is formed by taking the highest high and the lowest low of the last specified period in candles. The area between high and low is the channel for the chosen period. Its configuration is simple. It is possible to have the average between the upper and lower lines, plus you have alerts when price hits one side. If you have any questions or find any bugs, please contact me. Enjoy!
FREE
Follow The Line MT5
Oliver Gideon Amofa Appiah
4.52 (29)
This indicator obeys the popular maxim that: "THE TREND IS YOUR FRIEND" It paints a GREEN line for BUY and also paints a RED line for SELL. (you can change the colors). It gives alarms and alerts of all kinds. IT DOES NOT REPAINT and can be used for all currency pairs and timeframes. Yes, as easy and simple as that. Even a newbie can use it to make great and reliable trades. NB: For best results, get my other premium indicators for more powerful and reliable signals. Get them here: https://www.m
FREE
Free automatic Fibonacci is an indicator that automatically plots a Fibonacci retracement based on the number of bars you select on the BarsToScan setting in the indicator. The Fibonacci is automatically updated in real time as new highest and lowest values appears amongst the selected bars. You can select which level values to be displayed in the indicator settings. You can also select the color of the levels thus enabling the trader to be able to attach the indicator several times with differe
FREE
RSI back arrows
Smaylle Rafael Coelho Mariano
L'indicateur   Flèches de Retour RSI   est un outil puissant conçu pour les traders qui s'appuient sur l'Indice de Force Relative (RSI) afin d'identifier les éventuelles retournements de marché. Cet indicateur met en évidence lorsque le RSI sort des zones   suracheté   ou   survendu , fournissant des signaux visuels clairs pour orienter les décisions de trading. Caractéristiques Principales : Indices Visuels   : L'indicateur marque des flèches sur le graphique lorsque le RSI revient dans une zon
FREE
MIDAS Super VWAP
Flavio Javier Jarabeck
4.44 (9)
Imagine VWAP, MVWAP and MIDAS in one place... Well, you found it! Now you can track the movement of Big Players in various ways, as they in general pursue the benchmarks related to this measuring, gauging if they had good execution or poor execution on their orders. Traders and analysts use the VWAP to eliminate the noise that occurs throughout the day, so they can measure what prices buyers and sellers are really trading. VWAP gives traders insight into how a stock trades for that day and deter
FREE
Donchian Pro
Paulo Henrique Faquineli Garcia
5 (3)
The Donchian Channel Channels are among the most popular tools of technical analysis, as they visually convey to the analyst the limits within which most price movement tends to occur. Channel users know that valuable information can be obtained at any time, whether prices are in the central region of a band or close to one of the border lines. One of the best known techniques to explore these concepts is Bollinger Bands. However, John Bollinger was not the only one to research the application
FREE
Introduction This indicator detects volume spread patterns for buy and sell opportunity. The patterns include demand and supply patterns. You might use each pattern for trading. However, these patterns are best used to detect the demand zone (=accumulation area) and supply zone (=distribution area). Demand pattern indicates generally potential buying opportunity. Supply pattern indicates generally potential selling opportunity. These are the underlying patterns rather than direct price action. T
FREE
This is a buyer and seller aggression indicator that analyzes the shape of each candle and project this data in a histogram form. There are 4 histograms in one. On the front we have two: Upper - Buyer force. Lower - Seller force. At the background we also have two histogram, both with same color. They measure the combined strenght of buyers and sellers. This histograms can be turned off in Input Parameters. It is also possible to have the real or tick volume to help on this force measurement. IN
FREE
Bar Color Trend
Germano Chagas
4.38 (8)
Combining the best of Price Action , Directional Movement , and Divergence/Convergence analysis, Candle Color Trend is a easy and reliable way to identify trend direction. The indicator automatically paints the candles according to the assumption that an uptrend is defined by prices that form a series of higher highs and higher lows. In contrast, a downtrend is defined by prices that form a series of lower highs and lower lows. Additionally, ADX Wilder indicator is used to measure trend weakness
FREE
Waves Sizer
Flavio Javier Jarabeck
3.67 (6)
Wyckoff fans, enjoy! Ideally to be used with the Weis Waves indicator, but it can be easily used alone, the Waves Sizer puts the range (in resulting Price movement) done by the Price on its market swings. You can control how accurate or loose will be the swings. This tool is very helpful for visually know how much the Price has traveled in your Timeframe. This way you can confront this level of effort with the resulting Volume, etc... Weis Waves indicator: https://www.mql5.com/en/market/produc
FREE
RSI on Moving Average Indicator for MT5 Introduction The RSI on MA Indicator integrates Moving Average Crossovers with the Relative Strength Index (RSI) to enhance trend detection and momentum analysis. By merging these technical elements, it improves precision in identifying market movements. The indicator displays two oscillating lines ranging from 0 to 100, making it easier to pinpoint buy and sell opportunities while clarifying trend directions. RSI on Moving Average Indicator Specification
FREE
Are you tired of drawing trendlines every time you're analyzing charts? Or perhaps you would like more consistency in your technical analysis. Then this is for you. This indicator will draw trend lines automatically when dropped on a chart. How it works Works similar to standard deviation channel found on mt4 and mt5. It has 2 parameters: 1. Starting Bar 2. Number of bars for calculation The   starting bar   is the bar which drawing of the trend lines will begin, while the   number of bars for c
FREE
Simple Vwap with the daily, weekly and monthly VWAP is the abbreviation for   volume-weighted average price , which is a technical analysis tool that shows the ratio of an asset's price to its total trade volume. It provides traders and investors with a measure of the average price at which a stock is traded over a given period of time. How it's used Identify entry and exit points:   Traders can use VWAP to determine when to buy or sell an asset.   Understand price trends :  Traders can use V
FREE
Pivot Point Fibo RSJ est un indicateur qui trace les lignes de support et de résistance de la journée en utilisant les taux de Fibonacci. Cet indicateur spectaculaire crée jusqu'à 7 niveaux de support et de résistance via Pivot Point en utilisant les taux de Fibonacci. C'est fantastique de voir comment les prix respectent chaque niveau de ce support et de cette résistance, où il est possible de percevoir les points d'entrée/sortie possibles d'une opération. Caractéristiques Jusqu'à 7 niveaux
FREE
Aggression Volume
Flavio Javier Jarabeck
4.14 (14)
Aggression Volume Indicator is the kind of indicator that is rarely found in the MQL5 community because it is not based on the standard Volume data provided by the Metatrader 5 platform. It requires the scrutiny of all traffic Ticks requested on the platform... That said, Aggression Volume indicator requests all Tick Data from your Broker and processes it to build a very special version of a Volume Indicator, where Buyers and Sellers aggressions are plotted in a form of Histogram. Additionally,
FREE
Weis Wave Double Side
Eduardo Da Costa Custodio Santos
L'indicateur latéral Weis Wave Bouble pour MT5 fait partie de la boîte à outils (Wyckoff Academy Wave Market) L'indicateur latéral Weis Wave Bouble pour MT5 a été créé sur la base de la Weis Wave déjà établie créée par David Weis. L'indicateur Weis Wave Double Side lit le marché par vagues comme cela a été fait par R. Wyckoff en 1900. Il aide à identifier l'effort x le résultat, la cause et l'effet, et l'offre et la demande Son différentiel est qu'il peut être utilisé en dessous de l'axe zéro, a
L'indicateur montre des niveaux ronds sur le graphique. Ils sont également appelés niveaux psychologiques, niveaux de banque ou niveaux des principaux acteurs. À ces niveaux, il y a une véritable lutte entre les haussiers et les baissiers, une accumulation de nombreux ordres, ce qui entraîne une volatilité accrue. L'indicateur s'adapte automatiquement à tout instrument et à toute période. Si le niveau 80 est cassé puis testé, il faut acheter. Si le niveau 20 est cassé puis testé, vendre. L'obje
FREE
Bollinger Bands B
Flavio Javier Jarabeck
4.5 (2)
John Bollinger created this indicator in 2010 as a way to read the original indicator (Bollinger Bands) in a more "technical" way, shown as an oscillator. The typical range of the Bollinger Bands %B is 0 - 0.5 - 1.0, where "0" represents the lower band, the "0.5" the middle band, and "1" the upper band. The line on the indicator represents the Closing prices. As simple as that. SETTINGS Bollinger Bands period of analysis Standard Deviation multiplier Shift Price type to be analyzed If you like
FREE
Cybertrade Keltner Channels
Emanuel Andriato
4.75 (4)
Cybertrade Keltner Channels - MT5 Created by Chester Keltner, this is a volatility indicator used by technical analysis. It is possible to follow the trend of financial asset prices and generate support and resistance patterns. In addition, envelopes are a way of tracking volatility in order to identify opportunities to buy and sell these assets. It works on periods longer than the period visible on the chart. All values ​​are available in the form of buffers to simplify possible automations.
FREE
Best SAR MT5
Ashkan Hazegh Nikrou
4.33 (3)
La description :  nous sommes heureux de vous présenter notre nouvel indicateur gratuit basé sur l'un des indicateurs professionnels et populaires du marché des changes (PSAR). Cet indicateur est une nouvelle modification de l'indicateur SAR parabolique original. Dans l'indicateur pro SAR, vous pouvez voir un croisement entre les points et le graphique des prix. le croisement n'est pas un signal mais parle du potentiel de fin de mouvement, vous pouvez commencer à acheter par un nouveau point b
FREE
Tabajara V5
Flavio Javier Jarabeck
4.82 (34)
Metatrader 5 version of the famous Andre Machado's Tabajara indicator. If you don't know Andre Machado's Technical Analysis work you don't need this indicator... For those who need it and for those several friend traders who asked this porting from other platforms, here it is... FEATURES 8-period Moving Average 20-period Moving Average 50-period Moving Average 200-period Moving Average Colored candles according to the inflexion of the 20-period MA SETTINGS You can change the Period of all MA's
FREE
Stackable VWAP
Flavio Javier Jarabeck
3.5 (4)
Volume Weighted Average Price (VWAP) is a trading benchmark commonly used by Big Players that gives the average price a Symbol has traded throughout the day. It is based on both Volume and price. Additionally we put in this indicator the MVWAP (Moving Volume Weighted Average Price). For those who do not know the usage and the importance od this indicator I recommend a great article about this subject at Investopedia ( https://www.investopedia.com/articles/trading/11/trading-with-vwap-mvwap.asp
FREE
Les acheteurs de ce produit ont également acheté
TPSpro RFI Levels MT5
Roman Podpora
4.53 (19)
INSTRUCTIONS       RUS   -   ANGLAIS       Il   est recommandé de l'utiliser avec un indicateur       -       TPSpro   TENDANCE PRO -   Version MT4         Bonus: 6 months of  "RFI SIGNALS"  subscription with your purchase! Un élément clé du trading est constitué par les zones ou les niveaux à partir desquels les décisions d'achat ou de vente d'un instrument de trading sont prises. Malgré les tentatives des principaux acteurs de dissimuler leur présence sur le marché, ils laissent inévitable
PZ Trend Trading MT5
PZ TRADING SLU
3.8 (5)
Capture every opportunity: your go-to indicator for profitable trend trading Trend Trading is an indicator designed to profit as much as possible from trends taking place in the market, by timing pullbacks and breakouts. It finds trading opportunities by analyzing what the price is doing during established trends. [ Installation Guide | Update Guide | Troubleshooting | FAQ | All Products ] Trade financial markets with confidence and efficiency Profit from established trends without getting whip
RelicusRoad Pro MT5
Relicus LLC
4.78 (18)
Maintenant 147 $ (augmentant à 499 $ après quelques mises à jour) - Comptes illimités (PCS ou Mac) Manuel d'utilisation RelicusRoad + Vidéos de formation + Accès au groupe Discord privé + Statut VIP UNE NOUVELLE FAÇON DE REGARDER LE MARCHÉ RelicusRoad est l'indicateur de trading le plus puissant au monde pour le forex, les contrats à terme, les crypto-monnaies, les actions et les indices, offrant aux traders toutes les informations et tous les outils dont ils ont besoin pour rester rentables
CBT Quantum Maverick Système de Trading Binaire Haute Efficacité CBT Quantum Maverick est un système de trading binaire hautement performant, conçu pour les traders recherchant précision, simplicité et discipline. Aucune personnalisation n'est nécessaire : ce système est optimisé pour des résultats efficaces dès son installation. Avec un peu de pratique, il est facile de maîtriser les signaux. Caractéristiques principales : Précision des signaux : Signaux basés sur la bougie actuelle, ciblant
Elliott Wave Trend was designed for the scientific wave counting. This tool focuses to get rid of the vagueness of the classic Elliott Wave Counting using the guideline from the template and pattern approach. In doing so, firstly Elliott Wave Trend offers the template for your wave counting. Secondly, it offers Wave Structural Score to assist to identify accurate wave formation. It offers both impulse wave Structural Score and corrective wave Structure Score. Structural Score is the rating to sh
AT Forex Indicator MT5
Marzena Maria Szmit
5 (5)
The AT Forex Indicator MT5 is a sophisticated trading tool designed to provide traders with a comprehensive analysis of multiple currency pairs. This powerful indicator simplifies the complex nature of the forex market, making it accessible for both novice and experienced traders. AT Forex Indicator uses advanced algorithms to detect trends, patterns and is an essential tool for traders aiming to enhance their forex trading performance. With its robust features, ease of use, and reliable signal
Waterfall by Kratus
Justine Kelechi Ekweh
5 (1)
Overview The Waterfall Trading Indicator is a powerful momentum detection tool designed to identify high-probability trading opportunities across multiple timeframes. Built on pure price action analysis, this indicator provides clear, non-repainting signals that are especially effective for binary options and forex trading. Key Features Non-Repainting Signals : Based on real-time price action, ensuring reliable trade signals Multi-Timeframe Compatibility : Effective across all timeframes, with o
TPA True Price Action indicator reveals the true price action of the market makers through 100% non-repainting signals strictly at the close of a candle! TPA shows entries and re-entries, every time the bulls are definitely stronger than the bears and vice versa. Not to confuse with red/green candles. The shift of power gets confirmed at the earliest stage and is ONE exit strategy of several. There are available now two free parts of the TPA User Guide for our customers. The first "The Basics"
FxaccurateLS
Shiv Raj Kumawat
WHY IS OUR FXACCCURATE LS MT5 THE PROFITABLE ? PROTECT YOUR CAPITAL WITH RISK MANAGEMENT Gives entry, stop and target levels from time to time. It finds Trading opportunities by analyzing what the price is doing during established trends. POWERFUL INDICATOR FOR A RELIABLE STRATEGIES We have made these indicators with a lot of years of hard work. It is made at a very advanced level. Established trends provide dozens of trading opportunities, but most trend indicators completely ignore them! The
Trade smarter, not harder: Empower your trading with Harmonacci Patterns This is arguably the most complete harmonic price formation auto-recognition indicator you can find for the MetaTrader Platform. It detects 19 different patterns, takes fibonacci projections as seriously as you do, displays the Potential Reversal Zone (PRZ) and finds suitable stop-loss and take-profit levels. [ Installation Guide | Update Guide | Troubleshooting | FAQ | All Products ] It detects 19 different harmonic pri
BookMap HeatMap
Roberto Spadim
1 (2)
This Indicator creates a heatmap based on depth of market of the current symbol or another symbol. Other symbol is useful when you trade futures market and a contract has 'mini' and 'full' split. For example, in Brazil (B3 - BMF&Bovespa), WDO and DOL are future Forex contract of BRL/USD (where 1 DOL = 5 WDO) and big banks work mostly with DOL (where liquidity is important). Please use with M1 timeframe , objects are too small to be displayed at higher timeframes (MT5 limit). The number of level
MetaForecast M5
Vahidreza Heidar Gholami
5 (2)
MetaForecast prédit et visualise l'avenir de n'importe quel marché en se basant sur les harmoniques des données de prix. Bien que le marché ne soit pas toujours prévisible, s'il y a un motif dans les prix, MetaForecast peut prédire l'avenir aussi précisément que possible. Comparé à d'autres produits similaires, MetaForecast peut générer des résultats plus précis en analysant les tendances du marché. Paramètres d'entrée Past size (Taille passée) Spécifie le nombre de barres que MetaForecast util
TrendMaestro5
Stefano Frisetti
note: this indicator is for METATRADER4, if you want the version for METATRADER5 this is the link:  https://www.mql5.com/it/market/product/108106 TRENDMAESTRO ver 2.4 TRENDMAESTRO recognizes a new TREND in the bud, he never makes mistakes. The certainty of identifying a new TREND is priceless. DESCRIPTION TRENDMAESTRO identifies a new TREND in the bud, this indicator examines the volatility, volumes and momentum to identify the moment in which there is an explosion of one or more of these data a
Indicateur unique qui met en œuvre une approche professionnelle et quantitative pour signifier le trading de réversion. Il capitalise sur le fait que le prix dévie et revient à la moyenne de manière prévisible et mesurable, ce qui permet des règles d'entrée et de sortie claires qui surpassent largement les stratégies de trading non quantitatives. [ Installation Guide | Update Guide | Troubleshooting | FAQ | All Products ] Des signaux de trading clairs Étonnamment facile à échanger Couleurs et t
Elliot Waves Analyzer Pro
Viktor Weidenthal
2.67 (3)
Elliot Waves Analyzer Pro calculates Elliot Waves to Help Identify Trend direction and Entry Levels. Mainly for Swing Trading Strategies. Usually one would open a Position in trend direction for Wave 3 or a Correction for Wave C . This Indicator draws Target Levels for the current and next wave. Most important Rules for Elliot Wave Analysis are verified by the Indicator.  The Pro version analyzes Multiple Timeframes and shows the Subwaves and Target-Levels.   For an Overview  " Elliot Waves Anal
VIP Buy Sell Signals
Hapu Arachchilage Tharindu Lakmal
Contact me through this email aaddress to download the FREE strategy PDF for this indicator tharindu999lakmal@gmail.com Introduction   The   "Buy Sell Signals"   is designed to provide BUY and SELL trade signals based on the current market conditions.   A   Trading Strategy   (Chee sheet)  has been  provided for this trading indicator.   (Read the description). This indicator has time tuned e ntry signals . so,   you will enter the market at the very best price level   with this indicator .  
VTrende Pro
Andrii Diachenko
5 (1)
VTrende Pro - MTF indicator for trend trading with a display panel for MT5 *** Videos can be translated into any language using subtitles (video language - Russian) Although the signals of the VTrende Pro indicator can be used as signals of a full-fledged trading system, it is recommended to use them in conjunction with the Bill Williams TS. VTrende Pro is an extended version of the VTrende indicator. Difference between Pro version and VTrende: - Time zones - Signal V - signal 1-2 waves -    S
IVISTscalp5
Vadym Zhukovskyi
5 (6)
Nous vous présentons l'indicateur iVISTscalp5, qui est non seulement unique, mais également efficace dans les opérations de trading. Cet indicateur est basé sur des données temporelles et est le résultat de nombreuses années d'expérience et d'analyse approfondie des marchés financiers. L'indicateur iVISTscalp5 est un excellent outil pour le trading manuel. La commodité, la simplicité et la visualisation - toute la complexité est cachée à l'intérieur. Nous avons simplifié au maximum les paramètre
Vice Trend Analyzer
Joseph Njuguna Njeri
Présentation de l'Indicateur Sniper de Tendance pour MetaTrader 5 (MT5) Atteignez des points d’entrée précis et maximisez vos profits avec notre indicateur avancé Améliorez votre trading avec l' Indicateur Sniper de Tendance , un outil avancé conçu pour les traders recherchant précision et profondeur d’analyse. Cet indicateur puissant utilise des algorithmes mathématiques uniques pour identifier les tendances les plus fortes du marché, vous offrant des points d’entrée ultra précis pour capter le
EXCLUSIVE! JUST  10 COPIES  AVAILABLE!   BONUS AUX VIP Club 2024 : Include EA CAP, CEP, LDH, PSC307 & AO4C to enhance the performance of this tool to its maximum potential  Click Here to Download Files   ( for users only ) FREE Trading Education Available Daily via Zoom --- For More Info or Instant Message Click link ---  https://t.me/abcdwave Transform your trading with the "Five Magic Bullets" Indicator, tailored for traders who embrace the power of Elliott Wave Chaos Theory.
PZ Day Trading MT5
PZ TRADING SLU
2.83 (6)
Effortless trading: non-repainting indicator for accurate price reversals This indicator detects price reversals in a zig-zag fashion, using only price action analysis and a donchian channel. It has been specifically designed for short-term trading, without repainting or backpainting at all. It is a fantastic tool for shrewd traders aiming to increase the timing of their operations. [ Installation Guide | Update Guide | Troubleshooting | FAQ | All Products ] Amazingly easy to trade It provides
Weis Wave with Alert MT5
Trade The Volume Waves Single Member P.C.
4.94 (16)
Rental/Lifetime Package Options and Privileges  Rent Monthly Six Months   Yearly/Lifetime Weis Wave with Speed with Alert+Speed Index x x x Manual  x x x Quick Set up Video x x x Blog x x x Lifetime Updates x x x Setup and Training Material x x Discord Access Channel "The SI traders"          x Rectangle Break Alert Tool      x How to trade with it:    http://www.tradethevolumewaves.com   ** If you purchase please contact me to setup your  : Two hour  webinar and  training Room and  complet
PTS - Divergence Buy Finder par Precision Trading Systems Le Precision Divergence Finder a été conçu pour trouver les points bas du marché avec une précision extrême, et il le fait fréquemment. En analyse technique, l'art de choisir les creux est généralement beaucoup plus facile que de choisir les sommets, et cet outil est précisément conçu pour cette tâche. Après avoir identifié une divergence haussière, il est sage d'attendre que la tendance s'inverse avant d'acheter. Vous pouvez utiliser
Seconds Charts
Aleksandr Goryachev
Micro  ******************* Секундные графики MT5 ********************** Более точного инструмента для входа в сделку вы не найдёте. Входные параметры: Timeframe, sek - период построения графика, секунды Displayed bars - отображаемые бары Step of price levels, pp, 0-off - шаг отрисовки ценовых уровней, пункты Scale points per bar, 0-off - масштаб в пунктах на бар Show lines - отображение текущих уровней Show comment - отображение комментария Standard color scheme - стандартная цветовая сх
DESCRIPTION ICSM (Impulse-Correction SCOB Mapper) est l'indicateur qui analyse le mouvement des prix et identifie les impulsions valides, les corrections et les SCOB (Single Candle Order Block). C'est un outil puissant qui peut être utilisé avec tout type d'analyse technique car il est flexible, informatif, facile à utiliser et améliore considérablement la conscience du trader des zones d'intérêt les plus liquides. PARAMÈTRES Général | Visuels Thème de couleur — définit le thème de couleur
Welcome to the world of SMC (Smart Money Concepts) Trading, where we empower traders with the tools and knowledge to make smarter trading decisions. Our latest addition to our suite of trading tools is the SMC Trading Pro indicator, version 1.0. Key Features: Major Market Structure Identification with BODY break. Order Block must be in Major Swing ( not Small Swing ). Order Block with Fair Value Gap Detection. Order Block in Discount | Premium zone. Filter for only Bullish, Bearish or All Order
Présentation de l'indicateur astronomique pour   MT4 / MT5 : Votre compagnon de trading céleste ultime Êtes-vous prêt à élever votre expérience de trading à des hauteurs célestes ? Ne cherchez pas plus loin que notre indicateur astronomique révolutionnaire pour MT4. Cet outil innovant transcende les indicateurs de trading traditionnels en exploitant des algorithmes complexes pour vous fournir des aperçus astronomiques inégalés et des calculs de précision. Un univers d'informations à portée de ma
Hurst Cycles Diamonds Description This indicator is an alternative version inspired by the pioneering work of David Hickson and the Hurst Cycles Notes indicator developed by Grafton. The main objective is to provide a clear and intuitive view of the Hurst cycles. Credits Original Concept : David Hickson - Hurst Cycles Theory Inspiration : Grafton - Hurst Diamond Notation Pivots Alternative Version : Fillipe dos Santos Main Features Identifies and displays pivots in multiple time cycles Visual t
WanaScalper
Isaac Wanasolo
1 (1)
A scalping indicator based on mathematical patterns, which on average gives signals with relatively small SL, and also occasionally helps to catch big moves in the markets (more information in the video) This indicator has three main types of notifications: The first type warns of a possible/upcoming signal on the next bar The second type indicates the presence of a ready signal to enter the market/open a position The third type is for SL and TP levels - you will be notified every time price re
AriBot
Arman Belassarov
AriMax   – AI-Powered Trading Robot AriMax is a cutting-edge AI-powered trading robot designed to help traders maximize profits while minimizing risk. Utilizing advanced machine learning algorithms and real-time market analysis, AriMax identifies high-probability trade opportunities with precision and speed. Key Features:     AI-Driven Market Analysis   – Analyzes market trends and patterns to make data-driven trading decisions.     Automated Execution   – Places trades seamlessly with optimiz
Plus de l'auteur
AI Channel
Thalles Nascimento De Carvalho
4.2 (5)
Welcome to the presentation of the AI Channel indicator, a powerful tool that uses artificial intelligence for price channel analysis in the financial market. In this session, we will explore how this revolutionary indicator can assist investors and traders in making more informed and strategic decisions. Let's get started! I. What is the AI Channel indicator? AI Channel is an indicator developed based on advanced artificial intelligence algorithms. It utilizes historical price data of financial
FREE
Imbalance DOM Pro
Thalles Nascimento De Carvalho
5 (1)
Imbalance DOM Pro : Optimisez vos trades avec l'imbalance du carnet d'ordres AVEZ-VOUS ACCÈS AU CARNET D'ORDRES SUR MT5 ? SOUHAITEZ-VOUS ÉLEVER VOTRE TRADING À UN NIVEAU SUPÉRIEUR ? Si vous êtes un trader qui utilise le flux d'ordres pour prendre des décisions, Imbalance DOM Pro peut révolutionner votre analyse. Parfait pour les scalpers et les traders à court terme, cet outil identifie les déséquilibres dans le carnet d'ordres et vous offre des opportunités de trading précieuses pour des e
Big Player Range
Thalles Nascimento De Carvalho
5 (3)
Découvrez le Pouvoir du "BigPlayerRange" : Votre Allié dans l'Analyse Technique du Marché Nous vous présentons BigPlayerRange, un outil d'analyse technique avancée conçu pour révéler les zones d'intérêt des institutions financières sur le marché. Avec cet outil, vous pourrez identifier précisément où les grands acteurs sont activement engagés et comment cela peut influencer vos stratégies de trading. Caractéristiques Principales : Cartographie des Zones d'Intérêt Institutionnel : BigPlay
VWAP FanMaster
Thalles Nascimento De Carvalho
VWAP FanMaster : Maîtrisez la stratégie de pullback avec précision ! VWAP FanMaster est l'indicateur ultime pour les traders à la recherche de points d'entrée précis et de pullbacks efficaces . Il combine la puissance de VWAP (Prix Moyen Pondéré par le Volume) et des lignes Fibonacci Fan , offrant une carte claire des zones d'intérêt du marché. Caractéristiques principales Simple mais puissant : Déplacez simplement les lignes verticales et l'indicateur trace automatiquement VWAP et les
FREE
Box Weis Wave
Thalles Nascimento De Carvalho
5 (1)
Élevez votre analyse avec le Weis Wave Box ! Si vous recherchez précision et clarté dans vos négociations, le Weis Wave Box est l'outil qu'il vous faut. Cet indicateur avancé offre une analyse visuelle détaillée des vagues de volume et des points de swing, vous aidant à mieux comprendre la relation entre effort et résultats sur le marché. Principales caractéristiques du Weis Wave Box : Vagues de Volume Personnalisables : Ajustez les vagues de volume en ticks pour les adapter à vos straté
Book Data Binance
Thalles Nascimento De Carvalho
Book Data Binance! Avez-vous déjà imaginé avoir accès au carnet de commandes de votre cryptomonnaie préférée, avec des détails sur les prix, les volumes et l'analyse des déséquilibres, même si votre plateforme d'échange ne propose pas d'accès au DOM ? Avec Book Data Binance, cela devient réalité ! Ce script en MQL5 a été spécialement développé pour les traders de cryptomonnaies qui cherchent à approfondir leur compréhension des dynamiques du marché. Caractéristiques principales :
FREE
Cumulative Volume Bands
Thalles Nascimento De Carvalho
CVB Cumulative Volume Bands : Optimisez vos opérations avec le volume cumulé ! CVB Cumulative Volume Bands est un indicateur avancé conçu pour les traders qui recherchent des signaux précis basés sur le volume cumulé. En utilisant des bandes de volume cumulé, cet indicateur fournit des lectures claires des pressions d'achat et de vente sur le marché, aidant ainsi à identifier les retournements et les mouvements de prix importants. Cumulative Volume Bands for MT5 ! Caractéristique
FREE
Volume Flow Binance
Thalles Nascimento De Carvalho
Volume Flow Binance! Avez-vous déjà imaginé avoir accès aux times and trades de votre cryptomonnaie préférée, avec des détails sur les flux de volumes et l'analyse des mouvements de prix, même si votre courtier ne fournit pas un accès complet à l'historique des transactions ? Avec Volume Flow Binance , c'est désormais possible ! Ce script en MQL5 a été conçu pour les traders de cryptomonnaies qui recherchent une vue détaillée de la dynamique du marché en temps réel. Caractéristiqu
FREE
Swing Point Volume
Thalles Nascimento De Carvalho
Swing Point Volume, the indicator that signals weakness and strength at the tops and bottoms. This indicador can be for used the Wyckoff Method. Information provided; - Swing on customized ticks. - Volume and points in each balance sheet. - Percentage of Displacement. - Sound alert option on top and bottom breaks. - Volume in ticks and Real Volume. - Volume HL (extreme) or (opening and closing) - Customized volume shapes.
Flow Bookmap
Thalles Nascimento De Carvalho
Flow Bookmap : Visualisez le Flux du Marché et Protégez vos Trades ️ VOUS VOULEZ DOMINER LE MARCHÉ AVEC DES INFORMATIONS PRÉCISES SUR LES ACHETEURS ET LES VENDEURS ? Flow Bookmap est l'outil ultime pour les traders qui souhaitent comprendre en profondeur le comportement du marché. Il transforme les données du flux d'ordres en une interface intuitive sur le graphique MT5, mettant en évidence les zones d'intérêt critiques pour prendre des décisions rapides et sécurisées. Comment ça fonct
Atr Projection
Thalles Nascimento De Carvalho
L'indicateur ATR Projeção se distingue comme un outil robuste dans l'analyse technique, conçu pour fournir des informations précises sur les limites potentielles des mouvements de prix sur les marchés financiers. Son approche flexible permet aux utilisateurs de personnaliser de manière intuitive les métriques d'analyse, en s'adaptant aux besoins spécifiques de chaque actif négocié. Fonctionnement personnalisable : Par défaut, l'ATR Projeção fonctionne en considérant 30 % de la moyenne des 100
Long Short Pro
Thalles Nascimento De Carvalho
Indicateur Long & Short - Version Pro : Déverrouillez le Potentiel Illimité de Votre Analyse de Marché ! Aucune Limite pour Tous les Actifs La version Pro de l’indicateur Long & Short vous offre une liberté totale pour l’utiliser sur tout actif financier. Plus de limitations – appliquez le même indicateur à tous vos actifs préférés ! Sans Limites Profitez de toutes les fonctionnalités de l’indicateur sans aucune restriction. La version Pro vous offre une expérience complète et illim
Didi Index Volume
Thalles Nascimento De Carvalho
Nous vous présentons le Didi Index Volume, un indicateur d'analyse technique développé par le trader brésilien Odir Aguiar, qui se distingue par son approche avancée et puissante dans l'identification des opportunités sur les marchés financiers. Disponible sur différentes plateformes, le Didi Index Volume est devenu un outil essentiel pour les traders à la recherche d'informations précises et précieuses pour leurs stratégies de trading. Cet indicateur combine le célèbre Didi Index, créé par Odi
TimeChannel
Thalles Nascimento De Carvalho
The "Timechannel" is a powerful technical analysis tool designed specifically for traders who want to gain deeper and more accurate insights into price movements across multiple timeframes (multi-timeframe). This indicator is an essential addition to the toolbox of any serious trader seeking to make informed and data-driven trading decisions. Key Features: Advanced Multi-Timeframe Analysis : Timechannel allows traders to analyze price movements on different timeframes simultaneously. This is cr
Master OBV
Thalles Nascimento De Carvalho
MasterOBV : Maîtrisez les Tendances du Marché avec Précision ! MasterOBV est un indicateur d'analyse technique qui combine volume , correlation positive et une Moyenne Mobile (MA) pour affiner l'identification des tendances sur les marchés financiers. Fonctionnalités Principales : Volume Intelligent : Analyse le volume des transactions pour identifier les changements significatifs dans la force de la tendance. Correlation Positive : Intègre des actifs corrélés pour obtenir une vue pl
VolaMetrics VSA
Thalles Nascimento De Carvalho
VolaMetrics VSA | Un Puissant Allié dans l'Analyse Technique Le VolaMetrics VSA est un indicateur d'analyse technique qui combine la méthode Volume Spread Analysis (VSA) avec une analyse détaillée du volume des transactions . Conçu pour identifier et suivre les mouvements significatifs des prix , le VolaMetrics VSA utilise l'interaction entre volume et écart de prix pour fournir des insights précieux qui peuvent aider à prendre des décisions de trading. Les Fondements de la Volume Spread Anal
SwingVolumePro
Thalles Nascimento De Carvalho
Vue d'ensemble SwingVolumePro est un indicateur avancé et polyvalent, conçu pour être utilisé sur une large gamme d'actifs financiers et pour supporter différents styles de trading. Basé sur une analyse rigoureuse du volume et du prix, il fournit des signaux clairs et précis permettant aux traders de tous niveaux de prendre des décisions éclairées basées sur des données de haute qualité. SwingVolumePro.PDF Principales caractéristiques Polyvalence: SwingVolumePro peut être appliqué à d
CVD SmoothFlow Pro
Thalles Nascimento De Carvalho
CVD SmoothFlow Pro - Analyse de Volume Illimitée pour Tout Actif ! CVD SmoothFlow Pro est la solution ultime pour les traders recherchant une analyse de volume précise et illimitée. En utilisant le calcul du Cumulative Volume Delta (CVD) avec un filtrage avancé du bruit, la version Pro offre la flexibilité et la précision nécessaires pour trader tout actif financier. Que propose CVD SmoothFlow Pro ? Analyse Claire : Filtre le bruit du marché et met en avant les mouvements de volume signifi
Cumulative Vol Bands
Thalles Nascimento De Carvalho
CVB Cumulative Volume Bands : Optimisez vos opérations avec le volume cumulé ! CVB Cumulative Volume Bands est un indicateur avancé conçu pour les traders qui recherchent des signaux précis basés sur le volume cumulé. En utilisant des bandes de volume cumulé, cet indicateur fournit des lectures claires des pressions d'achat et de vente sur le marché, aidant ainsi à identifier les retournements et les mouvements de prix importants. Caractéristiques principales : Analyse du volume c
ZigWave Oscillator
Thalles Nascimento De Carvalho
ZigWave Oscillator : Optimisez vos transactions avec des oscillateurs et ZigZag ! Le ZigWave Oscillator est l'outil parfait pour les traders recherchant précision et clarté dans l'analyse du marché financier. Cet indicateur combine la puissance des oscillateurs avec la simplicité visuelle du ZigZag, vous aidant à identifier rapidement et efficacement les meilleures opportunités d'achat et de vente. Pourquoi choisir le ZigWave Oscillator ? Analyse précise des oscillateurs : Intégrez RS
Imbalance DOM Crypto
Thalles Nascimento De Carvalho
Imbalance DOM Crypto : Optimisez vos opérations avec le déséquilibre du carnet d'ordres en cryptomonnaies Opportunités dans les petits mouvements de prix Imbalance DOM Crypto est un outil essentiel pour les analystes qui opèrent sur le flux d'ordres en cryptomonnaies. Parfait pour les scalpers, il a été développé pour ceux qui cherchent à tirer parti des petites oscillations de prix avec une grande précision. Grâce à un calcul avancé, l'indicateur identifie les déséquilibres dans le car
Times and Sales Crypto
Thalles Nascimento De Carvalho
Times and Sales Crypto : Boostez vos opérations avec Times and Sales en cryptomonnaies Exploitez les petits mouvements de prix avec précision Times and Sales Crypto est un outil indispensable pour les traders qui opèrent avec le flux des ordres dans les cryptomonnaies. Parfait pour les scalpers, il est conçu pour ceux qui souhaitent profiter des petites fluctuations de prix avec une grande précision. Grâce à des calculs avancés, l'indicateur utilise les données de times and sales pour f
FlowVol AllinOne
Thalles Nascimento De Carvalho
FlowVol All-in-One : Analyse complète du flux avec DOM, VSA et Times and Sales PRÊT À ÉLEVER VOTRE ANALYSE DE FLUX DE COMMANDES SUR MT5 ? FlowVol All-in-One est l'outil ultime pour les traders de flux de commandes, combinant les trois principales techniques d'analyse de volume (DOM, VSA et Times and Sales) en un seul indicateur puissant. Il est essentiel d'avoir accès au carnet d'ordres de votre courtier pour exploiter pleinement le potentiel de cet outil de flux. Idéal pour les scalpers et
Filtrer:
epadilha
709
epadilha 2024.10.31 14:46 
 

L'utilisateur n'a laissé aucun commentaire sur la note

Thalles Nascimento De Carvalho
7480
Réponse du développeur Thalles Nascimento De Carvalho 2024.10.31 15:01
Obrigado!🙏
Répondre à l'avis
Version 2.1 2024.10.24
Ajuste na eficiência do código