Channel Range Medvedev
- Indicateurs
- Valeriy Medvedev
- Version: 1.6
- Mise à jour: 24 mars 2020
- Activations: 5
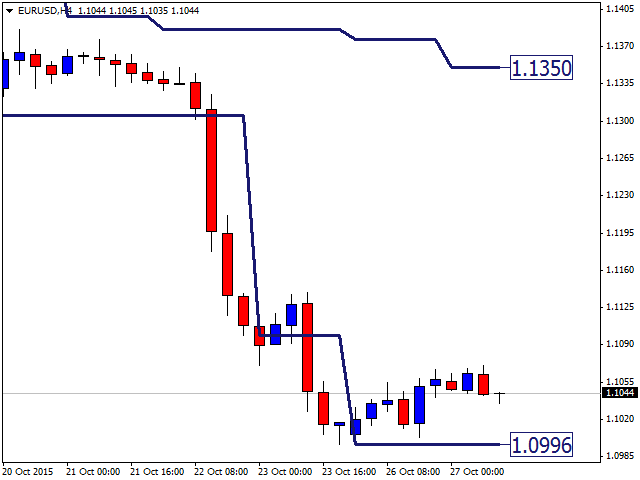
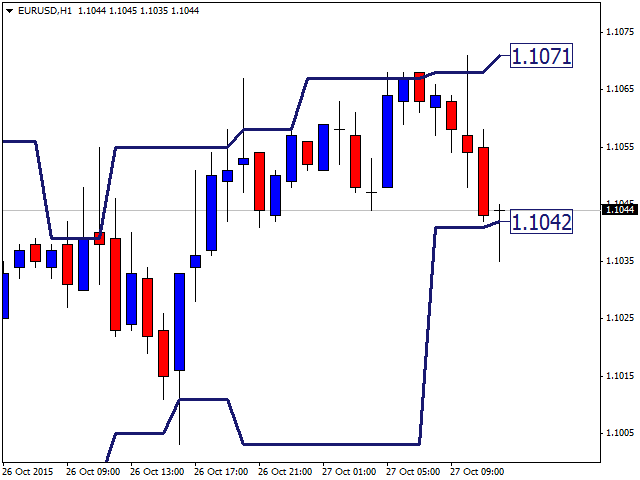
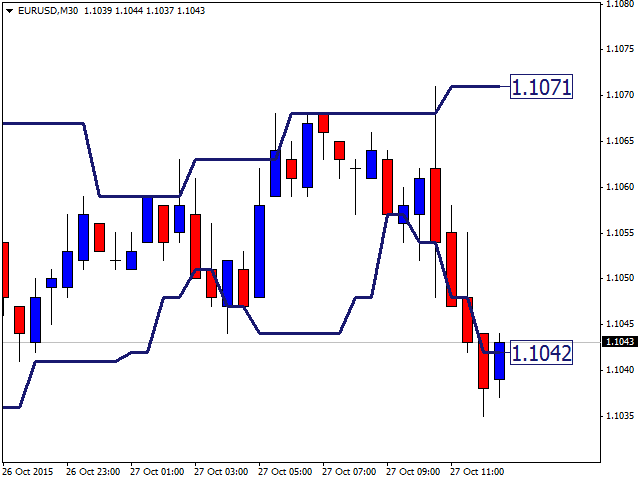
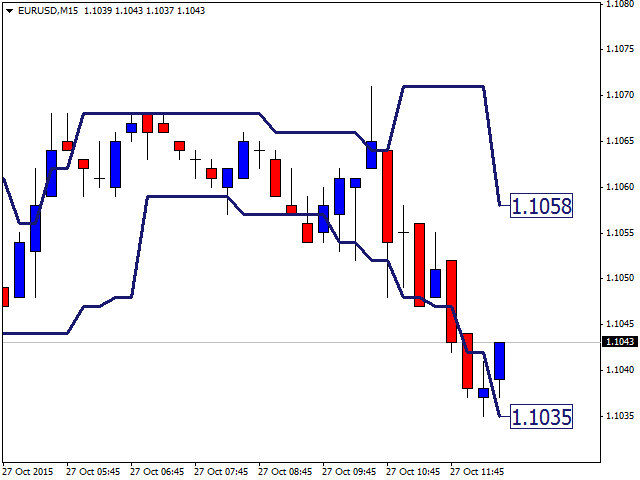
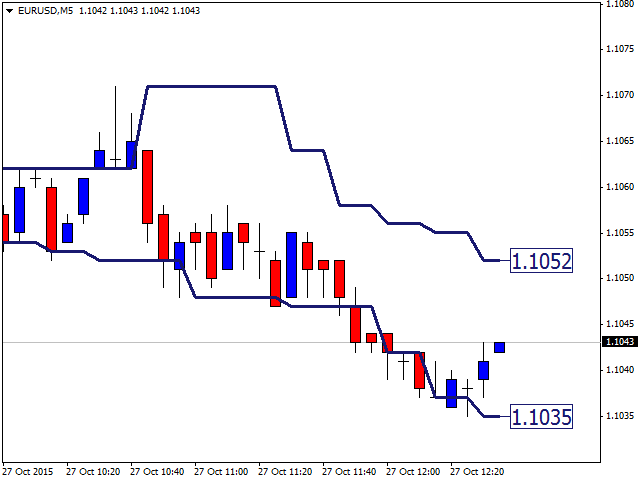
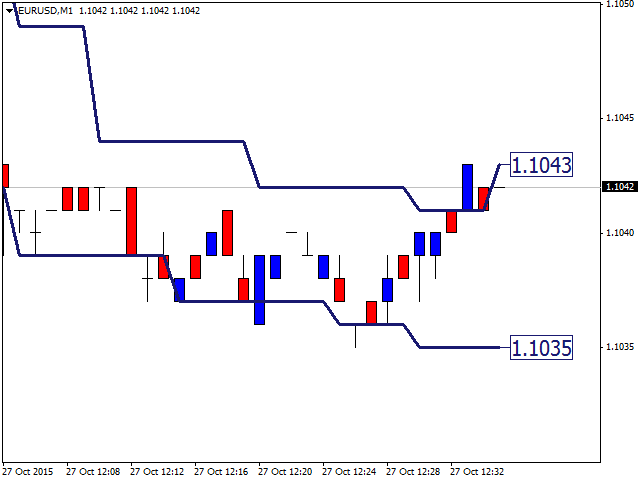
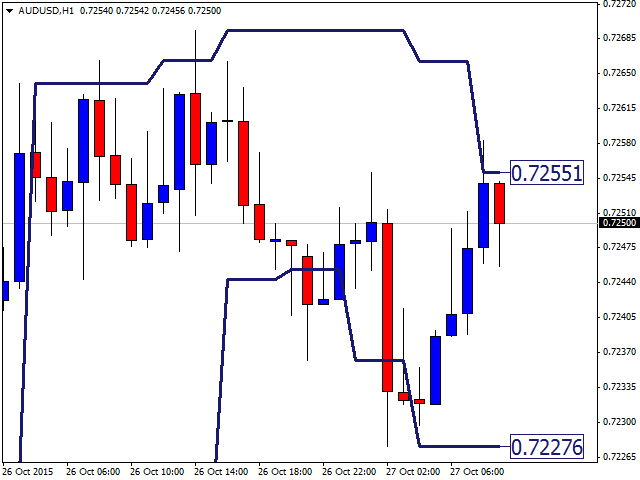
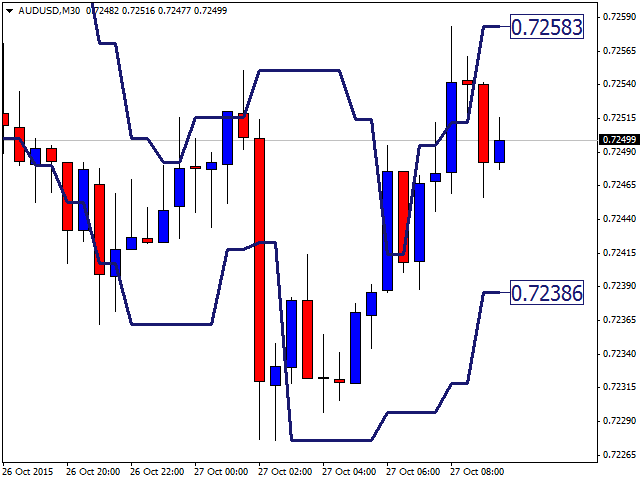
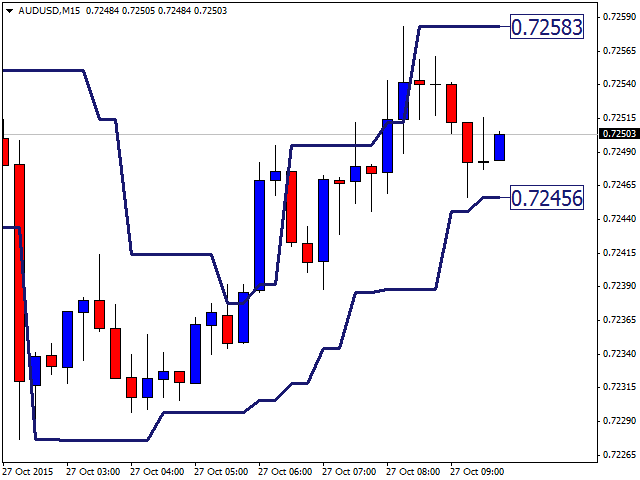
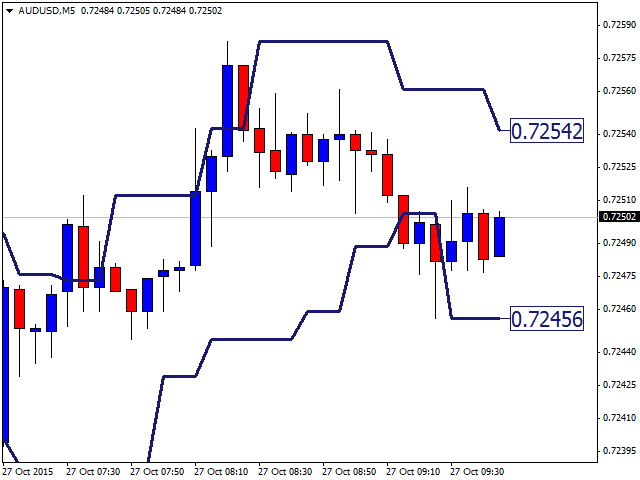
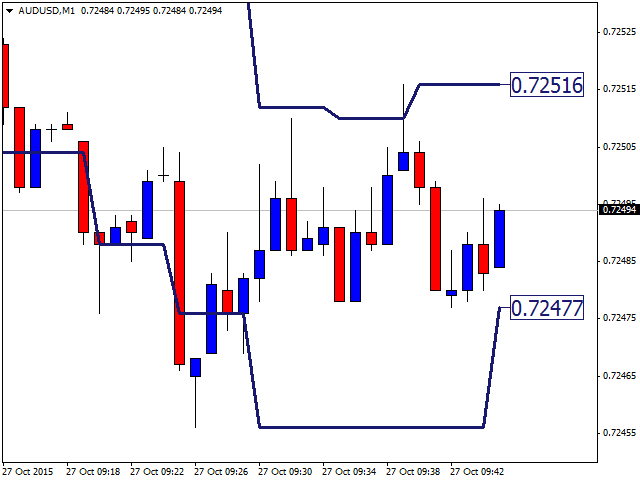
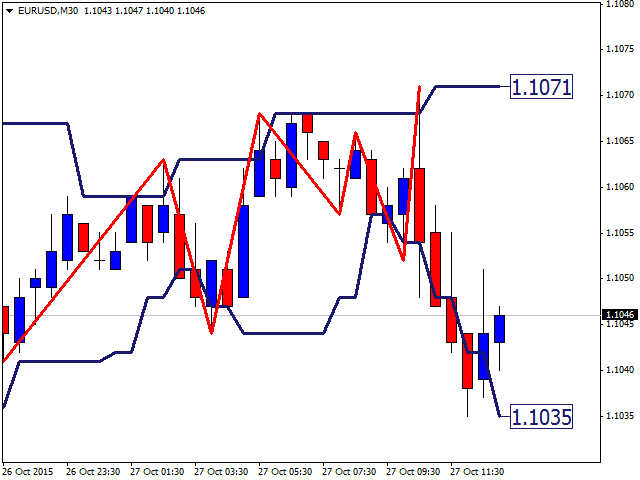
The idea of the indicator stems from the necessity to clearly define the borders of support and resistance levels, which helps to plan the opening and closing of positions in the areas that most appropriately determine the process. Look at the breakdowns of the resistance level that confirm the intention of the price to continue the upward movement, after it passed the support level and entered the channel formed by the two levels. The same is for the case when the price enters the channel downwards and then hits the support level and continues to move to the next phase of the price movement. This indicator perfectly suits for combined use with a zigzag, like this one: https://www.mql5.com/en/market/product/12330. All you need to do is to configure the indicator display when you run it on the desired timeframe.
Indicator Parameters
- color_channel — the color of the support and resistance levels;
- with_channel — the line width, can take a value 1 to 5, default is 2.
Constructive suggestions and feedback are highly appreciated.

