Double SMA Indicator
- Indicateurs
- Cedric Jean Guy Pisson
- Version: 1.0
- Activations: 5
Cet algorithme est un indicateur personnalisé pour MetaTrader 5 (MT5), qui trace deux moyennes mobiles simples (SMA) sur un graphique financier, afin d'aider à l'analyse technique des mouvements de prix. Voici les principaux points sur ce que fait cet algorithme :
- Deux Moyennes Mobiles Simples (SMA) :
- L'indicateur utilise deux périodes de SMA différentes :
- Une première période (SMA1) plus longue, définie par défaut à 8 périodes (SMA 8).
- Une deuxième période (SMA2) plus courte, définie par défaut à 3 périodes (SMA 3).
- L'indicateur utilise deux périodes de SMA différentes :
- Calcul des Moyennes Mobiles :
- Pour chaque période définie, il calcule la moyenne des prix de clôture des bougies précédentes sur un certain nombre de périodes.
- Par exemple, pour la SMA8, l'algorithme additionne les prix de clôture des 8 dernières bougies et divise la somme par 8 pour obtenir la valeur de la moyenne mobile.
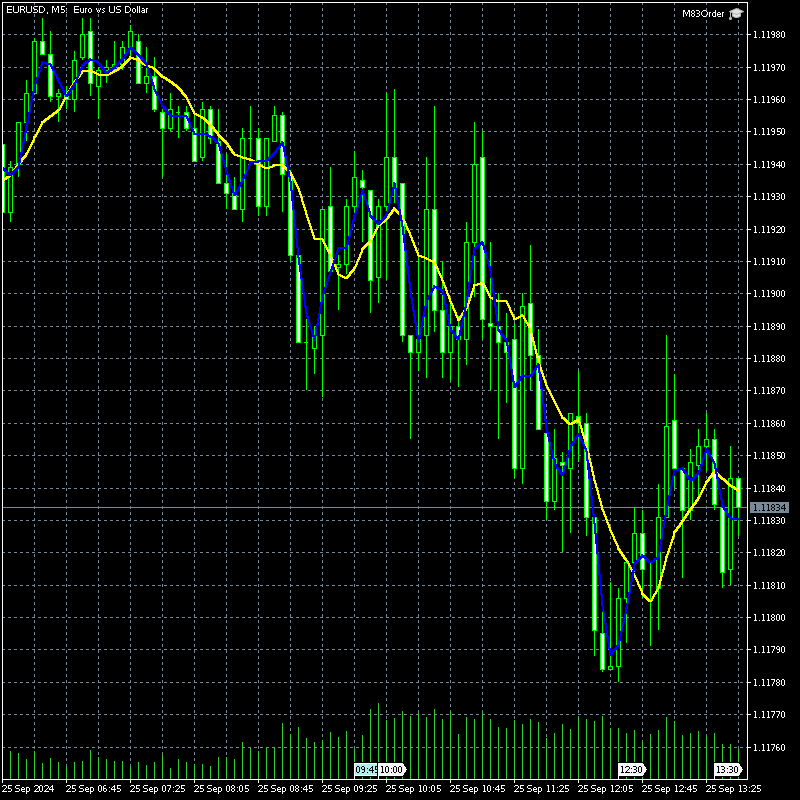
- Affichage Visuel :
- Il trace deux lignes sur le graphique :
- Une ligne bleue pour la SMA8 (période plus longue).
- Une ligne rouge pour la SMA3 (période plus courte).
- Les lignes ont une épaisseur de 2 pixels pour une meilleure visibilité.
- Il trace deux lignes sur le graphique :
- Objectif de l'Indicateur :
- Cet indicateur permet aux traders de visualiser les tendances des prix à court et moyen terme en comparant les deux moyennes mobiles. Lorsque la ligne rouge (SMA3) croise la ligne bleue (SMA8), cela peut être interprété comme un signal de trading :
- Un croisement à la hausse de la ligne rouge au-dessus de la bleue peut indiquer un signal d'achat.
- Un croisement à la baisse peut indiquer un signal de vente.
- Cet indicateur permet aux traders de visualiser les tendances des prix à court et moyen terme en comparant les deux moyennes mobiles. Lorsque la ligne rouge (SMA3) croise la ligne bleue (SMA8), cela peut être interprété comme un signal de trading :
En résumé :
Cet algorithme est un indicateur de double SMA utilisé pour identifier des tendances ou des signaux de trading à partir de croisements de moyennes mobiles simples de différentes périodes (8 et 3).