• Aperçu
  • Avis
  • Commentaires

PathFinder Zones

For support, visit cc.inni.cc where you will also find our Knowledge library and FAQ.

PATHFINDER ZONES

is a powerful yet intuitive tool designed to highlight key Support and Resistance zones. This indicator helps traders identify potential turning points in the market by mapping out untested, proven, or broken price zones. Whether you're a day trader or long-term investor, Pathfinder Zones is a valuable addition to your strategy, bringing simplicity and clarity to your analysis.

PathFinder Zones is free for now, we decided to share it with you while we are still finshing the GUI design and some nip and tuck.
The price for 1 year rental will be 39USD like for PathFinder Trend, but if you start using it now, it will still be your free copy until the 12 months are up 🙂

📌 Key Features

Support and Resistance Zone Detection

  • Detects and displays support and resistance zones with various levels of strength.
  • Automatically differentiates between untested, verified, and broken zones for easy reference.

Flexible Zone Types

  • Customizable zone parameters, allowing you to show or hide weak, untested, and broken (turncoat) zones based on your preference.
  • Fractal-based calculations for faster and slower zone formation, ensuring zones adjust dynamically to price action.

Interactive Zone Management

  • Zones can be merged and extended to adapt to market behavior, preventing clutter and offering a cleaner charting experience.
  • Supports the identification of nearest zones to current price, providing immediate visual cues for potential entries and exits.

🧩 Core Components

Zone Identification and Management:

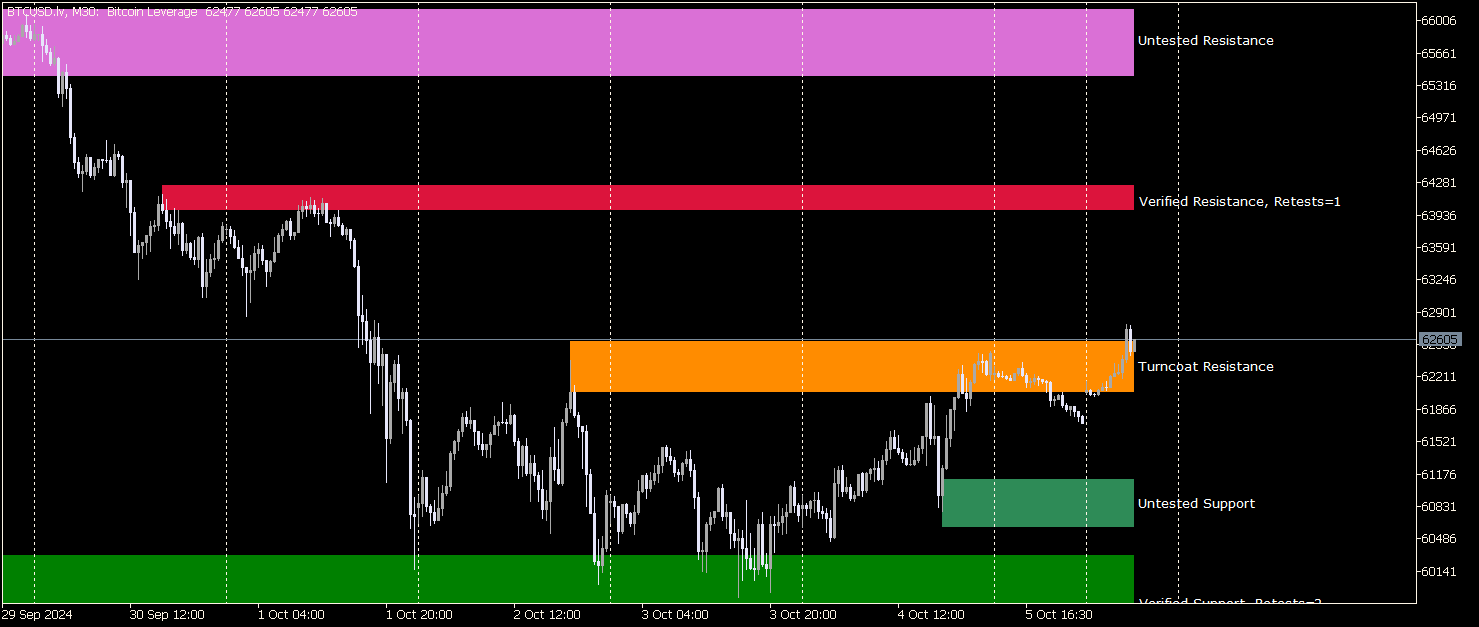
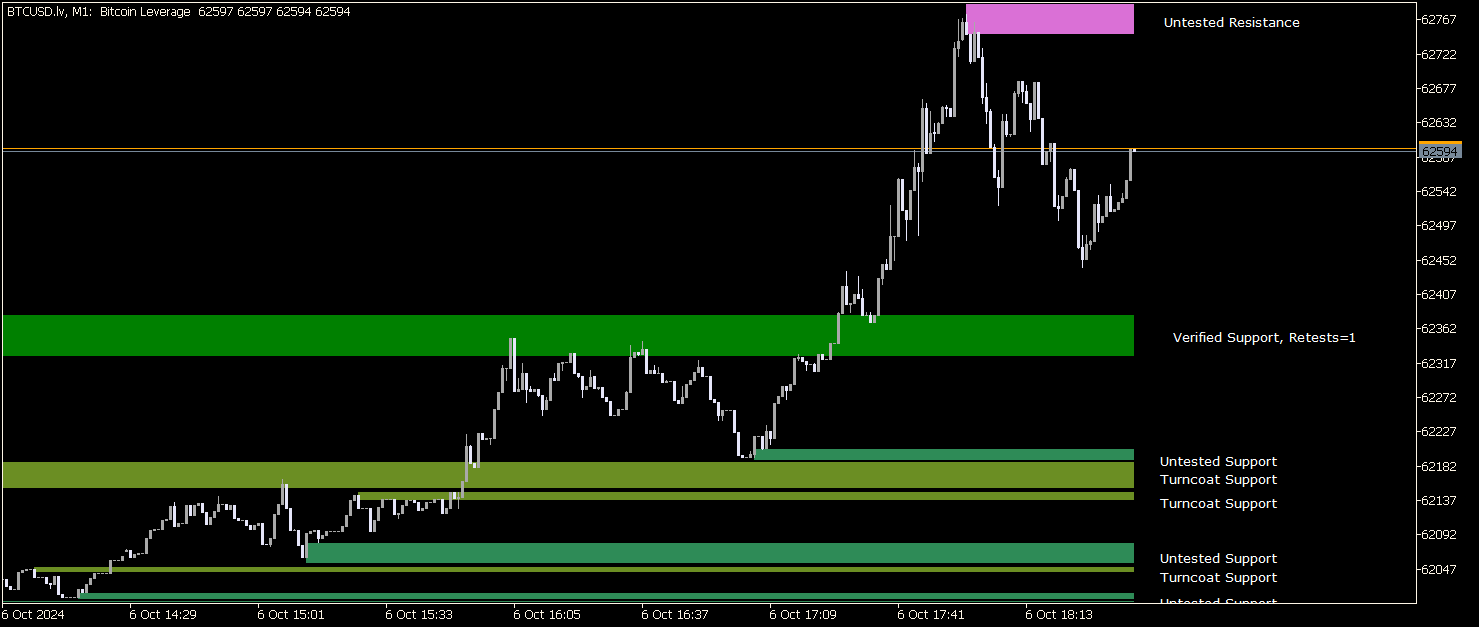
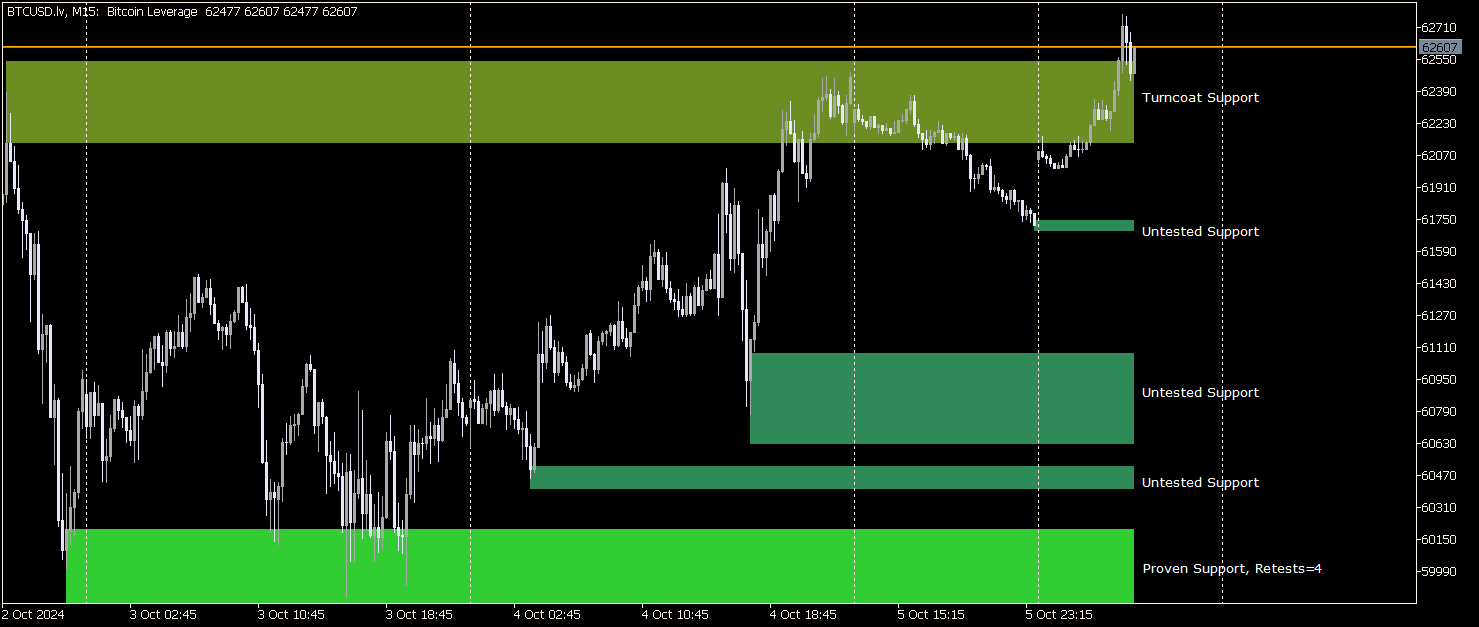
  • Pathfinder Zones identifies BUY (support) and SELL (resistance) zones, labeling them by their strength: weak, untested, verified, or proven.
  • Zones are color-coded for quick recognition, with options to merge or extend zones based on market conditions.
  • Integrated alerts notify users when the price enters a key zone, ensuring you're always aware of important market movements.

Fractal & ATR-based Detection:

  • Utilizes fast and slow fractal methods along with ATR-based fuzz factor to detect accurate support and resistance levels.
  • The fuzz factor allows for flexibility by incorporating volatility into zone boundaries, ensuring zones stay relevant even in volatile conditions.

Alerts & Notifications:

  • The indicator includes customizable alert settings that trigger notifications when price interacts with a zone.
  • Alerts can be configured for pop-ups, sounds, or even push notifications to keep you informed whether you're at your desk or away.

Visual Aids & Customization:

  • Zones are drawn with customizable color schemes and line styles, giving you full control over their appearance.
  • Information labels on zones, such as the strength and number of retests, are available for quick reference and can be toggled on or off based on your preference.

Performance Optimization:

  • Manages large amounts of data efficiently, with support for multi-timeframe analysis. Ensures smooth operation even on high bar counts by dynamically resizing buffers and optimizing calculations.
  • Customizable back-limit parameter to control how many historical bars are included in the analysis.


Produits recommandés
The indicator detects and displays М. Gartley's Butterfly pattern. The pattern is plotted by the extreme values of the ZigZag indicator (included in the resources, no need to install). After detecting the pattern, the indicator notifies of that by the pop-up window, a mobile notification and an email. The pattern and wave parameters are displayed on the screenshots. The default parameters are used for demonstration purposes only in order to increase the amount of detected patterns. Parameters
Ekom Spike Detector Navigate the volatile world of Boom and Crash indices with the Ekom Boom and Crash Spike Detector Indicator. This powerful tool detects explosive price movements, providing traders with accurate buy and sell signals 24/7. Key Features: - Accurate Spike Detection : Identify high-probability spike patterns in real-time - Clear Visual Signals : Displays clear buy and sell arrows on the chart for easy decision-making - Customizable : Easily switch from either Boom or Crash
FREE
This indicator uses the chart information and your inputs to display a calculated lot size and associated stop for long or short positions. It uses an ATR based percent volatility position sizing calculation and splits your account equity into two parts, each having its own risk percentage. The concept behind "Market's Money" is using a lower risk percentage for your base account equity and then using a higher risk percentage for any equity above your base equity. This lets you potentially grow
FREE
ZigZag Profile
Nguyen Thanh Cong
Introducing the ZigZag Profile — a powerful tool designed to identify high-probability pivot zones where price action frequently reverses. This indicator analyzes historical price data to pinpoint key areas where price has pivoted multiple times, providing traders with actionable insights into potential support and resistance levels. The ZigZal Profile  indicator continuously scans for zones where price has reversed direction the most, highlighting these critical areas on your chart. By focusing
FREE
Aussenstab
Rainer Schnoege
5 (1)
The outside bar indicator shows a range of inside bars and the breakout up and down from the range. The breakout is always displayed at the start of a new range and is extended until another breakout. The calculation always takes place at the start of a new candle. So it is displayed accordingly in all time frames. In inside bar (  insidebar ) trading you can see the top and bottom of a range. In outside bar (  outsidebar ) trading, the breakout from a range and thus the trend following. The c
FREE
SpreadMeter OGT Free
Dmitriy Gurenko
5 (1)
The indicator shows the current spread of the symbol, the minimum, average and maximum values for the current bar in the form of digital, analog and graphic indicators. Has two modes of operation: fixing the system spread, or calculating the spread as the difference between the "Bid" and "Ask" prices on each incoming tick. Parameters  The indicator has a single input parameter: Type of calculation  - type of spread calculation. It can take the following values:  System spread  - the spread value
FREE
Basic Theme Builder MT5
Mehran Sepah Mansoor
5 (1)
Basic Theme Builder : Simplifiez la personnalisation de vos graphiques Transformez votre expérience de trading avec l'indicateur Basic Theme Builder , un outil polyvalent conçu pour simplifier la personnalisation de l'apparence de vos graphiques sur MetaTrader 5. Cet indicateur intuitif offre un panneau facile à utiliser qui vous permet de passer d'un thème à l'autre et de changer les schémas de couleurs en toute simplicité, améliorant ainsi l'apparence visuelle et la fonctionnalité de votre en
FREE
The Analytical cover trend indicator is a revolutionary trend trading and filtering solution with all the important features of a trend tool built into one tool! The Analytical cover indicator is good for any trader, suitable for any trader for both forex and binary options. You don’t need to configure anything, everything is perfected by time and experience, it works great during a flat and in a trend. The Analytical cover trend indicator is a tool for technical analysis of financial markets
WaSpread MT5
Wachinou Lionnel Pyrrhus Sovi Guidi
L'indicateur WaSpread MT5 montre le spread en pips avec les couleurs. Avec cet indicateur, vous pouvez: * Configurer le seuil de spread avec les couleurs pour identifier quand le spread dépasse le seuil. * Configurer les axes X et Y tout en choisissant les angles et le point d'ancrage pour afficher le spread. * Ecrire la police et la taille de la police pour plus de confort. * Activer l'alerte si le spread dépasse le seuil de spread défini. * Pour plus de précision, vous pouvez aussi choisir mo
FREE
Important Lines
Terence Gronowski
4.86 (21)
This indicator displays Pivot-Lines, preday high and low, preday close and the minimum and maximum of the previous hour. You just have to put this single indicator to the chart to have all these important lines, no need to setup many single indicators. Why certain lines are important Preday high and low : These are watched by traders who trade in a daily chart. Very often, if price climbs over or falls under a preday low/high there is an acceleration in buying/selling. It is a breakout out of
FREE
Fair Value gap Sweep
Crispin Tibilla
5 (1)
Fair Value Gap Sweep is a unique and powerful indicator that draws fair value gaps on your chart and alerts you when a gap has been swept by the price. A fair value gap is a price gap that occurs when the market opens at a different level than the previous close, creating an imbalance between buyers and sellers. A gap sweep is when the price moves back to fill the gap, indicating a change in market sentiment and a potential trading opportunity. Fair Value Gap Sweep indicator has the following
FREE
IQuantum
Evgeniy Scherbina
The indicator IQuantum shows trading signals for 10 symbols in the daily chart: AUDCAD, AUDUSD, EURUSD, GBPCAD, GBPCHF, GBPUSD, NZDUSD, USDCAD, USDCHF, and USDJPY. Signals of the indicator are produced by 2 neural models which were trained independently from one another. The inputs for the neural models are normalised prices of the symbols, as well as prices of Gold, Silver and markers of the current day. Each neural model was trained in 2 ways. The Ultimate mode is an overfitted neural mo
FREE
Indicator details The Moving Average Retracement Boundaries(M.A.R.B) shows the average retracement level above or below the given moving average.It shows the first upper boundary (which is the average retracement above the moving average ),the second upper boundary (which is double the first upper boundary),the first lower boundary (which is the average retracement below the moving average) and the second lower boundary (which is double the first lower boundary). How to use it 1.It can be used
FREE
Indicateur Heiken Ashi MT5 Améliorez votre analyse de marché avec l'indicateur Heiken Ashi MT5. Cet outil puissant transforme les données de prix standard en bougies plus lisses et orientées tendance, facilitant ainsi l'identification des tendances du marché et des points de retournement potentiels. Principales caractéristiques: Identification claire des tendances: Distinguez visuellement les tendances haussières et baissières grâce à différentes couleurs de bougies. Réduction du bruit: Filtrez
FREE
Vip Gold
Ignacio Agustin Mene Franco
VIP Gold It has the last indicator of the session Gold of the 4! It works in all temporalities. It is an indicator where it marks blocks of structures. the rebounds are on the red line up, and the green line down depending on which pair you use it, It is made for synthetic indices, crash and boom pairs It works as support and resistance also to better find the floor and ceiling of each pair.
Laguerre Filter
Fernando Lahude Ritter
Laguerre Indicator with Gamma Input Overview: The Laguerre Indicator is a sophisticated financial analysis tool designed to provide traders and investors with a dynamic and responsive method to track market trends. Its core functionality is centered around a unique algorithm that adapts to market volatility, offering clearer insights compared to traditional indicators. Key Feature - Gamma Input: Gamma: The sole input for the Laguerre Indicator, 'gamma,' plays a pivotal role in calibrating the i
FREE
What is this indicator? This indicator is the Stochastic Oscillator supporting Virtual Trading mode of   Knots Compositor . When the mode is turned on, the indicator will be recalculated based on the displayed candlesticks. When the mode is turned off, the indicator will be recalculated based on the original chart candlesticks. KC-Indicators -   KC-MA   (Moving Average) -   KC-ENV   (Envelopes) -   KC-BB   (Bollinger Bands) -   KC-ADX   (Average Directional Movement Index) -   KC-MACD   (Mo
FREE
FVG Indicator
Daniel Moises Pimentel Flores
This indicator identifies and highlights market inefficiencies, known as Fair Value Gaps (FVG), on price charts. Using a custom algorithm, the indicator detects these areas of imbalance where the price moves sharply, creating potential trading opportunities. Indicator Parameters: Bullish FVG Color (clrBlue) : Color used to highlight bullish inefficiencies. The default value is blue. Bearish FVG Color (clrRed) : Color used to highlight bearish inefficiencies. The default value is red. Bullish FVG
FREE
ACI Bollinger Bands
Marat Sultanov
4 (3)
Tired of adjusting the indicator settings losing precious time? Tired of the uncertainty regarding their efficiency? Afraid of the uncertainty in their profitability? Then the indicator ACI (automatically calibrateable indicator) is designed exactly for you. Launching it, you can easily solve these three issues just performing the simplest action: clicking a single Calibrate button. To achieve the highest efficiency, you should perform another additional action: move the power slider to the maxi
FREE
Advanced Trend Builder is a trend indicator using the original calculation algorithm. ATB can be used on any data and timeframe. My recommendation use for calculation numbers 4 - 16 - 64 - 256 and so on ..., but this is only recommendation. The middle of the trend wave is a special place where market behavior is different, when developed ATB was main idea to find the middle of the wave trend. Input parameters: Bars will be used for calculation - number of bars used for a trend line calculation.
FREE
What is this indicator? This indicator is the RSI (Relative Strength Index) supporting Virtual Trading mode of  Knots Compositor . When the mode is turned on, the indicator will be recalculated based on the displayed candlesticks. When the mode is turned off, the indicator will be recalculated based on the original chart candlesticks. Types of the applied price - Close - Open - High - Low - Median Price (HL/2) - Typical Price (HLC/3) - Weighted Price (HLCC/4) KC-Indicators -   KC-MA   (M
FREE
Show Pips for MT5
Roman Podpora
4.63 (19)
Cet indicateur d'information sera utile pour ceux qui veulent toujours être au courant de la situation actuelle du compte. -   Des indicateurs plus utiles L'indicateur affiche des données telles que le profit en points, en pourcentage et en devise, ainsi que le spread pour la paire actuelle et le temps jusqu'à la fermeture de la barre sur la période actuelle. Il existe plusieurs options pour placer la ligne d'information sur le graphique : À droite du prix (passe derrière le prix) ; En commen
FREE
The indicator identifies when a divergence occurs between price and an indicator or oscillator. It identifies both regular and hidden divergences. Combined with your own rules and techniques, this indicator will allow you to create (or enhance) your own powerful system. Features Can detect divergences for the following oscillators/indicators:   MACD, OsMA, Stochastics, RSI, CCI, RVI, Awesome, ADX, ATR, OBV, Composite index, MFI and Momentum. Only one oscillator/indicator can be selected. Draws
FREE
Show Pip Value and Spread on Chart as Object or Comment. User can select to display Pip Value and/or Spread by object on main Chart, or show both only as Comment lines on chart. Object Color, Font face and Size  and also which corner to show, may change by user.  Pip Value calculated in accordance of input Lot size , Default is 1 lot . Can use at all currency pairs , Gold , Silver and most other charts.
FREE
Multi-timeframe trend indicator based on the ADX / ADXWilder indicator with Fibonacci levels The indicator shows trend areas using ADX or ADXWilder indicator data from multiple timeframes. The impulse mode of the indicator allows you to catch the beginning of a trend, and several "Screens" with different timeframes allow you to filter out market noise. Fibonacci levels are added to the price chart, which have flexible settings. How the indicator works: if PDI is greater than NDI, then   it`
FREE
What is this indicator? This indicator is the MACD (Moving Average Convergence/Divergence) supporting Virtual Trading mode of  Knots Compositor . When the mode is turned on, the indicator will be recalculated based on the displayed candlesticks. When the mode is turned off, the indicator will be recalculated based on the original chart candlesticks. Types of the applied price - Close - Open - High - Low - Median Price (HL/2) - Typical Price (HLC/3) - Weighted Price (HLCC/4) KC-Indicators
FREE
TradeQL
Abdiel Aviles Jimenez
The TradeQL Indicator is a customizable tool that highlights specific trading patterns on candlestick charts. Users can define patterns through TradeQL queries, which the indicator then applies to the chart, visually representing matches and captured groups. Ideal for identifying complex trade setups in real-time. TradeQL queries are specified using the TradeQL Language. See https://github.com/abdielou/tradeql for more details. This language is expressed as a regular expression. The language a
FREE
Notre indicateur   Basic Candlestick Patterns   rend l'identification des principaux modèles de chandeliers plus facile que jamais. Découvrez des figures telles que le marteau, l'étoile du soir, les trois soldats blancs et bien d'autres encore en jetant un simple coup d'œil à votre graphique. Avec une interface intuitive et des indices visuels clairs, notre indicateur vous aide à identifier les opportunités de trading rapidement et avec précision /   Version MT4 Dashboard Scanner pour cet ind
FREE
The Martinware Closing Time Alarm indicator serves to warn traders that the current period (bar, candle) is about to end. Input parameters: Time offset: with how many seconds before the ending of the current period the alarm must trigger Alert with sound: informs if the alert should include playing a sound Sound selection: a list of sounds available Custom sound: name of the custom sound file to be used in case "custom sound" was selected. It must be inside a folder named "Sounds", this o
FREE
Ind5 InfoPad Information Panel
Vladislav Andruschenko
4.88 (8)
INFOPad est un panneau d'information qui crée des informations sur la paire de devises sélectionnée dans le terminal MetaTrader 5. Il y a 5 fonctions de cet indicateur : Affiche les informations principales et principales sur le symbole sélectionné : Ask BID, Spread, Stop Level, Swap, Tick value, Commissions ; Affiche les objectifs futurs de la cible SL et de la cible TP (le nombre de points du stop loss et du take profit établis, le montant en dollars); Il montre le bénéfice reçu pour les péri
FREE
Les acheteurs de ce produit ont également acheté
TPSpro RFI Levels MT5
Roman Podpora
4.73 (11)
INSTRUCTIONS       RUS   -   ANGLAIS       Il   est recommandé de l'utiliser avec un indicateur       -       TPSpro   TENDANCE PRO -   Version MT4         Un élément clé du trading est constitué par les zones ou les niveaux à partir desquels les décisions d'achat ou de vente d'un instrument de trading sont prises. Malgré les tentatives des principaux acteurs de dissimuler leur présence sur le marché, ils laissent inévitablement des traces. Notre tâche était d'apprendre à identifier ces traces
TPSproTREND PrO MT5
Roman Podpora
4.89 (9)
TPSpro TREND PRO  - is a trend indicator that automatically analyzes the market and provides information about the trend and each of its changes, as well as giving signals for entering trades without redrawing! The indicator uses each candle, analyzing them separately. referring to different impulses - up or down impulse. Exact entry points into transactions for currencies, crypto, metals, stocks, indices!  Version MT4               DETAILED DESCRIPTION               R ecommended to use with an
Tout d'abord, il convient de souligner que ce système de trading est un indicateur non repeint, non redessiné et non retardé, ce qui le rend idéal pour le trading manuel et automatisé. Cours en ligne, manuel et téléchargement de préréglages. Le "Système de Trading Smart Trend MT5" est une solution de trading complète conçue pour les traders débutants et expérimentés. Il combine plus de 10 indicateurs premium et propose plus de 7 stratégies de trading robustes, ce qui en fait un choix polyvalent
Atbot
Zaha Feiz
4.91 (35)
AtBot : Comment ça fonctionne et comment l'utiliser ### Comment ça fonctionne L'indicateur "AtBot" pour la plateforme MT5 génère des signaux d'achat et de vente en utilisant une combinaison d'outils d'analyse technique. Il intègre la Moyenne Mobile Simple (SMA), la Moyenne Mobile Exponentielle (EMA) et l'indice de la Plage Vraie Moyenne (ATR) pour identifier les opportunités de trading. De plus, il peut utiliser des bougies Heikin Ashi pour améliorer la précision des signaux. Laissez un avis ap
Atomic Analyst MT5
Issam Kassas
4.42 (19)
Tout d'abord, il convient de souligner que cet indicateur de trading n'est ni repainting, ni redrawing et ne présente aucun délai, ce qui le rend idéal à la fois pour le trading manuel et automatisé. Manuel de l'utilisateur : réglages, entrées et stratégie. L'Analyste Atomique est un indicateur d'action sur les prix PA qui utilise la force et le momentum du prix pour trouver un meilleur avantage sur le marché. Équipé de filtres avancés qui aident à éliminer les bruits et les faux signaux, et à
FX Power MT5 NG
Daniel Stein
5 (5)
Obtenez votre mise à jour quotidienne du marché avec des détails et des captures d'écran via notre Morning Briefing ici sur mql5 et sur Telegram ! FX Power MT5 NG est la nouvelle génération de notre très populaire indicateur de force des devises, FX Power. Et qu'est-ce que ce compteur de force de nouvelle génération offre ? Tout ce que vous avez aimé de l'original FX Power PLUS Analyse de la force de l'OR/XAU Des résultats de calcul encore plus précis Périodes d'analyse configurables individuel
Trend Screener Pro MT5
STE S.S.COMPANY
4.87 (63)
Indicateur de tendance, solution unique révolutionnaire pour le trading et le filtrage des tendances avec toutes les fonctionnalités de tendance importantes intégrées dans un seul outil ! Il s'agit d'un indicateur multi-période et multi-devises 100 % non repeint qui peut être utilisé sur tous les symboles/instruments : forex, matières premières, crypto-monnaies, indices et actions. Trend Screener est un indicateur de suivi de tendance efficace qui fournit des signaux de tendance fléchés avec des
Gold Stuff mt5
Vasiliy Strukov
4.92 (167)
Gold Stuff mt5 est un indicateur de tendance conçu spécifiquement pour l'or et peut également être utilisé sur n'importe quel instrument financier. L'indicateur ne se redessine pas et ne traîne pas. Délai recommandé H1. Contactez-moi immédiatement après l'achat pour obtenir les réglages et un bonus personnel !   Vous pouvez obtenir une copie gratuite de notre indicateur Strong Support et Trend Scanner, veuillez envoyer un message privé. moi!   RÉGLAGES Dessiner la flèche - on off. dessine
PZ Swing Trading MT5
PZ TRADING SLU
5 (4)
Protect against whipsaws: revolutionize your swing trading approach Special Offer: Purchase now to receive free bonuses worth $135! (Read more for details) Swing Trading is the first indicator designed to detect swings in the direction of the trend and possible reversal swings. It uses the baseline swing trading approach, widely described in trading literature. The indicator studies several price and time vectors to track the aggregate trend direction and detects situations in which the market i
Quantum Trend Sniper
Bogdan Ion Puscasu
4.8 (49)
Présentation       Quantum Trend Sniper Indicator   , l'indicateur révolutionnaire MQL5 qui transforme la façon dont vous identifiez et négociez les inversions de tendance ! Développé par une équipe de traders expérimentés avec une expérience commerciale de plus de 13 ans,       Indicateur Quantum Trend Sniper       est conçu pour propulser votre parcours de trading vers de nouveaux sommets grâce à sa manière innovante d'identifier les inversions de tendance avec une précision extrêmement élevée
Blahtech Supply Demand MT5
Blahtech Limited
4.54 (13)
Was: $299  Now: $99   Supply Demand uses previous price action to identify potential imbalances between buyers and sellers. The key is to identify the better odds zones, not just the untouched ones. Blahtech Supply Demand indicator delivers functionality previously unavailable on any trading platform. This 4-in-1 indicator not only highlights the higher probability zones using a multi-criteria strength engine, but also combines it with multi-timeframe trend analysis, previously confirmed swings
Maintenant 147 $ (augmentant à 499 $ après quelques mises à jour) - Comptes illimités (PCS ou Mac) Manuel d'utilisation RelicusRoad + Vidéos de formation + Accès au groupe Discord privé + Statut VIP UNE NOUVELLE FAÇON DE REGARDER LE MARCHÉ RelicusRoad est l'indicateur de trading le plus puissant au monde pour le forex, les contrats à terme, les crypto-monnaies, les actions et les indices, offrant aux traders toutes les informations et tous les outils dont ils ont besoin pour rester renta
Ce tableau de bord affiche les derniers   modèles harmoniques   disponibles pour les symboles sélectionnés, ce qui vous permettra de gagner du temps et d'être plus efficace /   version MT4 . Indicateur gratuit:   Basic Harmonic Pattern Colonnes de l'indicateur Symbol :   les symboles sélectionnés apparaissent Trend   :   haussière ou baissière Pattern :   type de motif (gartley, papillon, chauve-souris, crabe, requin, cypher ou ABCD) Entry:   prix d'entrée SL:   prix du stop loss TP1:   1
FxaccurateLS
Shiv Raj Kumawat
WHY IS OUR FXACCCURATE LS MT5 THE PROFITABLE ? PROTECT YOUR CAPITAL WITH RISK MANAGEMENT Gives entry, stop and target levels from time to time. It finds Trading opportunities by analyzing what the price is doing during established trends. POWERFUL INDICATOR FOR A RELIABLE STRATEGIES We have made these indicators with a lot of years of hard work. It is made at a very advanced level. Established trends provide dozens of trading opportunities, but most trend indicators completely ignore them!
Tout d'abord, il convient de souligner que cet outil de trading est un indicateur non repeint, non redessiné et non retardé, ce qui le rend idéal pour le trading professionnel. Cours en ligne, manuel utilisateur et démonstration. L'indicateur Smart Price Action Concepts est un outil très puissant à la fois pour les nouveaux et les traders expérimentés. Il regroupe plus de 20 indicateurs utiles en un seul, combinant des idées de trading avancées telles que l'analyse du trader Inner Circle et
Was: $249  Now: $99   Market Profile defines a number of day types that can help the trader to determine market behaviour. A key feature is the Value Area, representing the range of price action where 70% of trading took place. Understanding the Value Area can give traders valuable insight into market direction and establish the higher odds trade. It is an excellent addition to any system you may be using. Inspired by Jim Dalton’s book “Mind Over Markets”, this indicator is designed to suit the
Top indicator for MT5   providing accurate signals to enter a trade without repainting! It can be applied to any financial assets:   forex, cryptocurrencies, metals, stocks, indices .  Watch  the video  (6:22) with an example of processing only one signal that paid off the indicator! MT4 version is here It will provide pretty accurate trading signals and tell you when it's best to open a trade and close it. Most traders improve their trading results during the first trading week with the help of
Gartley Hunter Multi
Siarhei Vashchylka
5 (8)
Gartley Hunter Multi - An indicator for searching for harmonic patterns simultaneously on dozens of trading instruments and on all possible timeframes. Manual (Be sure to read before purchasing) | Version for MT4 Advantages 1. Patterns: Gartley, Butterfly, Shark, Crab. Bat, Alternate Bat, Deep Crab, Cypher 2. Simultaneous search for patterns on dozens of trading instruments and on all possible timeframes 3. Search for patterns of all possible sizes. From the smallest to the largest 4. A
Fxaccurate TCT
Shiv Raj Kumawat
WHY IS OUR FXACCCURATE TCT MT5 THE PROFITABLE ? Gives entry, stop and target levels from time to time. It finds Trading opportunities by analyzing what the price is doing during established trends. We have made these indicators with a lot of years of hard work. It is made at a very advanced level. Established trends provide dozens of trading opportunities, but most trend indicators completely ignore them! The trend reveals trading indicator represents an average of 10 different trades per trend
** All Symbols x All Timeframes scan just by pressing scanner button ** *** Contact me  to send you instruction and add you in "123 scanner group" for sharing or seeing experiences with other users. After 17 years of experience in the markets and programming, Winner indicator is ready. I would like to share with you! Introduction The 123 Pattern Scanner indicator with a special enhanced algorithm is a very repetitive common pattern finder with a high success rate . Interestingly, this Winner in
ATrend
Zaha Feiz
4.8 (5)
ATREND ATREND : Comment ça fonctionne et comment l'utiliser Comment ça fonctionne L'indicateur "ATREND" pour la plateforme MT5 est conçu pour fournir aux traders des signaux d'achat et de vente robustes en utilisant une combinaison de méthodologies d'analyse technique. Cet indicateur s'appuie principalement sur la plage vraie moyenne (ATR) pour mesurer la volatilité, ainsi que sur des algorithmes de détection de tendance pour identifier les mouvements potentiels du marché. Laissez un message ap
FX Volume MT5
Daniel Stein
4.93 (14)
Obtenez votre mise à jour quotidienne du marché avec des détails et des captures d'écran via notre Morning Briefing ici sur mql5 et sur Telegram ! FX Volume est le PREMIER et SEUL indicateur de volume qui fournit un VRAI aperçu du sentiment du marché du point de vue d'un courtier. Il fournit des informations impressionnantes sur la façon dont les acteurs institutionnels du marché, comme les courtiers, sont positionnés sur le marché des changes, bien plus rapidement que les rapports COT. Voir c
Présentation       Quantum Breakout PRO   , l'indicateur révolutionnaire MQL5 qui transforme la façon dont vous négociez les zones d'évasion ! Développé par une équipe de traders expérimentés avec une expérience commerciale de plus de 13 ans,       Évasion quantique PRO       est conçu pour propulser votre parcours commercial vers de nouveaux sommets grâce à sa stratégie de zone de discussion innovante et dynamique. Quantum Breakout Indicator vous donnera des flèches de signalisation sur le
Advanced Supply Demand MT5
Bernhard Schweigert
4.5 (14)
La meilleure solution pour tout commerçant débutant ou expert ! Cet indicateur est un outil de trading unique, de haute qualité et abordable car nous avons intégré un certain nombre de fonctionnalités propriétaires et une nouvelle formule. Avec cette mise à jour, vous pourrez afficher des zones à double horaire. Vous pourrez non seulement afficher un TF plus élevé, mais afficher les deux, le graphique TF, PLUS le TF supérieur : AFFICHAGE DES ZONES NICHÉES. Tous les traders Supply Demand vont ado
Black Dragon indicator mt5
Ramil Minniakhmetov
4.81 (54)
L'indicateur de détection de tendance complétera n'importe quelle stratégie et peut également être utilisé comme un outil indépendant. IMPORTANT! Contactez-moi immédiatement après l'achat pour obtenir des instructions et un bonus !   Avantages Facile à utiliser; ne surcharge pas le graphique avec des informations inutiles. La possibilité d'utiliser comme filtre pour n'importe quelle stratégie. Contient des niveaux dynamiques de cupport et de resistange, qui peuvent être utilisés à la fois
Trend Forecaster
Alexey Minkov
5 (6)
The Trend Forecaster indicator utilizes a unique proprietary algorithm to determine entry points for a breakout trading strategy. The indicator identifies price clusters, analyzes price movement near levels, and provides a signal when the price breaks through a level. The Trend Forecaster indicator is suitable for all financial assets, including currencies (Forex), metals, stocks, indices, and cryptocurrencies. You can also adjust the indicator to work on any time frames, although it is recommen
ICT, SMC, SMART MONEY CONCEPTS, SMART MONEY, Smart Money Concept, Support and Resistance, Trend Analysis, Price Action, Market Structure, Order Blocks, BOS/CHoCH,   Breaker Blocks ,  Momentum Shift,   Supply&Demand Zone/Order Blocks , Strong Imbalance,   HH/LL/HL/LH,    Fair Value Gap, FVG,  Premium  &   Discount   Zones, Fibonacci Retracement, OTE, Buy Side Liquidity, Sell Side Liquidity, BSL/SSL Taken, Equal Highs & Lows, MTF Dashboard, Multiple Time Frame, BigBar, HTF OB, HTF Market Structure
Trend Line Map Pro MT5
STE S.S.COMPANY
4.09 (11)
Trend Line Map indicator is an addons for   Trend Screener Indicator . It's working as a scanner for all signals generated by Trend screener ( Trend Line Signals ) . It's a Trend Line Scanner based on Trend Screener Indicator.  If you don't have Trend Screener Pro Indicator,   the Trend Line Map Pro will not work.     LIMITED TIME OFFER : Trend Line Map Indicator is available for only 50 $ and lifetime. ( Original price 125$ ) By accessing to our MQL5 Blog,  you can find all our premium indica
Auto Order Block with break of structure based on ICT and Smart Money Concepts (SMC) Futures Break of Structure ( BoS )             Order block ( OB )            Higher time frame Order block / Point of Interest ( POI )    shown on current chart           Fair value Gap ( FVG ) / Imbalance   -  MTF      ( Multi Time Frame )    HH/LL/HL/LH  -  MTF      ( Multi Time Frame )  Choch  MTF      ( Multi Time Frame )  Volume Imbalance     ,  MTF          vIMB Gap’s Power of 3 Equal High
FX Trend MT5
Daniel Stein
4.63 (32)
Vous voulez devenir un trader forex 5 étoiles constamment rentable ? 1.   Lisez la description de base de notre   système de   trading simple et   la mise à jour majeure de sa stratégie en 2020 2.   Envoyez une capture d'écran de votre achat pour recevoir votre invitation personnelle à notre chat de trading exclusif FX Trend   affiche la direction de la tendance, sa durée, son intensité et l'évaluation de la tendance qui en résulte pour tous les cadres temporels en temps réel. Vous verrez d'u
Plus de l'auteur
PathFinder Trend
Sveinn FRIDFINNSSON
For support, visit cc.inni.cc where you will also find our Knowledge library and FAQ. PATHFINDER TREND is a complex, yet easy to manage trend indicator. It has various features that can aid in your decision making and boost your performance accuracy. Patfhinder Trend is a visually comfortable and user friendly tool that you should keep on your trading desk. Key features Signal Detection & Trend Analysis Visually clear and decisive Early indication of signal direction with arrows Confirmed s
Filtrer:
Aucun avis
Répondre à l'avis