• Aperçu
  • Avis
  • Commentaires

MTF SuperTrend by Zen Market Flow

Zen Market Flow - MTF SuperTrend

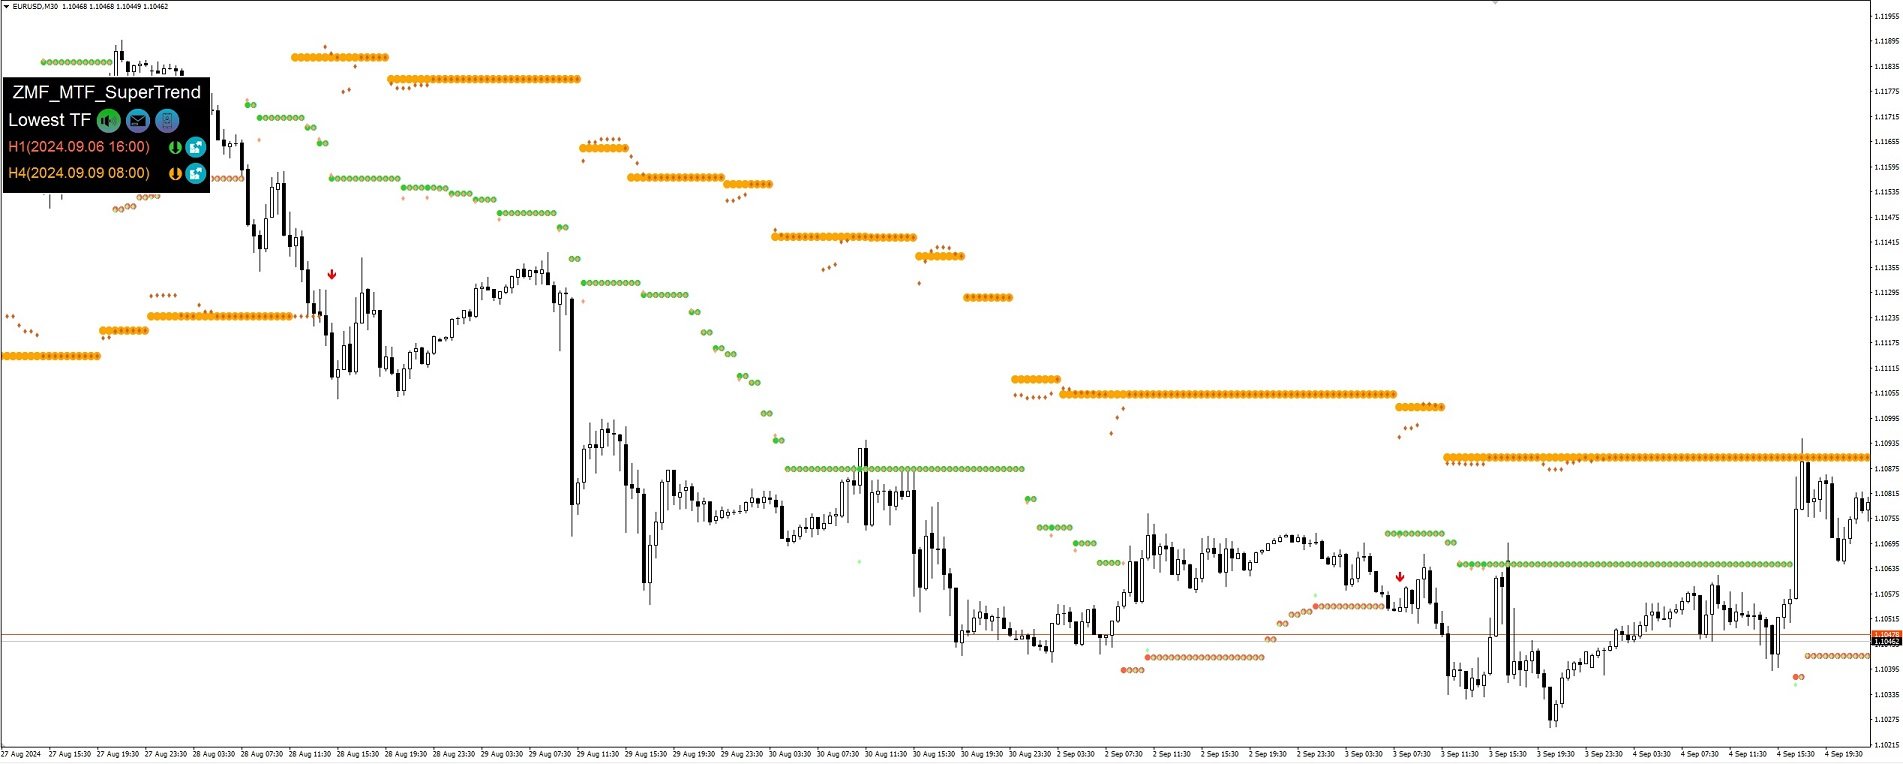
Le MTF SuperTrend est un système qui peut être utilisé sur n'importe quelle unité de temps. Cet indicateur multi-timeframe affiche les signaux de 1 à 3 unités de temps simultanément et indique leur alignement.

Si vous appréciez l'indicateur SuperTrend, vous adorerez cette version.

Vous pouvez également tester les signaux et les dessins de l'indicateur dans le backtest, où vous pouvez afficher les signaux multi-timeframes.

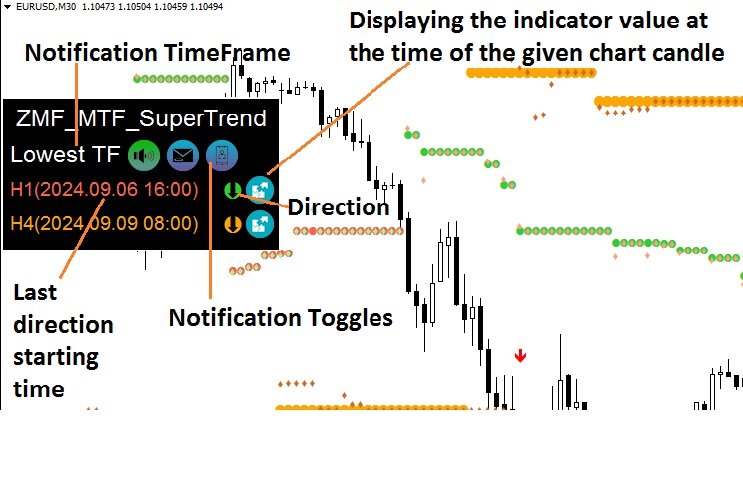
L'indicateur fournit des signaux lorsque toutes les unités de temps indiquent la même direction. Il prend des captures d'écran, affiche des fenêtres d'alerte, envoie des e-mails ou des notifications push sur votre téléphone.

Pour les unités de temps supérieures, vous avez l'option d'afficher les valeurs basées sur les bougies clôturées ou de voir comment la valeur de l'indicateur a évolué bougie après bougie.

Si vous souhaitez faire un backtest, ce n'est pas un problème non plus. L'indicateur peut simuler des bougies d'unités de temps supérieures à partir des bougies de l'unité de temps actuelle et fournir des signaux précis.

La facilité d'utilisation de l'indicateur est renforcée par un panneau d'information sur le graphique, où vous pouvez cliquer pour basculer entre les modes d'affichage et gérer l'état des différentes alertes.

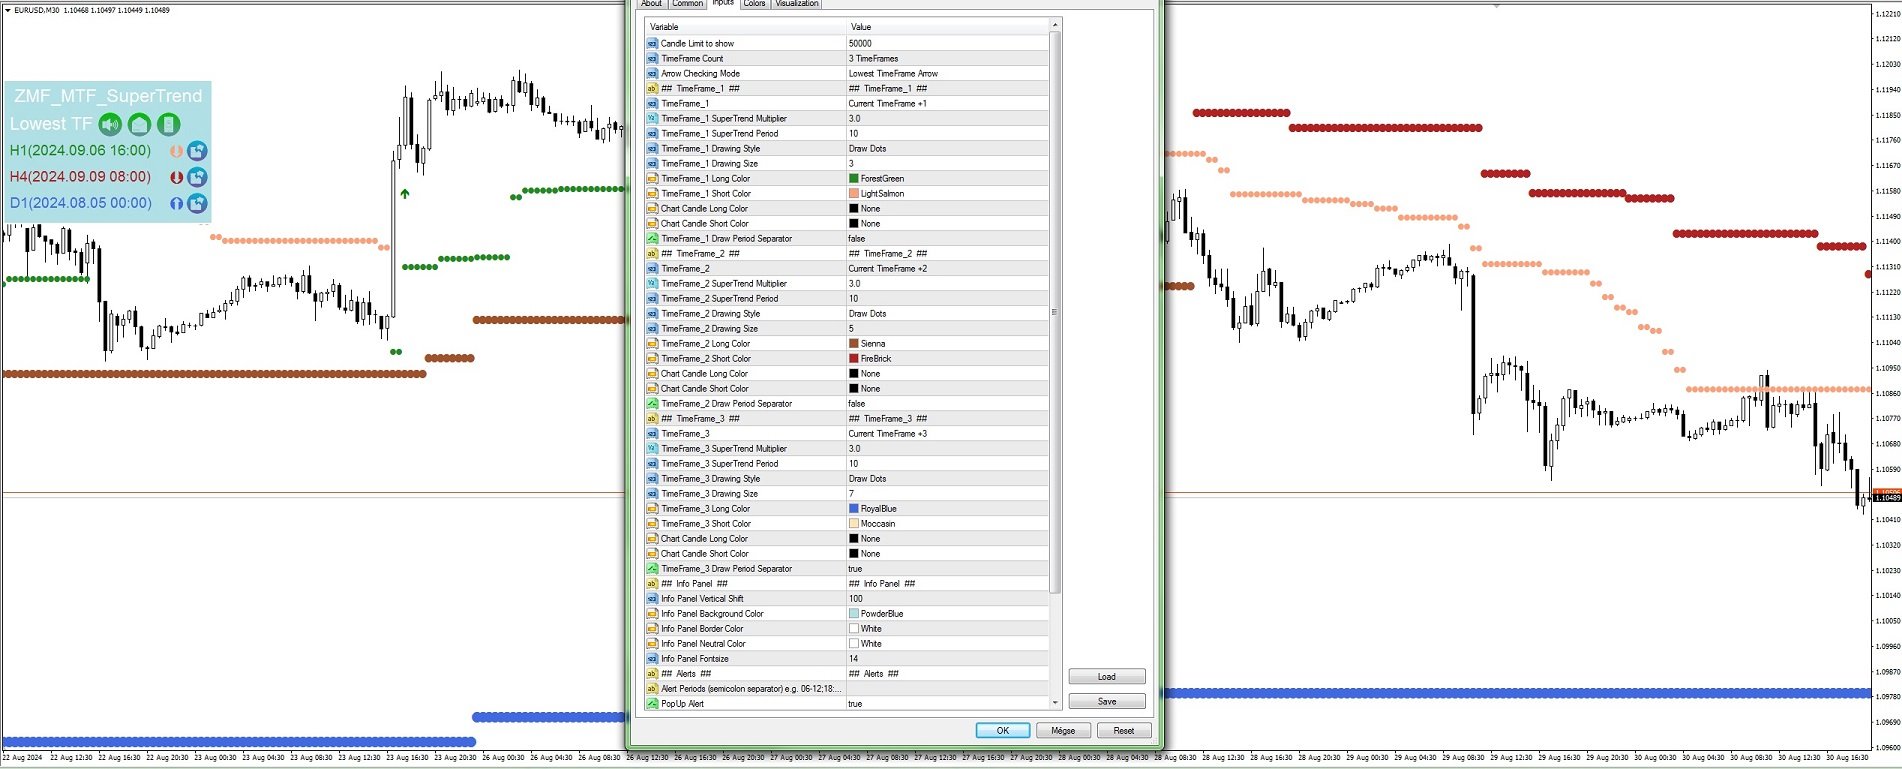
Vous avez également la possibilité de définir les unités de temps afin que, chaque fois que vous changez l'unité de temps du graphique, vous n'ayez pas besoin de saisir manuellement les périodes supérieures, car le programme les calcule automatiquement.

Pour cela, vous pouvez utiliser les options « Unité de temps actuelle +1 », « Unité de temps actuelle +2 » et « Unité de temps actuelle +3 ». (Par exemple, sur un graphique M1, « Unité de temps actuelle +1 » représente M5, « Unité de temps actuelle +2 » représente M15, et « Unité de temps actuelle +3 » représente M30.)

Paramètres importants :

- Nombre d'unités de temps : Combien d'unités de temps souhaitez-vous surveiller (1, 2, 3)
- Mode de vérification des flèches : Mode de dessin et d'alerte des flèches
- Multiplicateur SuperTrend : Multiplicateur pour le calcul du SuperTrend
- Période SuperTrend : Période pour le calcul du SuperTrend
- Style de dessin : Affichage des valeurs SuperTrend sous forme de points ou de ligne
- Périodes d'alerte : Vous pouvez contrôler quand vous souhaitez recevoir des notifications. Si le champ est vide, il n'y a pas de restriction. Le format de la restriction est : heure de début-heure de fin. Si vous souhaitez spécifier plusieurs périodes, il suffit de les séparer par des points-virgules. Par exemple : 06:00-08:30;12:00-02:15.

Mode de vérification des flèches :

- Flèches désactivées : Pas de flèche
- Flèche sur bougie de graphique : Flèches basées sur les bougies clôturées du graphique (Si vous ne surveillez que des unités de temps supérieures, l'indicateur signalera lorsque les valeurs actuelles de SuperTrend des unités de temps supérieures s'aligneront à la clôture d'une bougie du graphique, sans attendre la clôture des unités de temps supérieures.)
- Flèche sur unité de temps la plus basse : Flèches basées sur les bougies clôturées de l'unité de temps la plus basse

Si vous aimez mon indicateur, veuillez soutenir mon travail avec un commentaire ou une évaluation.
Produits recommandés
MetaCOT 2 is a set of indicators and specialized utilities for the analysis of the U.S. Commodity Futures Trading Commission reports. Thanks to the reports issued by the Commission, it is possible to analyze the size and direction of the positions of the major market participants, which brings the long-term price prediction accuracy to a new higher-quality level, inaccessible to most traders. These indicators, related to the fundamental analysis, can also be used as an effective long-term filter
SFO Trend Racer
Tevin Marshall
5 (1)
SFO Trend Racer system is a trend indicator created by the CEO and Founder of " Simple Forex Options ", Tevin Marshall . It serves 6 different functions all in one. It shows the trader the entry signals as well as exit signals, whether it is a take profit or a stop loss. It also uses trend filters and signal confirmations so that the trader is able to make the most logically fit decision. Trend Racer uses various filters and specific settings from a plethora of indicators. The beauty in this ind
Mean Reversion Probability indicator is a tool based on a mathematical theory of mean reversion . As the markets very often shows the behavior of diverging from its mean, up to a certain distance, and then start to converge its mean again. This is a very well known phenomenon in stochastic processes and the price series is also a stochastic variable so we apply certain mathematical and statistical procedures to estimate the turning point . Using Mean Reversion indicator, traders could potential
VR Cub
Vladimir Pastushak
VR Cub est un indicateur permettant d'obtenir des points d'entrée de haute qualité. L'indicateur a été développé pour faciliter les calculs mathématiques et simplifier la recherche de points d'entrée dans un poste. La stratégie de trading pour laquelle l'indicateur a été rédigé prouve son efficacité depuis de nombreuses années. La simplicité de la stratégie de trading est son grand avantage, qui permet même aux traders débutants de négocier avec succès avec elle. VR Cub calcule les points d'ouve
ADX Pointer
Dominik Mandok
ADX Pointer is an indicator which is based on "Average Directional Index" and draws three numbers in chart window depending on the value of ADX. In ADX Pointer you can set "ADX_Period" which is of course period of Average Directional Index and you can also set 3 levels. When ADX value exceed first level ("ADX_Level1") in chart window appears number "1", when ADX exceed second level ("ADX_Level2") appears "2" and when ADX exceed third level ("ADX_Level3") appears "3". Simple. ADX Pointer works on
This indicator softens the value of the RSI (Relative Strength Index) and reduces its volatility. You can use this indicator in your expert advisors, indicators and strategies. With this indicator, you don't need to have two indicators on the chart at the same time. For example, an RSI indicator and a Moving Average indicator If you have any questions or concerns, contact me.
FREE
Indicator for determining the trend. The arrows and lines on the chart show the price reversal and the probable current trend or correction. You should always trade in the direction of the arrow. It is best to use the indicator on several time frames at once and enter the market when all time frames have the same arrow. For example, we open a sell trade if there is a red arrow on the M5, M30 and H4 timeframes. Or we open a buy deal if the indicator shows a blue arrow on all timeframes. Advant
HMA Trend Professional MT4
Pavel Zamoshnikov
4.57 (7)
Improved version of the free HMA Trend indicator (for MetaTrader 4) with statistical analysis. HMA Trend is a trend indicator based on the Hull Moving Average (HMA) with two periods. HMA with a slow period identifies the trend, while HMA with a fast period determines the short-term movements and signals in the trend direction. The main differences from the free version: Ability to predict the probability of a trend reversal using analysis of history data. Plotting statistical charts for analyz
Sto Signal AM
Andriy Matviyevs'kyy
This indicator displays Stochastic osc signals on the price chart and allows the user to receive notifications of such signals. The Stochastic indicator is a classic and proven indicator of the technical analysis of the markets. Despite its age, it is still relevant today. Depending on the settings, the indicator allows you to work effectively on various TFs and any markets. Signals are given on fully formed bars and are not redrawn. Custom Parameters: Stochastic_Price (0-1) - The applied pric
FREE
SRP Pro
Farhad Kia
5 (1)
Strong Retracement Points Pro edition! SRP (Strong Retracement/Reversal Points) is a powerful and unique support and resistance indicator. It displays the closest important levels which we expect the price retracement/reversal! If all level are broken from one side, it recalculates and draws new support and resistance levels, so the levels might be valid for several days depending on the market! If you are still hesitating to start using this wonderful tool, you can check this link to see how ef
[ZhiBiCCI] indicators are suitable for all cycle use, and are also suitable for all market varieties. [ZhiBiCCI] Green solid line is a reversal of bullish divergence. The green dotted line is a classic bullish divergence. [ZhiBiCCI] The solid line to the red is a reverse bearish divergence. The red dotted line is a classical bearish divergence. [ZhiBiCCI] can be set in the parameters (Alert, Send mail, Send notification), set to (true) to send instant signals to the alarm window, email, in
GeoWprPro
Georgij Komarov
WPR by Profile, or WPR for Professionals Geo_WprPro is one of the well-known currency profile indicators. It simultaneously displays two WPR indicators with different parameters in the matrix form on all timeframes of multiple currency pairs forming the currency profile . As follows from the description, " WPR is a leading indicator that often goes ahead of the price chart. The oscillator frequently reaches extreme values before the price reversal as if anticipating that event: it almost always
Master Scalping M1 est un indicateur innovant qui utilise un algorithme pour déterminer rapidement et avec précision la tendance. L'indicateur calcule le temps d'ouverture et de fermeture des positions, les algorithmes de l'indicateur vous permettent de trouver les moments idéaux pour entrer dans une transaction (acheter ou vendre un actif), ce qui augmente le succès des transactions pour la plupart des commerçants. Avantages de l'indicateur : Facile à utiliser, ne surcharge pas le graphique ave
Indicator for binary options arrow is easy to use and does not require configuration works on all currency pairs, cryptocurrencies buy signal blue up arrow sell signal red down arrow tips do not trade during news and 15-30 minutes before their release, as the market is too volatile and there is a lot of noise it is worth entering trades one or two candles from the current period (recommended for 1 candle) timeframe up to m 15 recommended money management fixed lot or fixed percentage of the depo
Professional Histogram (PH) est un outil très efficace et fiable pour le trading du Forex, des CFD et des options binaires. PH est facile à utiliser et à configurer aussi bien pour les débutants que pour les traders expérimentés. Contrairement à la plupart des indicateurs, Professional Histogram trouve des tendances plus longues et donne moins de faux signaux. Lorsqu'un signal d'achat ou de vente apparaît, une alerte est déclenchée vous permettant d'ouvrir une position en temps opportun e
The different server times for each broker can be a heavy load when trading in short period. This indicator displays the minimum trade information required to win at a glance. The sub window displays the local time, and the main chart displays not only the local time, -Symbol -Period -BarEndTime -Spred -TokyoTime -LondonTime -NewYorkTime -ServerTime and so on... The information display on the main chart can be selected from four places: upper right, lower ri
"Adjustable Fractals" - is an advanced version of fractal indicator, very useful trading tool! As we know   Standard fractals mt4 indicator does not have settings at all   - this is very inconvenient for traders Adjustable Fractals has resolved that issue - it has all necessary settings: Adjustable period   of indicator (recommended values - above 7) Adjustable distance   from Highs/Lows of price Adjustable design   af fractal arrows // More great Expert Advisors and Indicators are available he
CCI Mtf
Dmitriy Susloparov
This is a fully multi-timeframe version of the Commodity Channel Index standard indicator, which works for any combination of timeframes. The indicator preserves the correct time scale for all charts at any intervals. When switching to a higher or lower timeframe, the time scale is not distorted. For example, one value of М15 will occupy 15 bars on М1 and 3 bars on М5 . The indicator allows you to see the real dynamics and the overall ratio for all selected periods, as well as accurately evaluat
The Riko Trend indicator is a revolutionary trend trading and filtering solution with all the important features of a trend tool built into one tool! The Riko Trend indicator is good for any trader, suitable for any trader for both forex and binary options. You don’t need to configure anything, everything is perfected by time and experience, it works great during a flat and in a trend. The Riko Trend indicator is a technical analysis tool for financial markets that reflects the current price
Current Strength
Nacer Kessir
5 (1)
The indicator (Current Strength) is represented in a separate window by Blue and Pink histogram . The parameter NPeriod represents the number of bars on which we calculate the variation of  forces, the recommended value is 5. The Blue histogram measures the  buyers force , while the Pink  histogram   measures the  sellers force . The change in color signifies the change in strength which leads t he price .  Each  drop (especially below 52.8) after touching levels 96.3 or 1.236 must be condidered
About
Tatiana Savkevych
About - Forex indicator. This trend indicator is used to determine the current trend in price movement, making it clear in which direction it is better to open a position: buy or sell. The About trend indicator is displayed on the chart and moves in parallel with the price. The Forex About trend indicator allows you to determine in time a change in the direction of price movement, thereby minimizing the likelihood of capital loss. In trading practice, various combinations of About and other ind
HeikenashiSmoothing
Rodolfo Leonardo De Morais
Heiken ashi Smoothing in separate window MTF The color of the Heiken-Ashi candles depend on their shadows. The advantage of the Heiken-Ashi chart is that the trend is determined very simply, the upward-facing sails are blue, and the downward-tendency sails are red. For profitable trading it is necessary to use it with the standard candles (make analyzes) and with the other indicators. Indicator Parameters TimeFrame - Graphic time being 0 = Current graph time, 1 = M1, 5 = M5, 15 = M15, 30 = M30
PABT Pattern Indicator - it's classical system one of the signal patterns. Indicator logic - the Hi & Lo of the bar is fully within the range of the preceding bar, look to trade them as pullback in trend. In the way if indicator found PABT pattern it's drawing two lines and arrow what showing trend way.  - First line - it's entry point and drawing at: 1. On the high of signal bar or on middle of the signal bar (depending from indicator mode) for buy; 2. On the low of signal bar or on middle of t
Pro Trend Signal System   indicator is designed for trend and signal trading. This indicator generates trend signals.  It uses many algorithms and indicators to generate this signal. It tries to generate a signal from the points with the highest trend potential. This indicator is a complete trading product. This indicator does not need any additional indicators.  You can only trade with this indicator. The generated signals are displayed on the graphical screen.  Thanks to the alert features you
Austin Bands
Augustine Kamatu
Introducing Austin Bands—an innovative indicator designed to enhance your forex trading strategy by applying moving averages to the MetaTrader 4 indicator, Bollinger Bands. Bollinger Bands are a popular technical analysis tool that consists of a middle band (usually a simple moving average), an upper band (calculated by adding a specified number of standard deviations to the middle band), and a lower band (calculated by subtracting a specified number of standard deviations from the middle ban
FREE
Elliot's Triangle is taken from 1 of the 13 patterns within the Elliot Wave Theory that says social or crowd behaviour tends to reverse in recognisable patterns and of which they reveal a structural pattern that appears in nature, as well as the mass psychology of trading participants. From this, he has devised various identifiable patterns that appear in market prices. One of these is what I have named Elliot's Triangle. This triangular pattern appears to reflect a balance of forces, causing
The indicator is designed for opening trades for a long period. he is set up to get as many points from each trade as possible. he uses the scalping method... you can trade on any currency pairs indicator is already  you can trade at any time of the day but the preferred time of trading during the European American session. currency pairs eur / jpy, eur / usd currency pairs with high volatility then the results are much better.
MetaCOT 2 is a set of indicators and specialized utilities for the analysis of the U.S. Commodity Futures Trading Commission reports. Thanks to the reports issued by the Commission, it is possible to analyze the size and direction of the positions of the major market participants, which brings the long-term price prediction accuracy to a new higher-quality level, inaccessible to most traders. These indicators, related to the fundamental analysis, can also be used as an effective long-term filter
Signaline
Ahmet Metin Yilmaz
SIGNALINE INDICATOR This indicator for all pairs and all timeframes I have just completed the M5 timeframe for deep optimization EURJPY yet. EURJPY M5 Optimization ( TP=150 , SL=130 , IndicatorPeriod=6 , Mov1=22 , Mov2=48 ) (*)Added 20.05.2019 You can find this signal page below https://www.mql5.com/en/signals/583477 Other optimizasyon results will be added on this signalpage. Input Parameters: IndicatorPeriod: Default is 8. Mov1               : Default is 21. Mov2               : Default is 48.
This indicator is another variant of the famous powerful indicator Fibonacci-SS https://www.mql5.com/en/market/product/10136 but has different behaviour in placing Pending Order and TP Line. Automatically places Fibonacci retracement lines from the last highest and lowest visible bars on the chart with: An auto Pending Order (Buy/Sell). Taking Profit 1, Taking Profit 2 is pivot point and Taking Profit 3 for extended reward opportunity. The best risk and reward ratio. Simple and powerful indica
Les acheteurs de ce produit ont également acheté
Gann Made Easy
Oleg Rodin
4.85 (81)
Gann Made Easy est un système de trading Forex professionnel et facile à utiliser qui est basé sur les meilleurs principes de trading en utilisant la théorie de mr. WD Gann. L'indicateur fournit des signaux d'ACHAT et de VENTE précis, y compris les niveaux Stop Loss et Take Profit. Vous pouvez échanger même en déplacement en utilisant les notifications PUSH. S'il vous plaît contactez-moi après l'achat! Je partagerai avec vous mes astuces de trading et d'excellents indicateurs bonus gratuitement!
TPSpro RFI Levels
Roman Podpora
4.82 (22)
Reversal First Impulse levels (RFI)    INSTRUCTIONS        RUS       -       ENG              R ecommended to use with an indicator   -   TPSpro  TREND PRO -  Version MT5 A key element in trading is zones or levels from which decisions to buy or sell a trading instrument are made. Despite attempts by major players to conceal their presence in the market, they inevitably leave traces. Our task was to learn how to identify these traces and interpret them correctly. Main functions: Displaying activ
Atomic Analyst
Issam Kassas
5 (2)
Tout d'abord, il convient de souligner que cet indicateur de trading n'est ni repainting, ni redrawing et ne présente aucun délai, ce qui le rend idéal à la fois pour le trading manuel et automatisé. Manuel de l'utilisateur : réglages, entrées et stratégie. L'Analyste Atomique est un indicateur d'action sur les prix PA qui utilise la force et le momentum du prix pour trouver un meilleur avantage sur le marché. Équipé de filtres avancés qui aident à éliminer les bruits et les faux signaux, et à
Gold Stuff
Vasiliy Strukov
4.89 (238)
Gold Stuff est un indicateur de tendance conçu spécifiquement pour l'or et peut également être utilisé sur n'importe quel instrument financier. L'indicateur ne se redessine pas et ne traîne pas. Délai recommandé H1. Au niveau de l'indicateur de travail, l'Expert Advisor EA Gold Stuff est entièrement automatique. Vous pouvez le trouver sur mon profil. Vous pouvez obtenir une copie gratuite de notre indicateur Strong Support et Trend Scanner, veuillez envoyer un message privé. moi! Contactez
Trend Punch
Mohamed Hassan
4.95 (19)
This indicator is unstoppable when combined with our other indicator called  Support & Resistance . After purchase, send us a message and you will get it   for  FREE as a BONUS! Introducing Trend Punch , the revolutionary forex trend indicator that will transform the way you trade! Trend Punch is uniquely designed to provide precise buy and sell arrows during strong market trends, making your trading decisions clearer and more confident. Whether you're trading major currency pairs or exotic sym
Scalper Inside PRO
Alexey Minkov
4.73 (56)
An exclusive indicator that utilizes an innovative algorithm to swiftly and accurately determine the market trend. The indicator automatically calculates opening, closing, and profit levels, providing detailed trading statistics. With these features, you can choose the most appropriate trading instrument for the current market conditions. Additionally, you can easily integrate your own arrow indicators into Scalper Inside Pro to quickly evaluate their statistics and profitability. Scalper Inside
TPSproTREND PrO
Roman Podpora
4.79 (19)
TPSpro TREND PRO   est un indicateur de tendance qui analyse automatiquement le marché et fournit des informations sur la tendance et chacun de ses changements, ainsi que des signaux pour entrer dans des transactions sans redessiner ! L'indicateur utilise chaque bougie et les analyse séparément. faisant référence à différentes impulsions - impulsion ascendante ou descendante. Points d'entrée précis dans les transactions sur les devises, les crypto-monnaies, les métaux, les actions, les indices 
FX Power MT4 NG
Daniel Stein
5 (12)
Obtenez votre mise à jour quotidienne du marché avec des détails et des captures d'écran via notre Morning Briefing ici sur mql5 et sur Telegram ! FX Power MT4 NG est la nouvelle génération de notre très populaire indicateur de force des devises, FX Power. Et qu'est-ce que ce compteur de force de nouvelle génération offre ? Tout ce que vous avez aimé de l'original FX Power PLUS Analyse de la force de l'OR/XAU Des résultats de calcul encore plus précis Périodes d'analyse configurables individuel
Actuellement 20% de réduction ! La meilleure solution pour tout débutant ou trader expert ! Ce logiciel de tableau de bord fonctionne sur 28 paires de devises. Il est basé sur 2 de nos principaux indicateurs (Advanced Currency Strength 28 et Advanced Currency Impulse). Il donne un excellent aperçu de l'ensemble du marché Forex. Il montre les valeurs de l'Advanced Currency Strength, la vitesse de mouvement des devises et les signaux pour 28 paires de devises dans tous les (9) délais. Imagine
Trend Screener
STE S.S.COMPANY
4.8 (87)
Indicateur de tendance, solution unique révolutionnaire pour le trading et le filtrage des tendances avec toutes les fonctionnalités de tendance importantes intégrées dans un seul outil ! Il s'agit d'un indicateur multi-période et multi-devises 100 % non repeint qui peut être utilisé sur tous les symboles/instruments : forex, matières premières, crypto-monnaies, indices et actions. OFFRE À DURÉE LIMITÉE : L'indicateur Support and Resistance Screener est disponible pour seulement 50 $ et à vie. (
FX Volume
Daniel Stein
4.58 (33)
Obtenez votre mise à jour quotidienne du marché avec des détails et des captures d'écran via notre Morning Briefing ici sur mql5 et sur Telegram ! FX Volume est le PREMIER et SEUL indicateur de volume qui fournit un VRAI aperçu du sentiment du marché du point de vue d'un courtier. Il fournit des informations impressionnantes sur la façon dont les acteurs institutionnels du marché, comme les courtiers, sont positionnés sur le marché des changes, bien plus rapidement que les rapports COT. Voir c
- Real price is 80$ - 40% Discount ( It is 49$ now ) Contact me for instruction, add group and any questions! Related EA Product: Bitcoin Expert Introduction The breakout and retest strategy is traded support and resistance levels. it involves price breaking through a previous level.  The break and retest strategy is designed to help traders do two main things, the first is to avoid false breakouts. Many false breakouts start with a candlestick that breaks out of a level but ends with an immedi
ACTUELLEMENT 31% DE RÉDUCTION ! ! La meilleure solution pour tout débutant ou Expert Trader ! Cet indicateur est un outil de trading unique, de haute qualité et abordable car nous avons incorporé un certain nombre de caractéristiques exclusives et une formule secrète. Avec seulement UN graphique, il donne des alertes pour les 28 paires de devises. Imaginez comment votre trading s'améliorera parce que vous serez capable de repérer le point de déclenchement exact d'une nouvelle tendance ou d'
Enigmera
Ivan Stefanov
5 (3)
ENIGMERA : Le cœur du marché https://www.enigmera.com Introduction Cet indicateur et ce système de trading constituent une approche remarquable des marchés financiers. ENIGMERA utilise les cycles fractals pour calculer avec précision les niveaux de support et de résistance. Il indique la phase d'accumulation authentique et donne une direction et des objectifs.  Un système qui fonctionne que nous soyons dans une tendance ou une correction.  Comment fonctionne-t-il ? ENIGMERA comprend trois l
Trend Cutter
Oleg Rodin
5 (2)
Trend Cutter est un indicateur de tendance qui peut être utilisé avec n'importe quelle période, y compris les périodes inférieures comme M1 et M5. L'indicateur est idéal pour les traders qui préfèrent le trading intrajournalier et sera également utile à ceux qui préfèrent le trading à long terme. Vous pouvez utiliser cet indicateur comme base pour votre système de trading ou comme solution de trading autonome. L'indicateur fournit tous les types d'alertes, y compris les notifications PUSH. L'ind
Le système PRO Renko est un système de trading très précis spécialement conçu pour le trading de graphiques RENKO. Il s'agit d'un système universel qui peut être appliqué à divers instruments de négociation. Le système neutralise efficacement ce qu'on appelle le bruit du marché en vous donnant accès à des signaux d'inversion précis. L'indicateur est très facile à utiliser et n'a qu'un seul paramètre responsable de la génération du signal. Vous pouvez facilement adapter l'outil à n'importe q
ACTUELLEMENT 26% DE RÉDUCTION La meilleure solution pour tout débutant ou trader expert ! Cet indicateur est un outil de trading unique, de haute qualité et abordable car nous avons incorporé un certain nombre de caractéristiques exclusives et une nouvelle formule. Avec seulement UN graphique, vous pouvez lire la force de la devise pour 28 paires Forex ! Imaginez comment votre trading va s'améliorer parce que vous êtes capable de repérer le point de déclenchement exact d'une nouvelle tendan
Le profit de la structure du marché change à mesure que le prix s'inverse et recule. L'indicateur d'alerte d'inversion de la structure du marché identifie le moment où une tendance ou un mouvement de prix approche de l'épuisement et est prêt à s'inverser. Il vous avertit des changements dans la structure du marché qui se produisent généralement lorsqu'un renversement ou un recul majeur est sur le point de se produire. L'indicateur identifie initialement les cassures et la dynamique des prix,
TakePropips Donchian Trend Pro
Eric John Pajarillaga Aldana
4.44 (16)
TakePropips Donchian Trend Pro   (MT4) est un outil puissant et efficace qui détecte automatiquement la direction de la tendance à l'aide du canal Donchian et vous fournit des signaux de trading d'entrée et de sortie ! Cet indicateur multifonction comprend un scanner de tendance, des signaux de trading, un panneau statistique, un filtre, des sessions de trading et un tableau de bord de l'historique des alertes. Il est conçu pour vous fournir des signaux de trading et vous faire gagner des heures
Dessine automatiquement les niveaux de support et de résistance PLUS les écarts des bougies de propulsion sur votre graphique, afin que vous puissiez voir où le prix est susceptible de se diriger ensuite et/ou de s'inverser potentiellement. Cet indicateur est conçu pour être utilisé dans le cadre de la méthodologie de trading de position enseignée sur mon site web (The Market Structure Trader) et affiche des informations clés pour le ciblage et les entrées potentielles. L'indicateur comport
Currency Strength Wizard est un indicateur très puissant qui vous offre une solution tout-en-un pour un trading réussi. L'indicateur calcule la puissance de telle ou telle paire de devises en utilisant les données de toutes les devises sur plusieurs périodes. Ces données sont représentées sous la forme d'un indice de devise facile à utiliser et de lignes électriques de devise que vous pouvez utiliser pour voir la puissance de telle ou telle devise. Tout ce dont vous avez besoin est d'attacher l'
IX Power MT4
Daniel Stein
5 (5)
IX Power apporte enfin la précision imbattable de FX Power aux symboles non-Forex. Il détermine avec précision l'intensité des tendances à court, moyen et long terme de vos indices, actions, matières premières, ETF et même crypto-monnaies préférés. Vous pouvez analyser tout ce que votre terminal a à offrir. Essayez-le et découvrez comment votre timing s'améliore considérablement lors de vos transactions. Caractéristiques principales d'IX Power Résultats de calcul précis à 100 %, sans ré
L'indicateur d'inversion ADR vous montre en un coup d'œil où le prix se négocie actuellement par rapport à sa fourchette quotidienne moyenne normale. Vous recevrez des alertes instantanées par pop-up, e-mail ou push lorsque le prix dépasse sa fourchette moyenne et les niveaux supérieurs de votre choix afin que vous puissiez sauter rapidement dans les reculs et les inversions. L'indicateur trace des lignes horizontales sur le graphique aux extrêmes de la fourchette quotidienne moyenne ainsi que
Trend Pulse
Mohamed Hassan
5 (4)
Please contact me after purchase to immediately get your PDF strategy + documentation for Trend Pulse !  Introducing Trend Pulse , a unique and robust indicator capable of detecting bullish, bearish, and even ranging trends! Trend Pulse uses a special algorithm to filter out market noise with real precision. If the current symbol is moving sideways, Trend Pulse will send you a ranging signal, letting you know that it's not a good time to enter a trade. This excellent system makes Trend Pulse
Le tableau de bord d'alerte RSI / TDI vous permet de surveiller les RSI à la fois (sélectionnables par vous) sur chaque paire majeure que vous négociez. Vous pouvez l'utiliser de deux manières : 1. Sélectionnez plusieurs périodes et le tiret vous montrera quand il y a plusieurs périodes prolongées au-delà des conditions commerciales normales. Un excellent indicateur que le prix a poussé fort récemment, car il a atteint un niveau de surachat ou de survente sur plusieurs périodes, de sorte
Stratos Pali Indicator   is a revolutionary tool designed to enhance your trading strategy by accurately identifying market trends. This sophisticated indicator uses a unique algorithm to generate a complete histogram, which records when the trend is Long or Short. When a trend reversal occurs, an arrow appears, indicating the new direction of the trend. Important Information Revealed Leave a review and contact me via mql5 message to receive My Top 5 set files for Stratos Pali at no cost! D
Gold Channel is a volatility-based indicator, developed with a specific timing algorithm for the XAUUSD pair, which consists of finding possible corrections in the market. This indicator shows two outer lines, an inner line (retracement line) and an arrow sign, where the theory of the channel is to help identify overbought and oversold conditions in the market. The market price will generally fall between the boundaries of the channel. If prices touch or move outside the channel it is a tra
M1 Arrow
Oleg Rodin
4.73 (15)
Une stratégie intraday basée sur deux principes fondamentaux du marché. L'algorithme est basé sur l'analyse des volumes et des vagues de prix à l'aide de filtres supplémentaires. L'algorithme intelligent de l'indicateur ne donne un signal que lorsque deux facteurs de marché se combinent en un seul. L'indicateur calcule les vagues d'une certaine plage sur le graphique M1 en utilisant les données de la période la plus élevée. Et pour confirmer la vague, l'indicateur utilise une analyse en volume.
Bomb Bank Signal
Igor Pereira Calil
5 (1)
Signal Bomb Bank : votre indicateur de confiance dans MetaTrader 4 Bomb Bank Signal est un indicateur puissant pour MetaTrader 4, conçu pour identifier les tendances les plus pertinentes du marché financier. Si vous recherchez un outil qui anticipe avec précision les mouvements, la Bomb Bank est l’alliée qu’il vous faut. Comment ça marche : Cet indicateur combine trois méthodes distinctes – analyse de volume, clôture de bougie et tendance symétrique – pour détecter et signaler les opportu
Advanced Supply Demand
Bernhard Schweigert
4.91 (294)
CURRENTLY 26% OFF !! Best Solution for any Newbie or Expert Trader! This indicator is a unique, high quality and affordable trading tool because we have incorporated a number of proprietary features and a new formula. With this update, you will be able to show double timeframe zones. You will not only be able to show a higher TF but to show both, the chart TF, PLUS the higher TF: SHOWING NESTED ZONES. All Supply Demand traders will love it. :) Important Information Revealed Maximize the potenti
Filtrer:
Aucun avis
Répondre à l'avis