Liquidity Breaks and Swings
- Indicateurs
- Erik Istvan Fazekas
- Version: 1.4
- Mise à jour: 14 septembre 2024
Voir "Nouveautés" pour un récapitulatif des nouvelles fonctions. La version 1.4 n'était qu'un nettoyage, rien de spécial.
J'ai créé cela car j'avais besoin d'un indicateur fractal personnalisable. Il vérifie également la diminution des volumes pour obtenir une forme de confirmation. Détails ci-dessous :
Vue d'ensemble
Cet indicateur est conçu pour aider à identifier les points de retournement clés sur le marché en analysant l'action des prix et la dynamique des volumes.
Caractéristiques
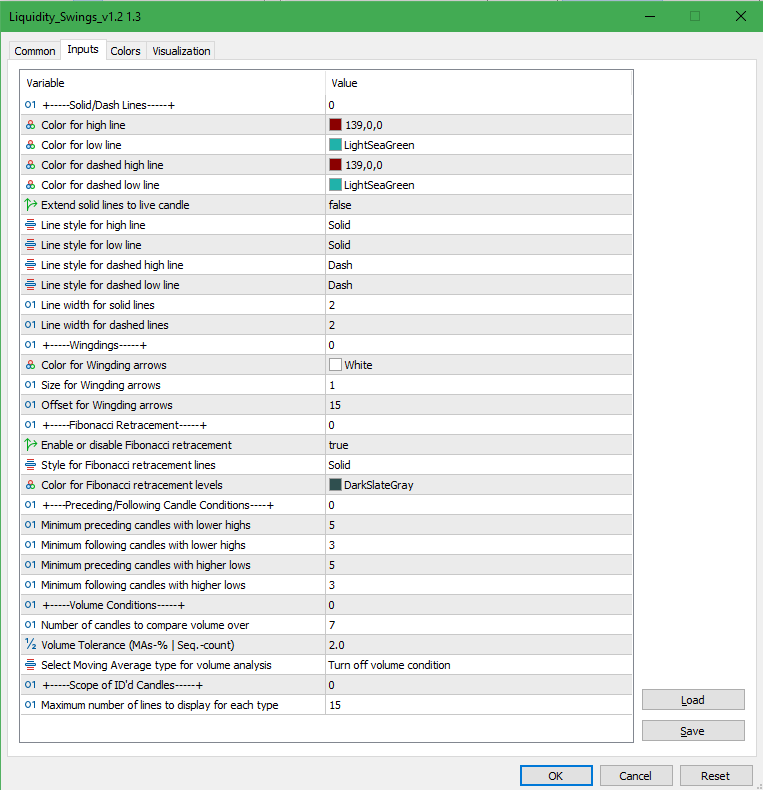
La stratégie principale de l'indicateur repose sur l'identification des modèles de hauts et de bas qui précèdent souvent des mouvements de prix significatifs. Ces modèles sont déterminés en analysant le graphique à la recherche de bougies avec :
Modèles de bougies baissières : Identifiés lorsqu'un sommet de bougie est supérieur à un nombre [réglable par l'utilisateur] de bougies précédentes (par défaut 5) et suivantes (par défaut 3). Ils sont marqués seulement si la bougie a également un nombre [réglable par l'utilisateur] de barres de volume décroissantes qui la précèdent.
Modèles de bougies haussières : Identifiés lorsqu'un bas de bougie est inférieur à un nombre [réglable par l'utilisateur] de bougies précédentes (par défaut 5) et suivantes (par défaut 3). Ils sont marqués seulement si la bougie a également un nombre [réglable par l'utilisateur] de barres de volume décroissantes qui la précèdent.
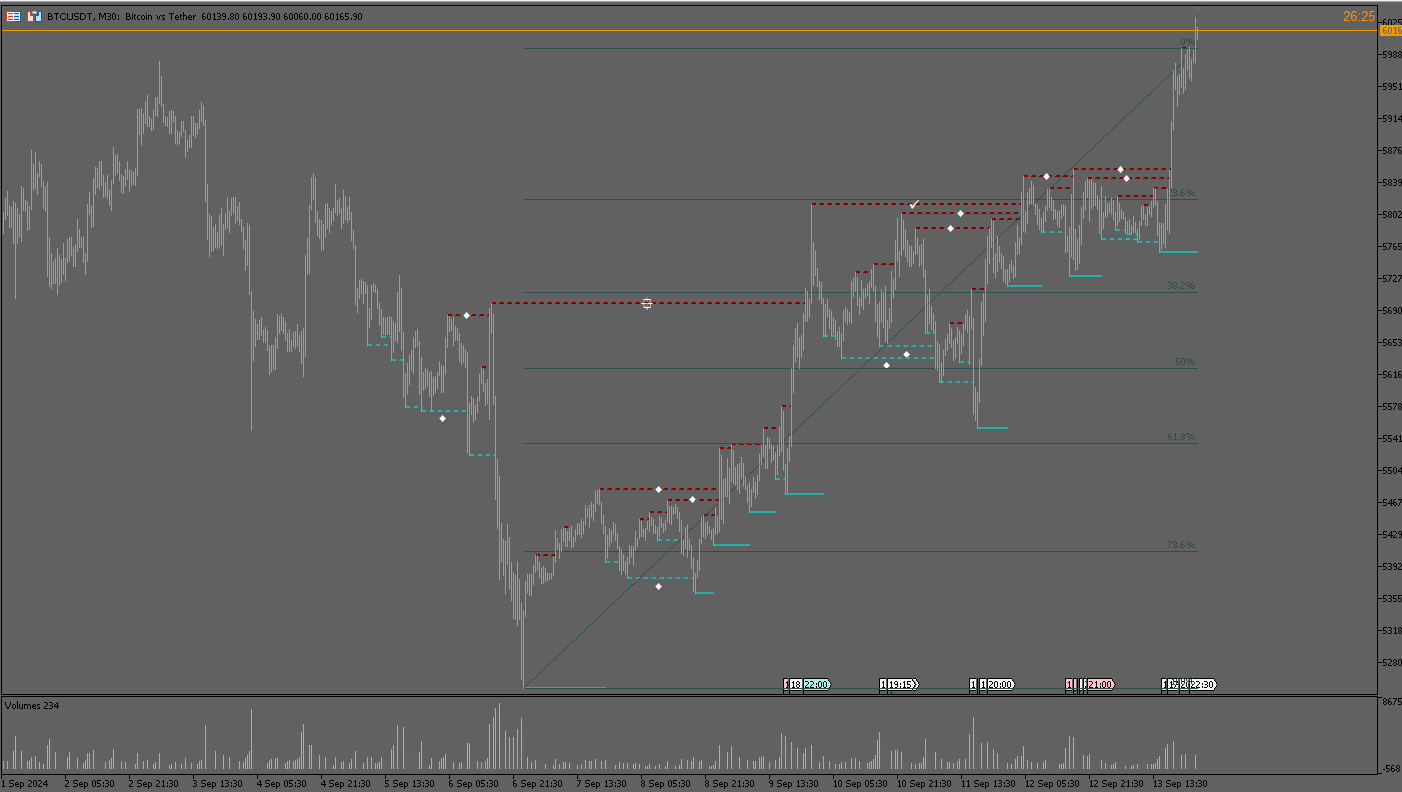
Tracé de ligne de rupture
Une fois qu'une bougie est identifiée, l'indicateur trace une ligne au niveau du sommet ou du bas de la bougie. Si une bougie suivante casse au-dessus d'une bougie haute ou en dessous d'une bougie basse, la ligne est convertie en ligne pointillée, s'étendant jusqu'au point de la cassure.
Le nombre total de bougies identifiées peut être saisi dans la section des propriétés, avec une option pour étendre les niveaux non cassés jusqu'à la bougie en direct.
Classification des ruptures
Chaque ligne pointillée est classée en fonction du nombre de bougies entre le modèle identifié et la rupture :
- "Grand Swing" : S'étend sur 150 bougies ou plus.
- "Pas Mal Swing" : S'étend sur 110 à 139 bougies.
- "Swing Correct" : S'étend sur 70 à 109 bougies.
- "Swing Moyen" : S'étend sur 30 à 69 bougies.
- "Swing Non Marqué" : S'étend sur moins de 30 bougies.
Retracement de Fibonacci (optionnel)
L'indicateur inclut également une fonction de retracement de Fibonacci automatique qui est tracée dynamiquement en fonction des points de swing identifiés :
Dans une tendance haussière, le retracement de Fibonacci est tracé du bas de la bougie la plus basse identifiée au sommet de la bougie la plus haute identifiée. Dans une tendance baissière, le retracement est tracé du sommet de la bougie la plus haute identifiée au bas de la bougie la plus basse identifiée. L'identification d'une tendance haussière ou baissière dans ce cas est basée sur la proximité de la bougie la plus haute ou la plus basse par rapport à la bougie en direct. Par exemple, si la bougie la plus haute est plus proche de notre bougie en direct, le code l'évaluera comme une tendance haussière et vice-versa.
Il est recommandé de désactiver la grille pour utiliser cet indicateur.
L'utilisateur n'a laissé aucun commentaire sur la note