ATR TpSl Bands
- Indicateurs
- Tan Cuong Nguyen
- Version: 1.0
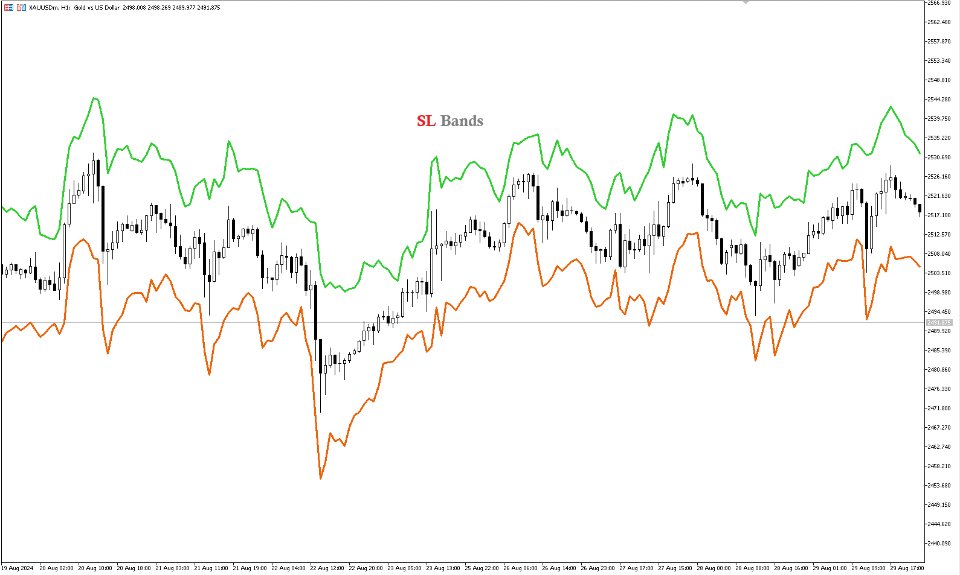
This indicator uses the Average True Range (ATR) to dynamically calculate and plot take-profit (TP) and stop-loss (SL) levels for trading positions. By leveraging the ATR, the indicator adapts to market volatility, ensuring that TP and SL levels are placed at optimal distances to account for price fluctuations.
Key Features:
-
ATR-Based Calculations: The indicator uses the ATR, a popular measure of market volatility, to determine the appropriate distance for both TP and SL levels. This ensures that levels are sensitive to market conditions and adjust automatically as volatility changes.
-
Customizable ATR Period: Users can specify the period for the ATR calculation, allowing for flexibility in responding to short-term or long-term market movements.
-
Scalable TP/SL Levels: The indicator includes scaling factors that enable users to adjust the distance of TP and SL levels relative to the ATR. This allows traders to customize the risk/reward ratio according to their trading strategy.
-
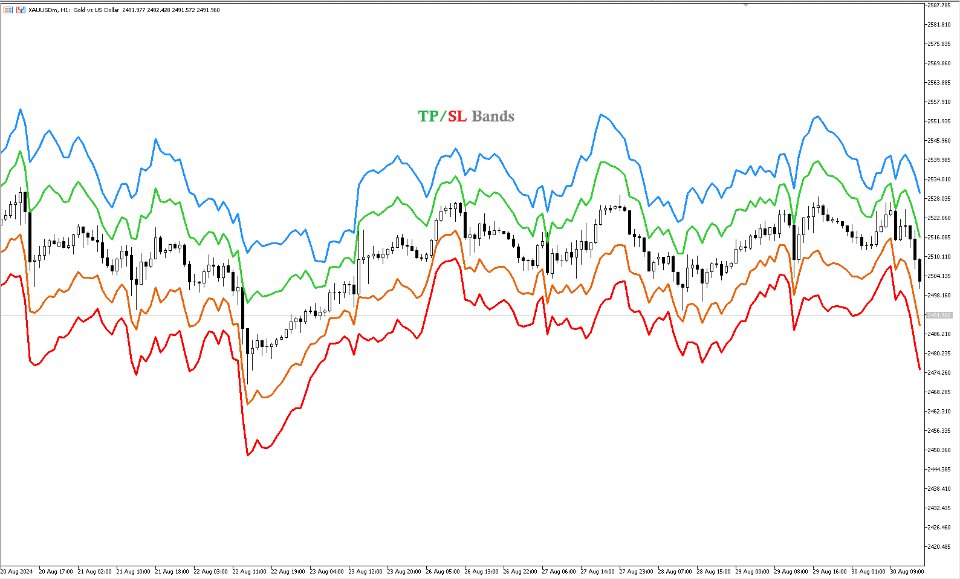
Visual Display: The indicator plots TP and SL levels directly on the price chart, providing a clear and immediate visual reference for potential trade exits.
-
Take-Profit Zones: Optionally, the indicator can display take-profit zones, scaled from the stop-loss levels, giving traders predefined targets based on desired reward/risk ratios.
Inputs:
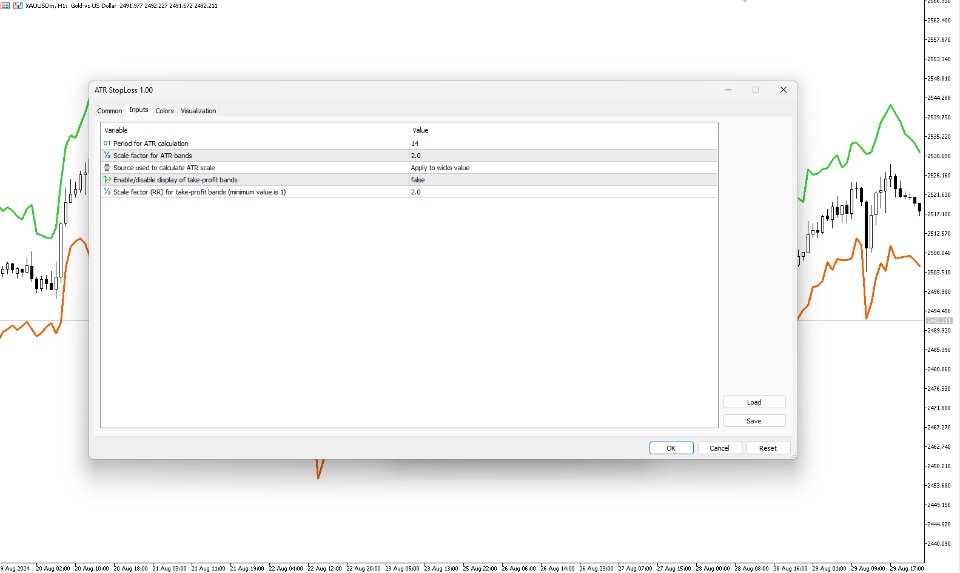
- ATR Period: Sets the period for calculating the ATR, which determines the sensitivity to market volatility.
- ATR Scale Factor: Adjusts the multiplier used for scaling the ATR value to define SL levels.
- ATR Source: Chooses the price source (e.g., close price) for the ATR calculation.
- Show Take-Profit Bands: Enables or disables the display of TP zones opposite to the SL levels.
- Take-Profit Scale Factor: Defines the scaling factor for calculating TP levels, setting the desired reward/risk ratio.
