• Aperçu
  • Avis
  • Commentaires

ATR TpSl Bands

This indicator uses the Average True Range (ATR) to dynamically calculate and plot take-profit (TP) and stop-loss (SL) levels for trading positions. By leveraging the ATR, the indicator adapts to market volatility, ensuring that TP and SL levels are placed at optimal distances to account for price fluctuations.

Key Features:

  1. ATR-Based Calculations: The indicator uses the ATR, a popular measure of market volatility, to determine the appropriate distance for both TP and SL levels. This ensures that levels are sensitive to market conditions and adjust automatically as volatility changes.

  2. Customizable ATR Period: Users can specify the period for the ATR calculation, allowing for flexibility in responding to short-term or long-term market movements.

  3. Scalable TP/SL Levels: The indicator includes scaling factors that enable users to adjust the distance of TP and SL levels relative to the ATR. This allows traders to customize the risk/reward ratio according to their trading strategy.

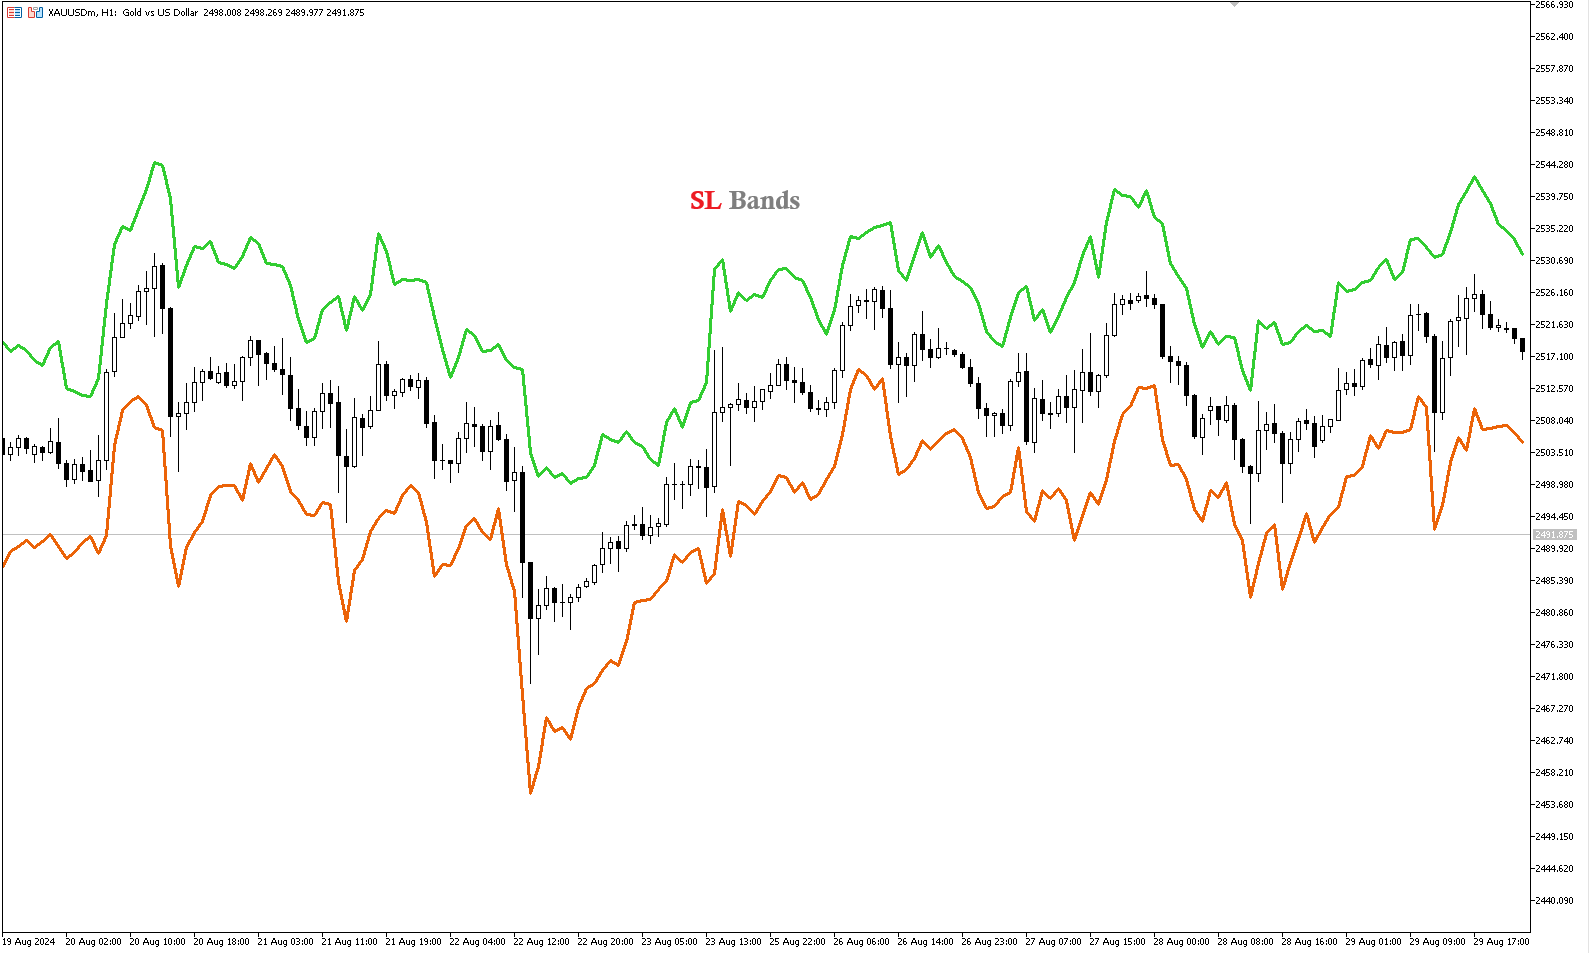
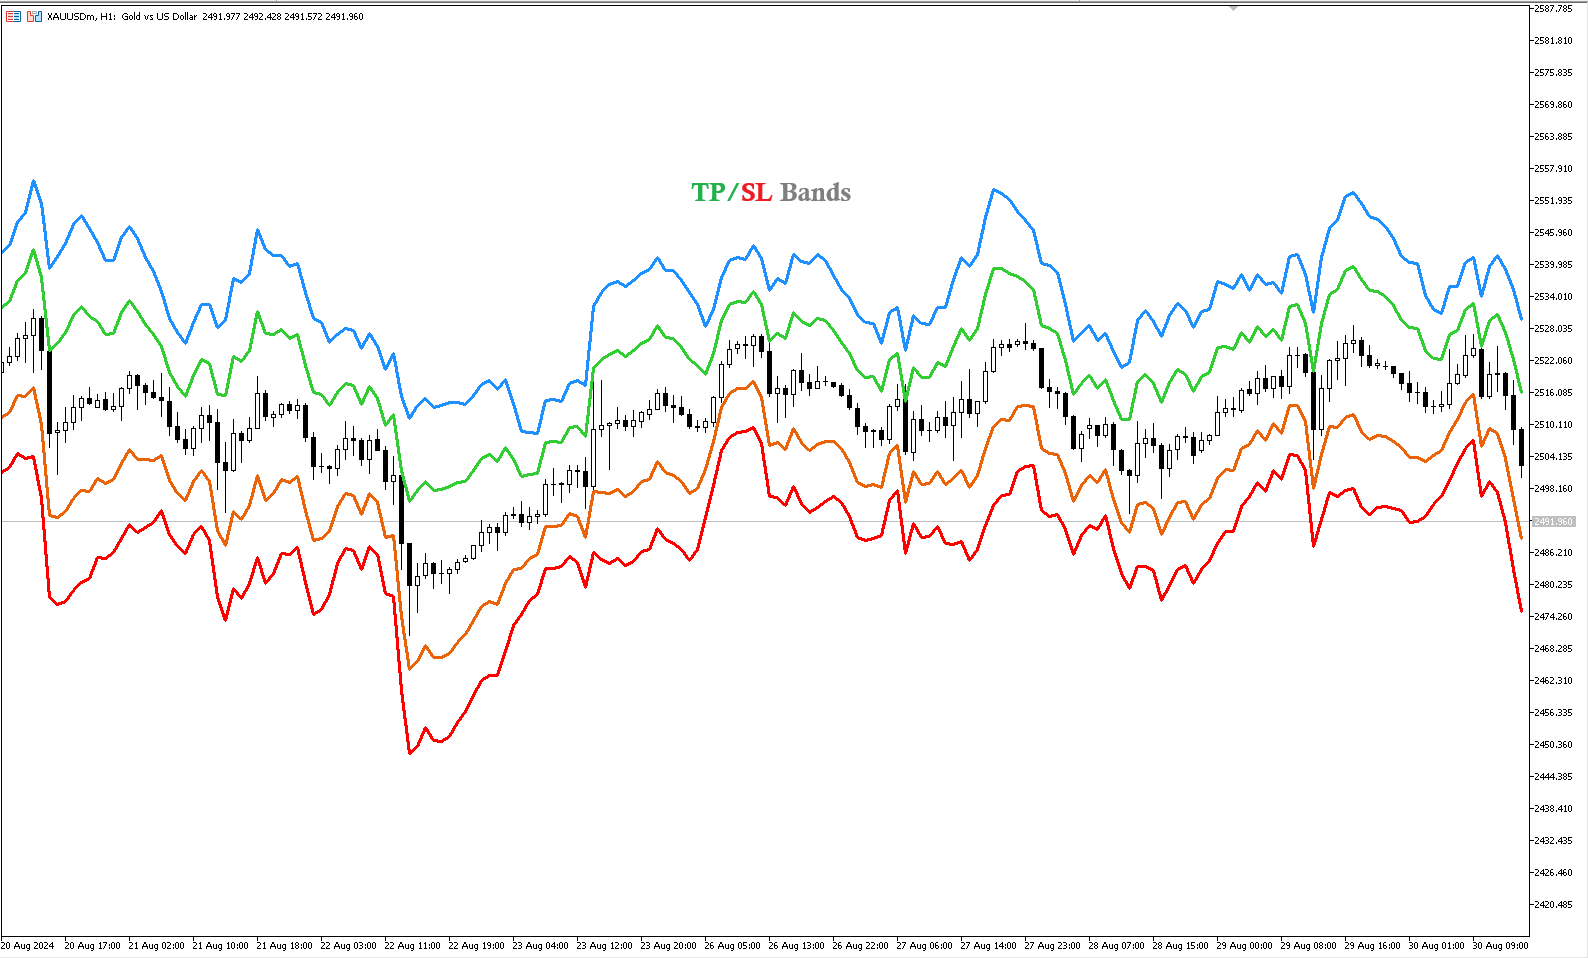
  4. Visual Display: The indicator plots TP and SL levels directly on the price chart, providing a clear and immediate visual reference for potential trade exits.

  5. Take-Profit Zones: Optionally, the indicator can display take-profit zones, scaled from the stop-loss levels, giving traders predefined targets based on desired reward/risk ratios.
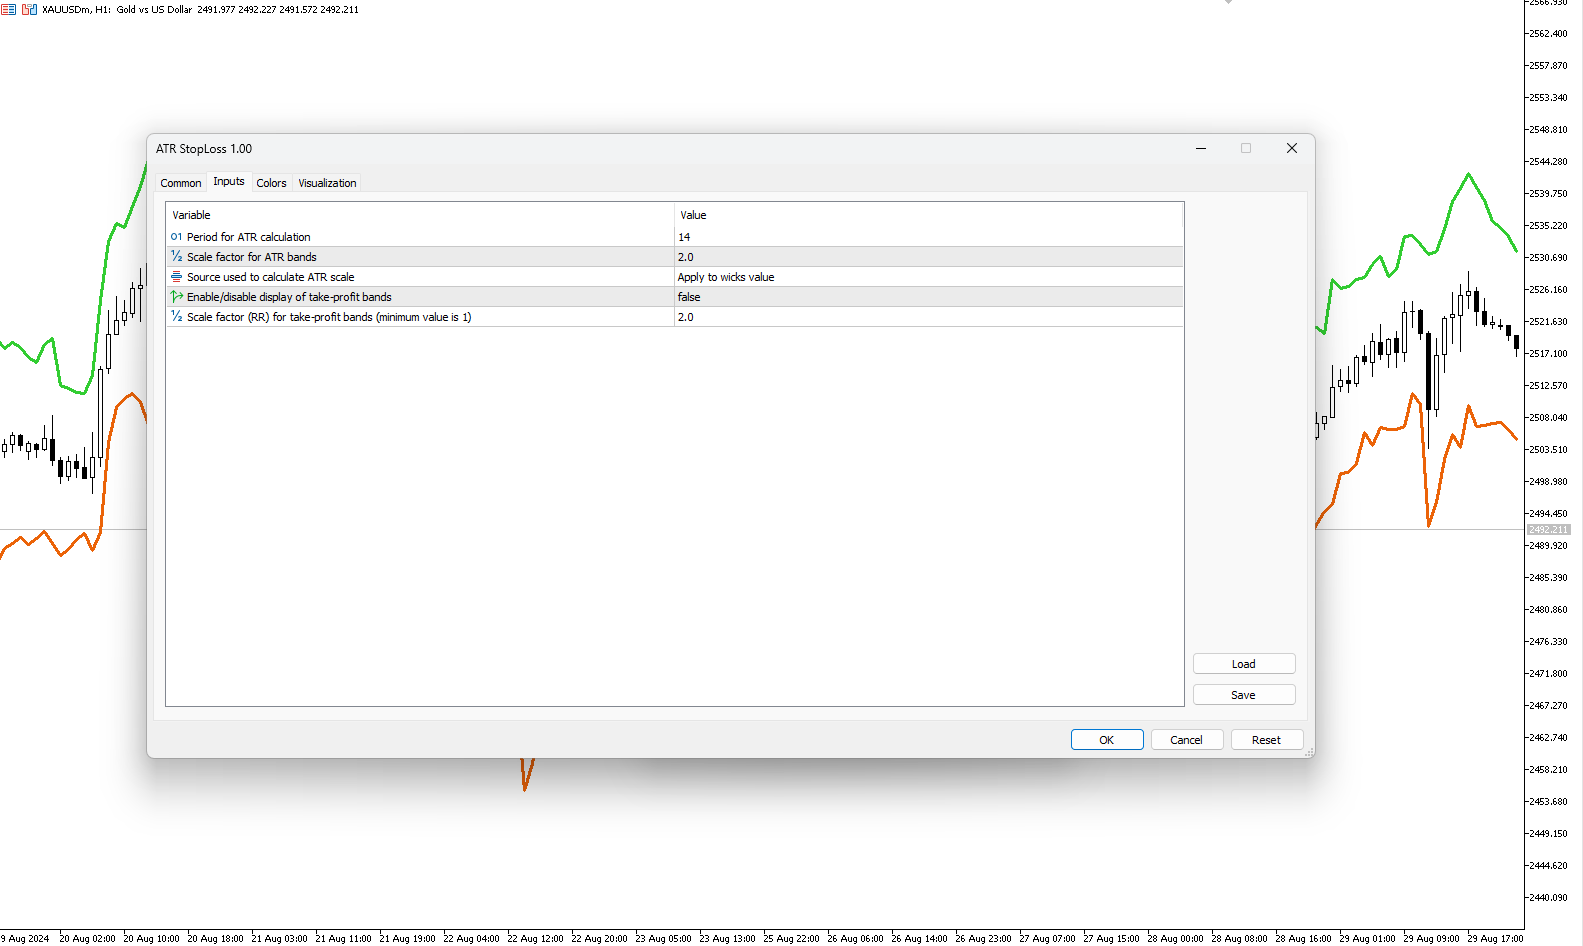
Inputs:

  • ATR Period: Sets the period for calculating the ATR, which determines the sensitivity to market volatility.
  • ATR Scale Factor: Adjusts the multiplier used for scaling the ATR value to define SL levels.
  • ATR Source: Chooses the price source (e.g., close price) for the ATR calculation.
  • Show Take-Profit Bands: Enables or disables the display of TP zones opposite to the SL levels.
  • Take-Profit Scale Factor: Defines the scaling factor for calculating TP levels, setting the desired reward/risk ratio.


Produits recommandés
AliPivot Points is a Meta Trader 5 Indicator that draws you the latest pivot points. You can choose from timeframes ranging from 1 Minute to 1 Month. Calculation methods for pivot points includes: Classic Pivot Points Camarilla Pivot Points Fibonacci Pivot Points Woodie Pivot Points You can personalize the line colors, style, and width to suit your preference. The indicator displays values on the right side of the chart. AliPivot Points values can also be utilized by developers for creating Expe
FREE
This indicator is stand alone version from  MP Pivot Levels  (All in one) containing Woodie Pivots. Woodie’s pivot points are made up of multiple key levels, calculated from past price points, in order to frame trades in a simplistic manner. The key levels include the ‘pivot’ itself, and multiple support and resistance levels (usually up to three each). Traders use these levels as a guide for future price movements when setting up trades. The pivot : (Previous high + previous low + 2 x previou
FREE
Drawing Parabolic Channels
BeeXXI Corporation
5 (6)
Convenient drawing of parabolic channels by four points (two lower and two upper extremums). Additional control keys: N (New) - Start drawing a new channel. C (Clear) - Deletes the current channel. By default, the current channel is the last channel. But you can click on the line of any channel to make it current. Click on the gear in the upper right corner to set some parameters for all channels or the current channel. All work is visible from the animated Gif. Do not forget to express your
FREE
Pivots Lines
Abakou Nazaire Ayelenou
Dessinez des points pivots Traditionnels, Fibonacci, Woodie, Classic, Demark, Camarilla pour n'importe quelle période. Supporte tous les types de pivot : Traditionnel, Fibonacci, Woodie, Classic, Demark, Camarilla. Supporte tous les cadres temporels (M1...H1...D1...MN1...Annuel) Supporte l'heure d'été du serveur Support de la section quotidienne du forex de l'ouverture de Sydney à la fermeture des États-Unis Support Crypto trading Remplir l'écart entre le pivot et la tendance, très utile Le
FREE
The utility draws pivot levels for the selected timefram in classic method. Pivot = (high + close + low) / 3 R1 = ( 2 * Pivot) - low S1 = ( 2 * Pivot) - high R2 = Pivot + ( high - low ) R3 = high + ( 2 * (Pivot - low)) S2 = Pivot - (high - low) S3 = low - ( 2 * (high - Pivot)) you can change the timeframe, colors and fontsize. also you can change the text for the levels. Have fun and give feedback...
FREE
The Period Breakout Indicator is a versatile tool designed for traders seeking to identify breakout opportunities based on customizable time periods. This indicator automatically determines the highest and lowest prices within a user-defined period, allowing you to tailor it precisely to your trading strategy. Key Features: Customizable Time Periods:   Define the start and end times based on your preferred trading hours or any specific period. The indicator will then calculate the highest and lo
FREE
This indicator show color of trend. And combined with the average line, but be used on the hightest price and the lowest of the 26 period. The target entry at the level and the point of the route between 2 line for entry and exit position This is a first version, many problems is not supported and fine. Expected a contected from your friends To continue to follow the good products
FREE
Fonctionnalités Indicateur pour le Trading de Retracement de Fibonacci Un graphique de Fibonacci est tracé en fonction de la barre précédente sélectionnée parmi 1H, 4H, 1D et 1W. Quand le prix du marché touche le niveau de Fibonacci, la couleur change et l'heure du toucher est affichée. Le graphique de Fibonacci est tracé aux niveaux -23.6, 0, 23.6, 38.2, 50, 61.8, 76.4, 100 et 123.6, et le graphique se rafraîchit lorsque la barre est mise à jour. Variables Échelle de temps : Un graphiqu
FREE
FaU fibo
Aleksandr Dementev
The indicator draws actual Fibonacci levels for your trading activity. The levels are redrawn every time after the price touches the low (0%) or the 100% fibonacci level. In the parameters, select the trading activity: Long term investor Medium term investor Medium-term investor active Short term investor Short-term investor active Speculator Speculator active Scalper Scalper active Try this indicator in action, and you will no longer have to look for coordinates for drawing fibonacci level
FREE
Camarilla Swing Trade Indicator is an Indicator. Support and resistance points are calculated from the High Low Close of the previous TF Week's price. What are Camarilla Pivot Points? 1.Camarilla Pivot Points is a modified version of the classic Pivot Point. 2.Camarilla Pivot Points was launched in 1989 by Nick Scott, a successful bond trader. 3.The basic idea behind Camarilla Pivot Points is that price tends to revert to its mean until it doesn't. 4.Camarilla Pivot Points is a mathematical
FREE
CandleBot
Mithlesh Kumar Mandal
Présentation de CandleBot - Votre Outil Ultime et Gratuit pour Identifier et Trader les Figures de Chandeliers ! Avec CandleBot, saisissez l'avantage sur les marchés en reconnaissant facilement les signaux haussiers et baissiers d'englobement, les étoiles du matin et du soir, ainsi que les signaux de marteau. Les figures de chandeliers, dérivées des prix d'ouverture, de clôture, de plus haut et de plus bas sur une période spécifique, servent de représentations visuelles des mouvements de prix, a
FREE
Free automatic Fibonacci is an indicator that automatically plots a Fibonacci retracement based on the number of bars you select on the BarsToScan setting in the indicator. The Fibonacci is automatically updated in real time as new highest and lowest values appears amongst the selected bars. You can select which level values to be displayed in the indicator settings. You can also select the color of the levels thus enabling the trader to be able to attach the indicator several times with differe
FREE
Amiguinhos Bar Counter
Eduardo Correia Da Silva
3.67 (3)
Amiguinho's Bar Counter is a price action indicator to display the bar count (candles) with some interesting options. About the "Period of analysis" parameter: if the current timeframe is in minutes, then the analysis period will be considered in days; if the current timeframe is in days, then the analysis period will be considered in months; or  if the period of analysis will be considered in years.
FREE
The   Pivot Point indicator   automatically calculates and displays the pivot point line and support and resistance levels. Pivot can be calculated according to the Classic, Floor, Fibonacci, Woodie, Camarilla or DeMark formula. It is also possible to select the period for calculating the indicator. A trader can choose from daily, weekly, monthly, or user-defined periods. Types of pivots Classic Floor Fibonacci Woodie Camarilla DeMark Main features The indicator shows the current and histor
FREE
Get ALERTS for break of your TRENDLINES, SUPPORT LINES, RESISTANCE LINE, ANY LINE!! 1. Draw a line on the chart (Trend, support, resistance, whatever you like) and give it a name (e.g. MY EURUSD line) 2. Load the Indicator and input the Line Name the same name in Indicator INPUT so system knows the name of your line (= MY EURUSD line) 3. Get Alerts when Price breaks the line and closes Works on All Time frames and charts LEAVE A COMMENT AND IF THERE IS ENOUGH INTEREST I WILL WRITE AN EA WHICH
FREE
Pivot MT5
Dmitrij Isaenko
The indicator draws daily support and resistance lines on the chart, as well as the Pivot level (reversal level). Adapted to work in MT5 The standard timeframe for calculating support and resistance levels is D1. You can choose other timeframes according to your strategy (for example, for M1-M15, the optimal timeframe for calculations is H1) The function for calculating support and resistance levels has been updated; in this calculation option, fibonacci levels are taken into account, res
FREE
Pivot Points are used by Forex traders to find support and resistance levels based on the previous day's price action. There are various ways to calculate pivot points, including averaging the open, high, low, and close of the previous day's chart price. Forex Traders use a combination of pivot points with moving averages to find trading opportunities in the currency markets. Pivot points are very useful tools that use the previous bars' highs, lows and closings to project support and re
FREE
The selective pin bar is designed to identify reversals. To use the selective pin bar effectively, traders typically look for Strong Rejection: The tail of the pin bar should extend significantly beyond the surrounding price action. It indicates that there was a sharp rejection of higher or lower prices during the trading period. A strong rejection suggests that the market sentiment may be changing.
FREE
RSI Plus MT5
Nguyen Thanh Cong
5 (1)
Introduction The  RSI Plus  is an innovative technical analysis tool designed to measure the strength and direction of the market trend. Unlike the traditional RSI indicator, the RSI Plus boasts a distinctive ability to adapt and respond to market volatility, while still minimizing the effects of minor, short-term market fluctuations. Signal Buy when the RSI plus has been in the oversold (red) zone some time and it crosses above the 20 level on previous candle close Sell when the RSI
FREE
Fair Value Gap Scanner
Usiola Oluwadamilol Olagundoye
The Fair Value Gap Detector is a MetaTrader 5 indicator designed to identify and draw rectangles on the chart wherever fair value gaps (FVGs) are detected. Fair value gaps occur when there is a significant disparity between the current price and the fair value of an asset. These gaps can provide valuable insights into potential trading opportunities, as they often indicate overbought or oversold conditions in the market. Key Features: FVG Detection: The indicator utilizes a proprietary algorith
FREE
Pro Support Resistance MT5
Suvashish Halder
4.92 (24)
This is the best Support and Resistance Indicator on the market, and it shows both confirmed Support and Resistance as well as Retests. Support & Resistance: Support marks where buying demand halts price declines, acting as a safety net. Resistance caps price surges, driven by selling pressure. Traders leverage these levels to predict reversals, plan entries, exits, and manage risks, making them trading's fundamental guideposts. You can also find Premium and Discount Levels, Strong High/Low,  
FREE
Levels of Pivots
Nikolay Mitrofanov
The utility draws reversal levels using the formulas for each of the selected number of candles: Pivot = (high + close + low) / 3 R1 = ( 2 * Pivot) - low S1 = ( 2 * Pivot) - high R2 = Pivot + (R1 -S1) R3 = high + ( 2 * (Pivot - low)) S2 = Pivot - (R1 - S1) S3 = low - ( 2 * (high - Pivot)) H = high L = low U = if the candle is bullish, then close. Otherwise - open D = if the candle is bullish, then open. Otherwise - close On any timeframe. After a new candle closes on the calculated timefr
FREE
Functional in the Forex market. Functional in the B3 market - Bolsa Brasil Balcão. Motivation The technical Fibonacci retraction indicator for many is essential and the basis for all market movement forecasts. The name of the tool comes from the Italian mathematician Leonardo de Pisa (13th century). This DEMO version will work in Meta Trader with Demo and Strategy Tester. To purchase the Full version that works on a Real account, click on: https://www.mql5.com/en/market/product/38089
FREE
Auto Fib Retracements
Ross Adam Langlands Nelson
4.2 (5)
Automatic Fibonacci Retracement Line Indicator. This indicator takes the current trend and if possible draws Fibonacci retracement lines from the swing until the current price. The Fibonacci levels used are: 0%, 23.6%, 38.2%, 50%, 61.8%, 76.4%, 100%. This indicator works for all charts over all timeframes. The Fibonacci levels are also recorded in buffers for use by other trading bots. Any comments, concerns or additional feature requirements are welcome and will be addressed promptly. 
FREE
DailySessions
Davide Zunino
4.67 (6)
The indicator represents the session boxes for the Asian, European and American sessions. It is possible to change the time of each session, such as color. It is also possible to disable the display of each session. You will find in input parameters variables to modify in format hh:mm. In Colors tab you can change the color of boxes of each sessions. If you need some implementations please contact me.
FREE
Pivot Point Supertrend (corresponds to Pivot Point Super Trend indicator from Trading View) Pivot Point Period:    Pivot point defined as highest high and highest low... input 2 = defining highest high and highest low with 2 bars on each side which are lower (for highest high) and are higher (for lowest low calculation) ATR Length  : the  ATR  calculation is based on 10 periods ATR Factor: ATR multiplied by 3
FREE
Whether you're an analyst looking for a Fibonacci charting platform for Fibonacci Ratio analysis, or a trader looking for an advanced Fibonacci trading tool, Ultimate Fibonacci  has what you need. Ultimate Fibonacci   has the most advanced and full-featured Fibonacci charting and trading software on the market. GIVE ME A GOOD RATING! Ultimate Fibonacci  measures and calculates Fibonacci projections and Retracement levels for you, as well as Price projections (like Wave 2 vs. 1 or Wave 4 vs. 2
FREE
Le Capteur de Tendance : La Stratégie du Capteur de Tendance avec Indicateur d'Alerte est un outil d'analyse technique polyvalent qui aide les traders à identifier les tendances du marché et les points d'entrée et de sortie potentiels. Elle présente une stratégie dynamique de Capteur de Tendance, s'adaptant aux conditions du marché pour une représentation visuelle claire de la direction de la tendance. Les traders peuvent personnaliser les paramètres selon leurs préférences et leur tolérance
FREE
Necessary for traders: tools and indicators Waves automatically calculate indicators, channel trend trading Perfect trend-wave automatic calculation channel calculation , MT4 Perfect trend-wave automatic calculation channel calculation , MT5 Local Trading copying Easy And Fast Copy , MT4 Easy And Fast Copy , MT5 Local Trading copying For DEMO Easy And Fast Copy , MT4 DEMO Easy And Fast Copy , MT5 DEMO The homeopathic indicator is also called the CCI indicator. The CCI indicator was propos
FREE
Pivot Point Fibo RSJ est un indicateur qui trace les lignes de support et de résistance de la journée en utilisant les taux de Fibonacci. Cet indicateur spectaculaire crée jusqu'à 7 niveaux de support et de résistance via Pivot Point en utilisant les taux de Fibonacci. C'est fantastique de voir comment les prix respectent chaque niveau de ce support et de cette résistance, où il est possible de percevoir les points d'entrée/sortie possibles d'une opération. Caractéristiques Jusqu'à 7 nive
FREE
Les acheteurs de ce produit ont également acheté
TPSpro RFI Levels MT5
Roman Podpora
4.73 (11)
INSTRUCTIONS       RUS   -   ANGLAIS       Il   est recommandé de l'utiliser avec un indicateur       -       TPSpro   TENDANCE PRO -   Version MT4         Un élément clé du trading est constitué par les zones ou les niveaux à partir desquels les décisions d'achat ou de vente d'un instrument de trading sont prises. Malgré les tentatives des principaux acteurs de dissimuler leur présence sur le marché, ils laissent inévitablement des traces. Notre tâche était d'apprendre à identifier ces traces
TPSproTREND PrO MT5
Roman Podpora
4.89 (9)
TPSpro TREND PRO  - is a trend indicator that automatically analyzes the market and provides information about the trend and each of its changes, as well as giving signals for entering trades without redrawing! The indicator uses each candle, analyzing them separately. referring to different impulses - up or down impulse. Exact entry points into transactions for currencies, crypto, metals, stocks, indices!  Version MT4               DETAILED DESCRIPTION               R ecommended to use with an
Atomic Analyst MT5
Issam Kassas
4.42 (19)
Tout d'abord, il convient de souligner que cet indicateur de trading n'est ni repainting, ni redrawing et ne présente aucun délai, ce qui le rend idéal à la fois pour le trading manuel et automatisé. Manuel de l'utilisateur : réglages, entrées et stratégie. L'Analyste Atomique est un indicateur d'action sur les prix PA qui utilise la force et le momentum du prix pour trouver un meilleur avantage sur le marché. Équipé de filtres avancés qui aident à éliminer les bruits et les faux signaux, et à
Atbot
Zaha Feiz
4.91 (34)
AtBot : Comment ça fonctionne et comment l'utiliser ### Comment ça fonctionne L'indicateur "AtBot" pour la plateforme MT5 génère des signaux d'achat et de vente en utilisant une combinaison d'outils d'analyse technique. Il intègre la Moyenne Mobile Simple (SMA), la Moyenne Mobile Exponentielle (EMA) et l'indice de la Plage Vraie Moyenne (ATR) pour identifier les opportunités de trading. De plus, il peut utiliser des bougies Heikin Ashi pour améliorer la précision des signaux. Laissez un avis ap
Gold Stuff mt5
Vasiliy Strukov
4.92 (165)
Gold Stuff mt5 est un indicateur de tendance conçu spécifiquement pour l'or et peut également être utilisé sur n'importe quel instrument financier. L'indicateur ne se redessine pas et ne traîne pas. Délai recommandé H1. Contactez-moi immédiatement après l'achat pour obtenir les réglages et un bonus personnel !   Vous pouvez obtenir une copie gratuite de notre indicateur Strong Support et Trend Scanner, veuillez envoyer un message privé. moi!   RÉGLAGES Dessiner la flèche - on off. dessine
Tout d'abord, il convient de souligner que ce système de trading est un indicateur non repeint, non redessiné et non retardé, ce qui le rend idéal pour le trading manuel et automatisé. Cours en ligne, manuel et téléchargement de préréglages. Le "Système de Trading Smart Trend MT5" est une solution de trading complète conçue pour les traders débutants et expérimentés. Il combine plus de 10 indicateurs premium et propose plus de 7 stratégies de trading robustes, ce qui en fait un choix polyvalent
Quantum Trend Sniper
Bogdan Ion Puscasu
4.8 (49)
Présentation       Quantum Trend Sniper Indicator   , l'indicateur révolutionnaire MQL5 qui transforme la façon dont vous identifiez et négociez les inversions de tendance ! Développé par une équipe de traders expérimentés avec une expérience commerciale de plus de 13 ans,       Indicateur Quantum Trend Sniper       est conçu pour propulser votre parcours de trading vers de nouveaux sommets grâce à sa manière innovante d'identifier les inversions de tendance avec une précision extrêmement élevée
Ce tableau de bord affiche les derniers   modèles harmoniques   disponibles pour les symboles sélectionnés, ce qui vous permettra de gagner du temps et d'être plus efficace /   version MT4 . Indicateur gratuit:   Basic Harmonic Pattern Colonnes de l'indicateur Symbol :   les symboles sélectionnés apparaissent Trend   :   haussière ou baissière Pattern :   type de motif (gartley, papillon, chauve-souris, crabe, requin, cypher ou ABCD) Entry:   prix d'entrée SL:   prix du stop loss TP1:   1
FX Power MT5 NG
Daniel Stein
5 (5)
Obtenez votre mise à jour quotidienne du marché avec des détails et des captures d'écran via notre Morning Briefing ici sur mql5 et sur Telegram ! FX Power MT5 NG est la nouvelle génération de notre très populaire indicateur de force des devises, FX Power. Et qu'est-ce que ce compteur de force de nouvelle génération offre ? Tout ce que vous avez aimé de l'original FX Power PLUS Analyse de la force de l'OR/XAU Des résultats de calcul encore plus précis Périodes d'analyse configurables individuel
Trend Screener Pro MT5
STE S.S.COMPANY
4.87 (63)
Indicateur de tendance, solution unique révolutionnaire pour le trading et le filtrage des tendances avec toutes les fonctionnalités de tendance importantes intégrées dans un seul outil ! Il s'agit d'un indicateur multi-période et multi-devises 100 % non repeint qui peut être utilisé sur tous les symboles/instruments : forex, matières premières, crypto-monnaies, indices et actions. Trend Screener est un indicateur de suivi de tendance efficace qui fournit des signaux de tendance fléchés avec des
Tout d'abord, il convient de souligner que cet outil de trading est un indicateur non repeint, non redessiné et non retardé, ce qui le rend idéal pour le trading professionnel. Cours en ligne, manuel utilisateur et démonstration. L'indicateur Smart Price Action Concepts est un outil très puissant à la fois pour les nouveaux et les traders expérimentés. Il regroupe plus de 20 indicateurs utiles en un seul, combinant des idées de trading avancées telles que l'analyse du trader Inner Circle et
AT Forex Indicator MT5
Marzena Maria Szmit
5 (4)
The AT Forex Indicator MT5 is a sophisticated trading tool designed to provide traders with a comprehensive analysis of multiple currency pairs. This powerful indicator simplifies the complex nature of the forex market, making it accessible for both novice and experienced traders. AT Forex Indicator uses advanced algorithms to detect trends, patterns and is an essential tool for traders aiming to enhance their forex trading performance. With its robust features, ease of use, and reliable signal
TrendMaestro5
Stefano Frisetti
note: this indicator is for METATRADER4, if you want the version for METATRADER5 this is the link:  https://www.mql5.com/it/market/product/108106 TRENDMAESTRO ver 2.4 TRENDMAESTRO recognizes a new TREND in the bud, he never makes mistakes. The certainty of identifying a new TREND is priceless. DESCRIPTION TRENDMAESTRO identifies a new TREND in the bud, this indicator examines the volatility, volumes and momentum to identify the moment in which there is an explosion of one or more of these data a
ATrend
Zaha Feiz
4.8 (5)
ATREND ATREND : Comment ça fonctionne et comment l'utiliser Comment ça fonctionne L'indicateur "ATREND" pour la plateforme MT5 est conçu pour fournir aux traders des signaux d'achat et de vente robustes en utilisant une combinaison de méthodologies d'analyse technique. Cet indicateur s'appuie principalement sur la plage vraie moyenne (ATR) pour mesurer la volatilité, ainsi que sur des algorithmes de détection de tendance pour identifier les mouvements potentiels du marché. Laissez un message ap
TPA True Price Action indicator reveals the true price action of the market makers through 100% non-repainting signals strictly at the close of a candle! TPA shows entries and re-entries, every time the bulls are definitely stronger than the bears and vice versa. Not to confuse with red/green candles. The shift of power gets confirmed at the earliest stage and is ONE exit strategy of several. There are available now two free parts of the TPA User Guide for our customers. The first "The Basics"
FxaccurateLS
Shiv Raj Kumawat
WHY IS OUR FXACCCURATE LS MT5 THE PROFITABLE ? PROTECT YOUR CAPITAL WITH RISK MANAGEMENT Gives entry, stop and target levels from time to time. It finds Trading opportunities by analyzing what the price is doing during established trends. POWERFUL INDICATOR FOR A RELIABLE STRATEGIES We have made these indicators with a lot of years of hard work. It is made at a very advanced level. Established trends provide dozens of trading opportunities, but most trend indicators completely ignore them!
Auto Order Block with break of structure based on ICT and Smart Money Concepts (SMC) Futures Break of Structure ( BoS )             Order block ( OB )            Higher time frame Order block / Point of Interest ( POI )    shown on current chart           Fair value Gap ( FVG ) / Imbalance   -  MTF      ( Multi Time Frame )    HH/LL/HL/LH  -  MTF      ( Multi Time Frame )  Choch  MTF      ( Multi Time Frame )  Volume Imbalance     ,  MTF          vIMB Gap’s Power of 3 Equal High
Advanced Supply Demand MT5
Bernhard Schweigert
4.5 (14)
La meilleure solution pour tout commerçant débutant ou expert ! Cet indicateur est un outil de trading unique, de haute qualité et abordable car nous avons intégré un certain nombre de fonctionnalités propriétaires et une nouvelle formule. Avec cette mise à jour, vous pourrez afficher des zones à double horaire. Vous pourrez non seulement afficher un TF plus élevé, mais afficher les deux, le graphique TF, PLUS le TF supérieur : AFFICHAGE DES ZONES NICHÉES. Tous les traders Supply Demand vont ado
ICT, SMC, SMART MONEY CONCEPTS, SMART MONEY, Smart Money Concept, Support and Resistance, Trend Analysis, Price Action, Market Structure, Order Blocks, BOS/CHoCH,   Breaker Blocks ,  Momentum Shift,   Supply&Demand Zone/Order Blocks , Strong Imbalance,   HH/LL/HL/LH,    Fair Value Gap, FVG,  Premium  &   Discount   Zones, Fibonacci Retracement, OTE, Buy Side Liquidity, Sell Side Liquidity, BSL/SSL Taken, Equal Highs & Lows, MTF Dashboard, Multiple Time Frame, BigBar, HTF OB, HTF Market Structure
ICT, SMC, Smart Money Concept, Support and Resistance, Trend Analysis, Price Action, Market Structure, Order Blocks, Breaker Blocks, Momentum Shift, Strong Imbalance, HH/LL/HL/LH, Fair Value Gap, FVG, Premium & Discount Zones, Fibonacci Retracement, OTE, Buyside Liquidity, Sellside Liquidity, Liquidity Voids, Market Sessions, NDOG, NWOG,Silver Bullet,ict template Dans le marché financier, une analyse de marché précise est cruciale pour les investisseurs. Pour aider les investisseurs à mieux c
Black Dragon indicator mt5
Ramil Minniakhmetov
4.81 (53)
L'indicateur de détection de tendance complétera n'importe quelle stratégie et peut également être utilisé comme un outil indépendant. IMPORTANT! Contactez-moi immédiatement après l'achat pour obtenir des instructions et un bonus !   Avantages Facile à utiliser; ne surcharge pas le graphique avec des informations inutiles. La possibilité d'utiliser comme filtre pour n'importe quelle stratégie. Contient des niveaux dynamiques de cupport et de resistange, qui peuvent être utilisés à la fois
Top indicator for MT5   providing accurate signals to enter a trade without repainting! It can be applied to any financial assets:   forex, cryptocurrencies, metals, stocks, indices .  Watch  the video  (6:22) with an example of processing only one signal that paid off the indicator! MT4 version is here It will provide pretty accurate trading signals and tell you when it's best to open a trade and close it. Most traders improve their trading results during the first trading week with the help of
Matrix Arrow Indicator MT5
Juvenille Emperor Limited
5 (12)
Matrix Arrow Indicator MT5   est une tendance unique 10 en 1 suivant un indicateur multi-période   100% non repeint   qui peut être utilisé sur tous les symboles/instruments:   forex ,   matières premières ,   crypto-monnaies ,   indices ,  actions .  Matrix Arrow Indicator MT5  déterminera la tendance actuelle à ses débuts, en rassemblant des informations et des données à partir d'un maximum de 10 indicateurs standard, qui sont: Indice de mouvement directionnel moyen (ADX) Indice de canal de m
IX Power MT5
Daniel Stein
4.17 (6)
IX Power   apporte enfin la précision imbattable de FX Power aux symboles non-Forex. Il détermine avec précision l'intensité des tendances à court, moyen et long terme de vos indices, actions, matières premières, ETF et même crypto-monnaies préférés. Vous pouvez   analyser tout ce que   votre terminal a à offrir. Essayez-le et découvrez comment   votre timing s'améliore considérablement   lors de vos transactions. Caractéristiques principales d'IX Power Résultats de calcul précis à 100 %,
Blahtech Supply Demand MT5
Blahtech Limited
4.54 (13)
Was: $299  Now: $99   Supply Demand uses previous price action to identify potential imbalances between buyers and sellers. The key is to identify the better odds zones, not just the untouched ones. Blahtech Supply Demand indicator delivers functionality previously unavailable on any trading platform. This 4-in-1 indicator not only highlights the higher probability zones using a multi-criteria strength engine, but also combines it with multi-timeframe trend analysis, previously confirmed swings
** All Symbols x All Timeframes scan just by pressing scanner button ** *** Contact me  to send you instruction and add you in "123 scanner group" for sharing or seeing experiences with other users. After 17 years of experience in the markets and programming, Winner indicator is ready. I would like to share with you! Introduction The 123 Pattern Scanner indicator with a special enhanced algorithm is a very repetitive common pattern finder with a high success rate . Interestingly, this Winner in
Stratos Pali mt5
Michela Russo
5 (1)
Stratos Pali Indicator is a revolutionary tool designed to enhance your trading strategy by accurately identifying market trends. This sophisticated indicator uses a unique algorithm to generate a complete histogram, which records when the trend is Long or Short. When a trend reversal occurs, an arrow appears, indicating the new direction of the trend. Important Information Revealed Leave a review and contact me via mql5 message to receive My Top 5 set files for Stratos Pali at no cost ! Do
Was: $249  Now: $99   Market Profile defines a number of day types that can help the trader to determine market behaviour. A key feature is the Value Area, representing the range of price action where 70% of trading took place. Understanding the Value Area can give traders valuable insight into market direction and establish the higher odds trade. It is an excellent addition to any system you may be using. Inspired by Jim Dalton’s book “Mind Over Markets”, this indicator is designed to suit the
PZ Swing Trading MT5
PZ TRADING SLU
5 (4)
Protect against whipsaws: revolutionize your swing trading approach Special Offer: Purchase now to receive free bonuses worth $135! (Read more for details) Swing Trading is the first indicator designed to detect swings in the direction of the trend and possible reversal swings. It uses the baseline swing trading approach, widely described in trading literature. The indicator studies several price and time vectors to track the aggregate trend direction and detects situations in which the market i
FX Volume MT5
Daniel Stein
4.93 (14)
Obtenez votre mise à jour quotidienne du marché avec des détails et des captures d'écran via notre Morning Briefing ici sur mql5 et sur Telegram ! FX Volume est le PREMIER et SEUL indicateur de volume qui fournit un VRAI aperçu du sentiment du marché du point de vue d'un courtier. Il fournit des informations impressionnantes sur la façon dont les acteurs institutionnels du marché, comme les courtiers, sont positionnés sur le marché des changes, bien plus rapidement que les rapports COT. Voir c
Plus de l'auteur
Overview : Introducing the Custom MACD Indicator for MetaTrader 5, inspired by the popular TradingView MACD but enhanced with additional features. This indicator provides traders with more flexibility and better visual cues for decision-making. Key Features : Custom Histogram Colors : Set your preferred color scheme for the MACD histogram to improve visibility and match your trading chart style. Recalculated Histogram Values : Get more accurate signals with our recalculated histogram values, des
FREE
Multi Indicator Divergence Finder Enhance your trading strategy with the Multi Indicator Divergence Finder! This versatile tool is engineered to help traders quickly and accurately identify both regular and hidden divergences across multiple popular indicators simultaneously, including RSI, MACD, CCI, Stochastic, MFI, and RVI. Experience real-time divergence detection with signals plotted directly on your charts. Key Features: Simultaneous Multi-Indicator Divergence Detection : Detect regular an
This powerful utility is designed to enhance your trading analysis by automatically identifying key support and resistance levels and detecting divergences on popular technical indicators such as the RSI (Relative Strength Index) and MACD (Moving Average Convergence Divergence). Key Features: Automatic Support and Resistance Plotting: The utility scans the chart for significant swing highs and lows, plotting precise support and resistance lines. These levels can help traders identify potential a
Filtrer:
Aucun avis
Répondre à l'avis