Gann Signal Scaner MT5
- Indicateurs
- Kirill Borovskii
- Version: 1.0
- Activations: 5
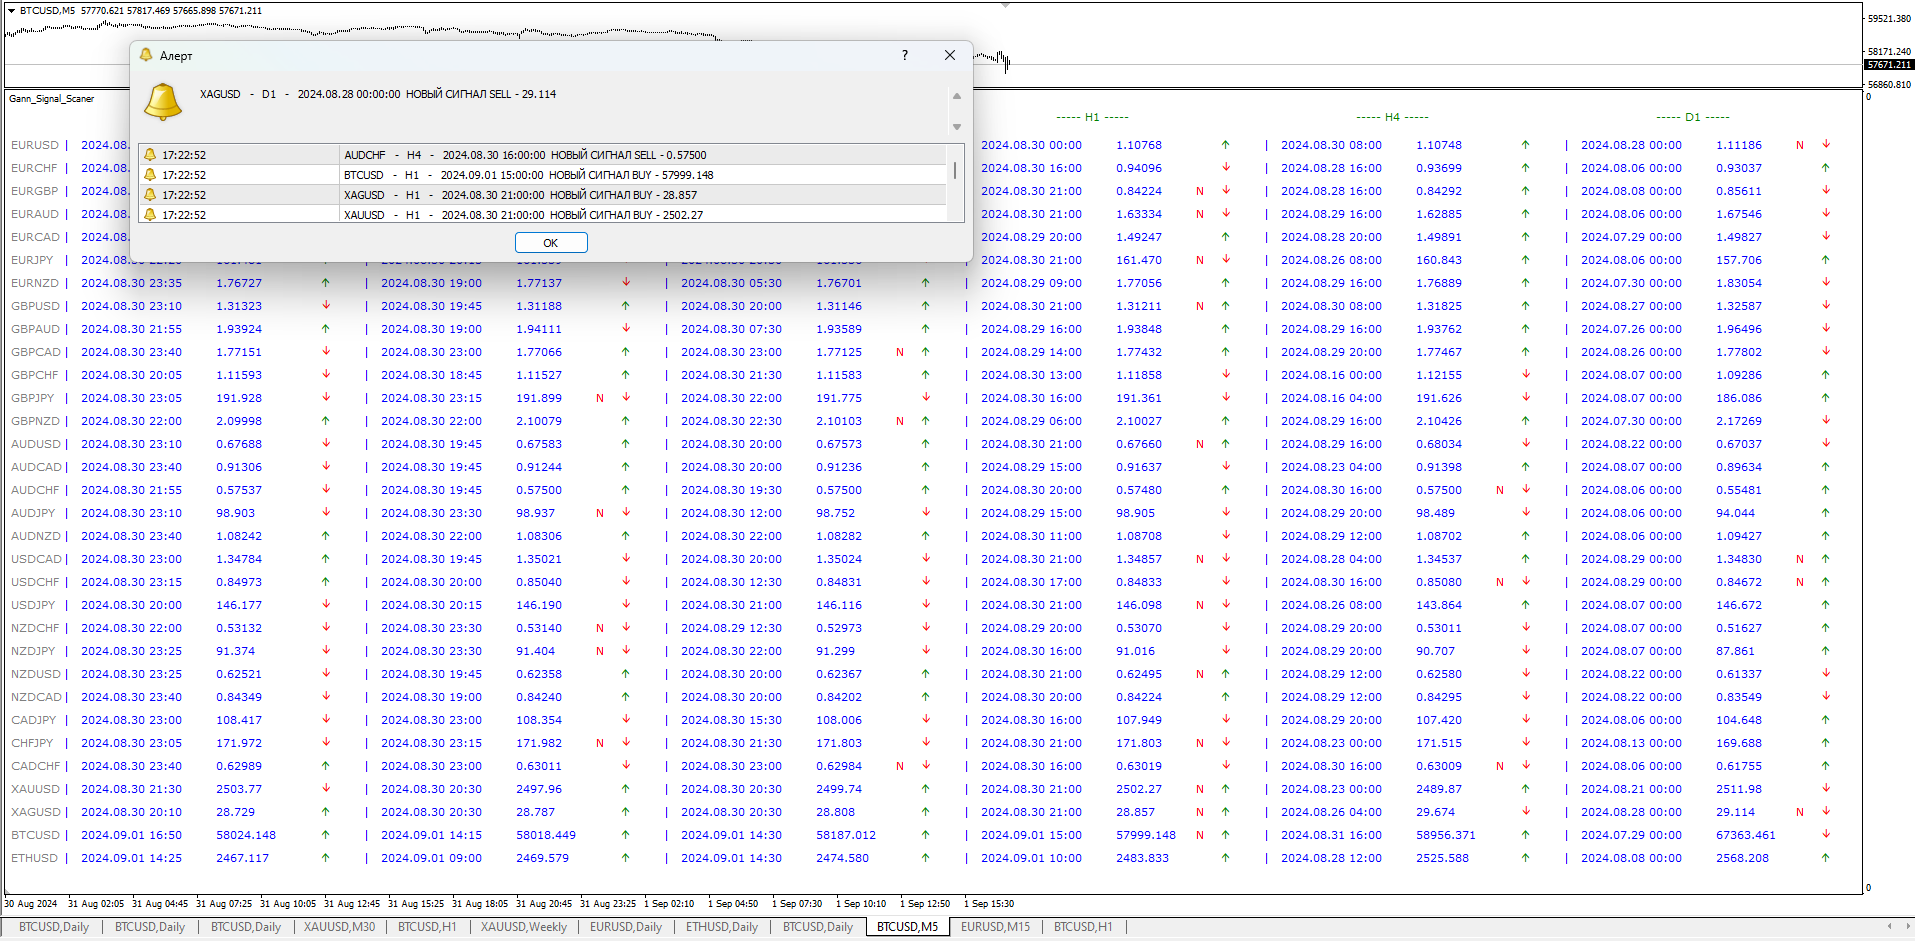
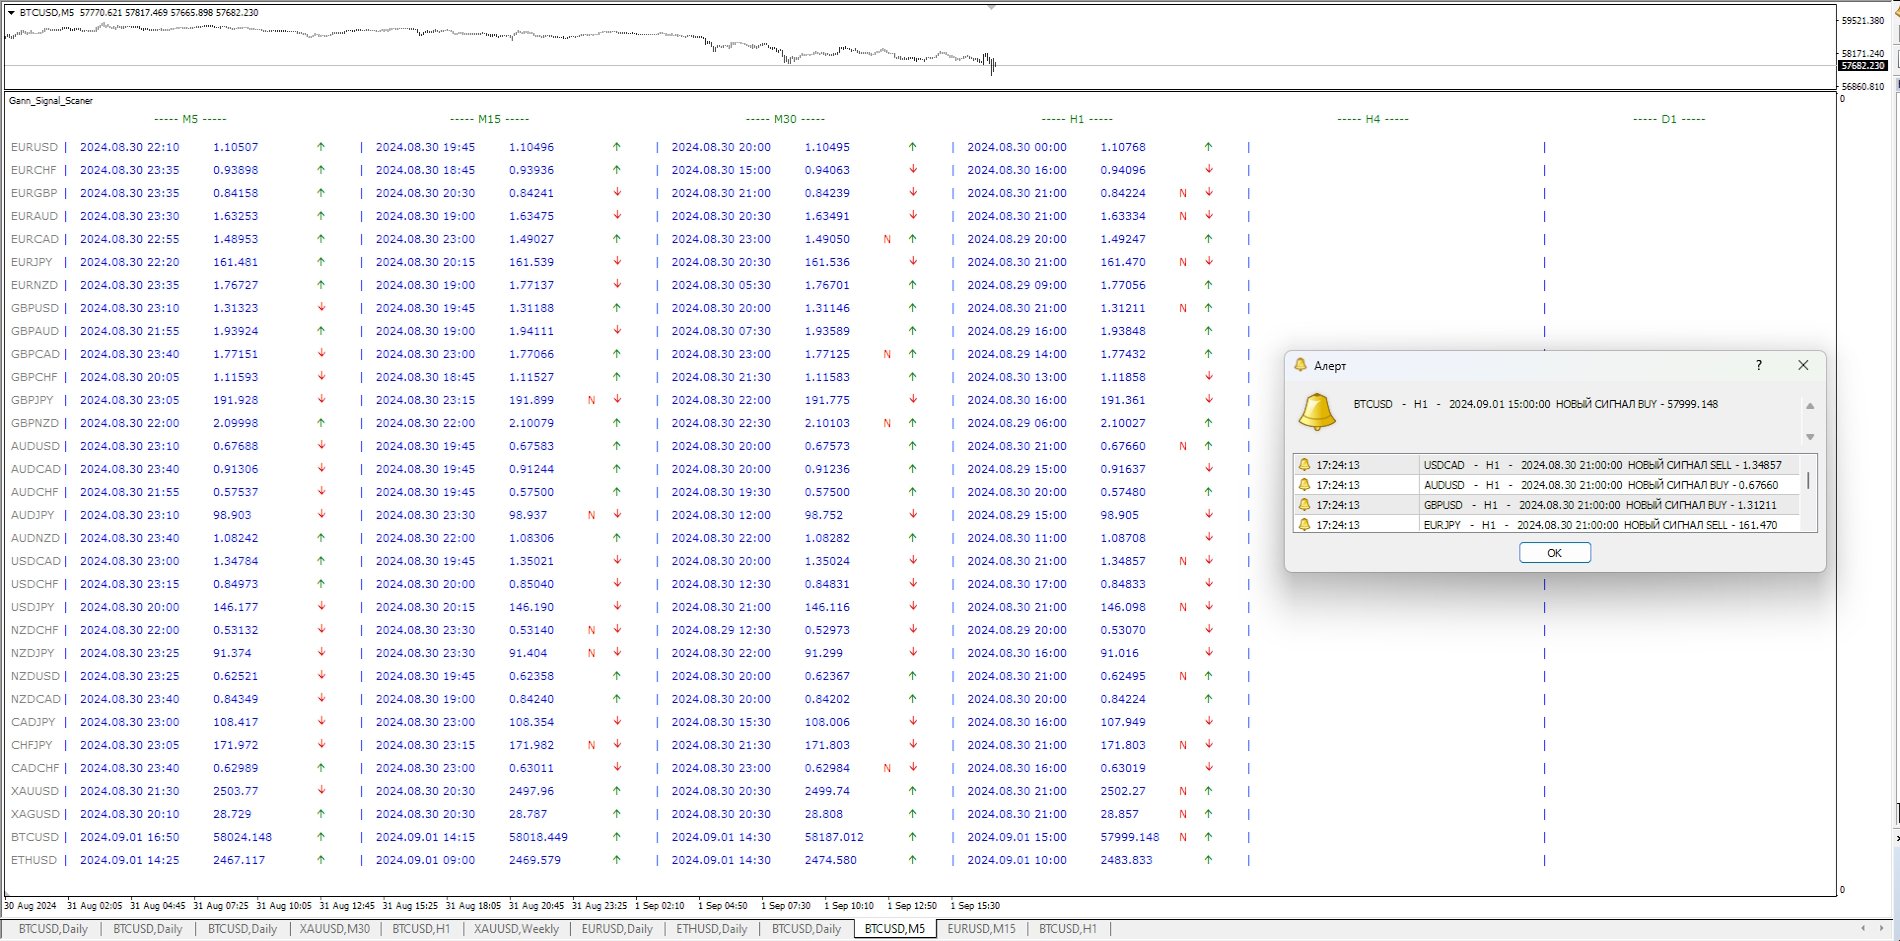
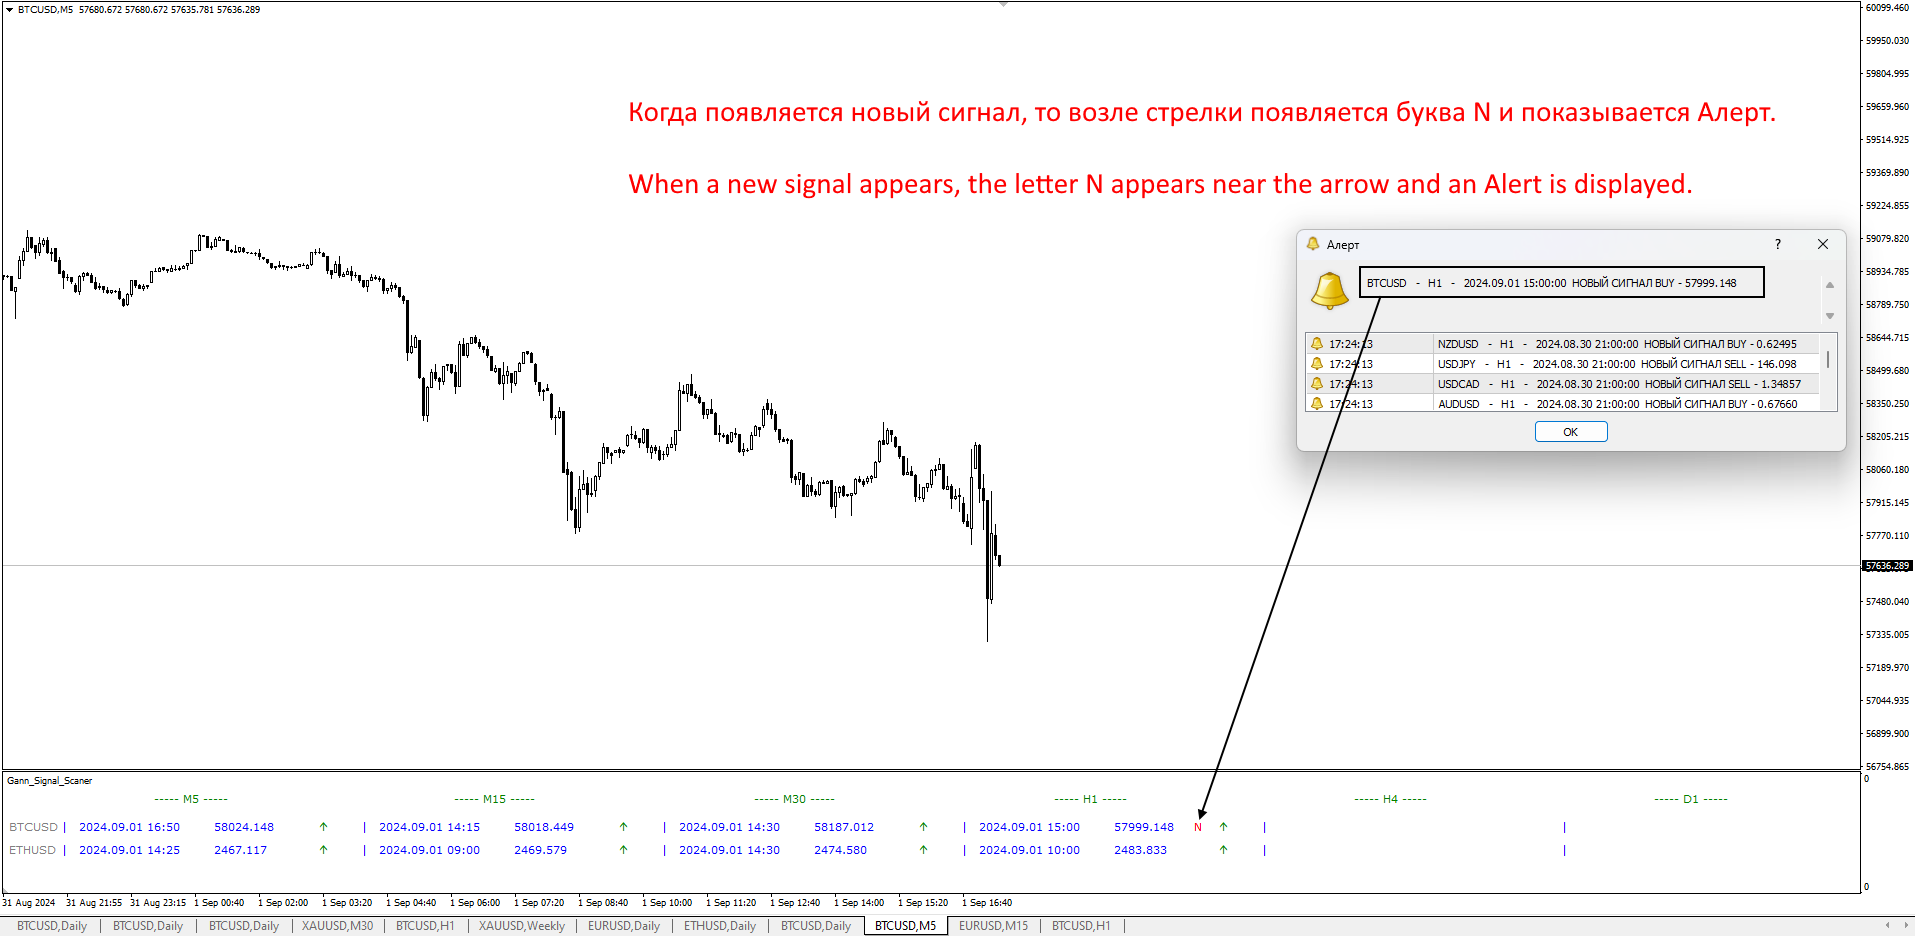
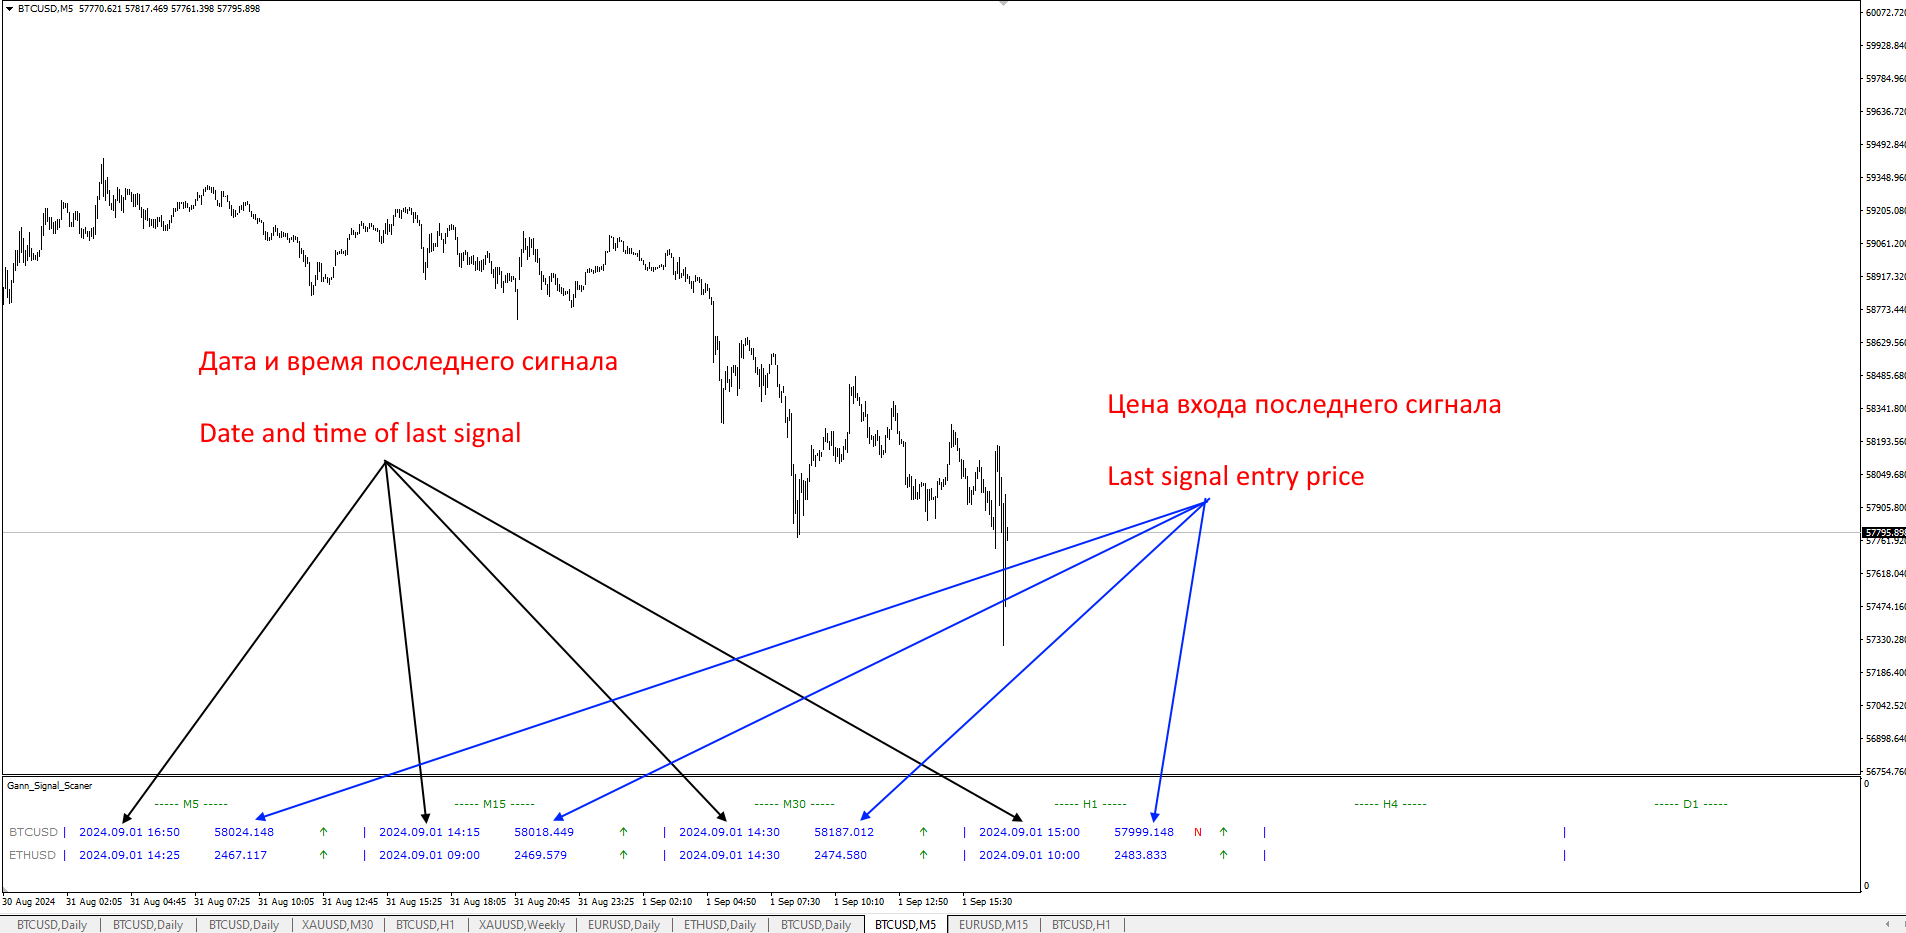
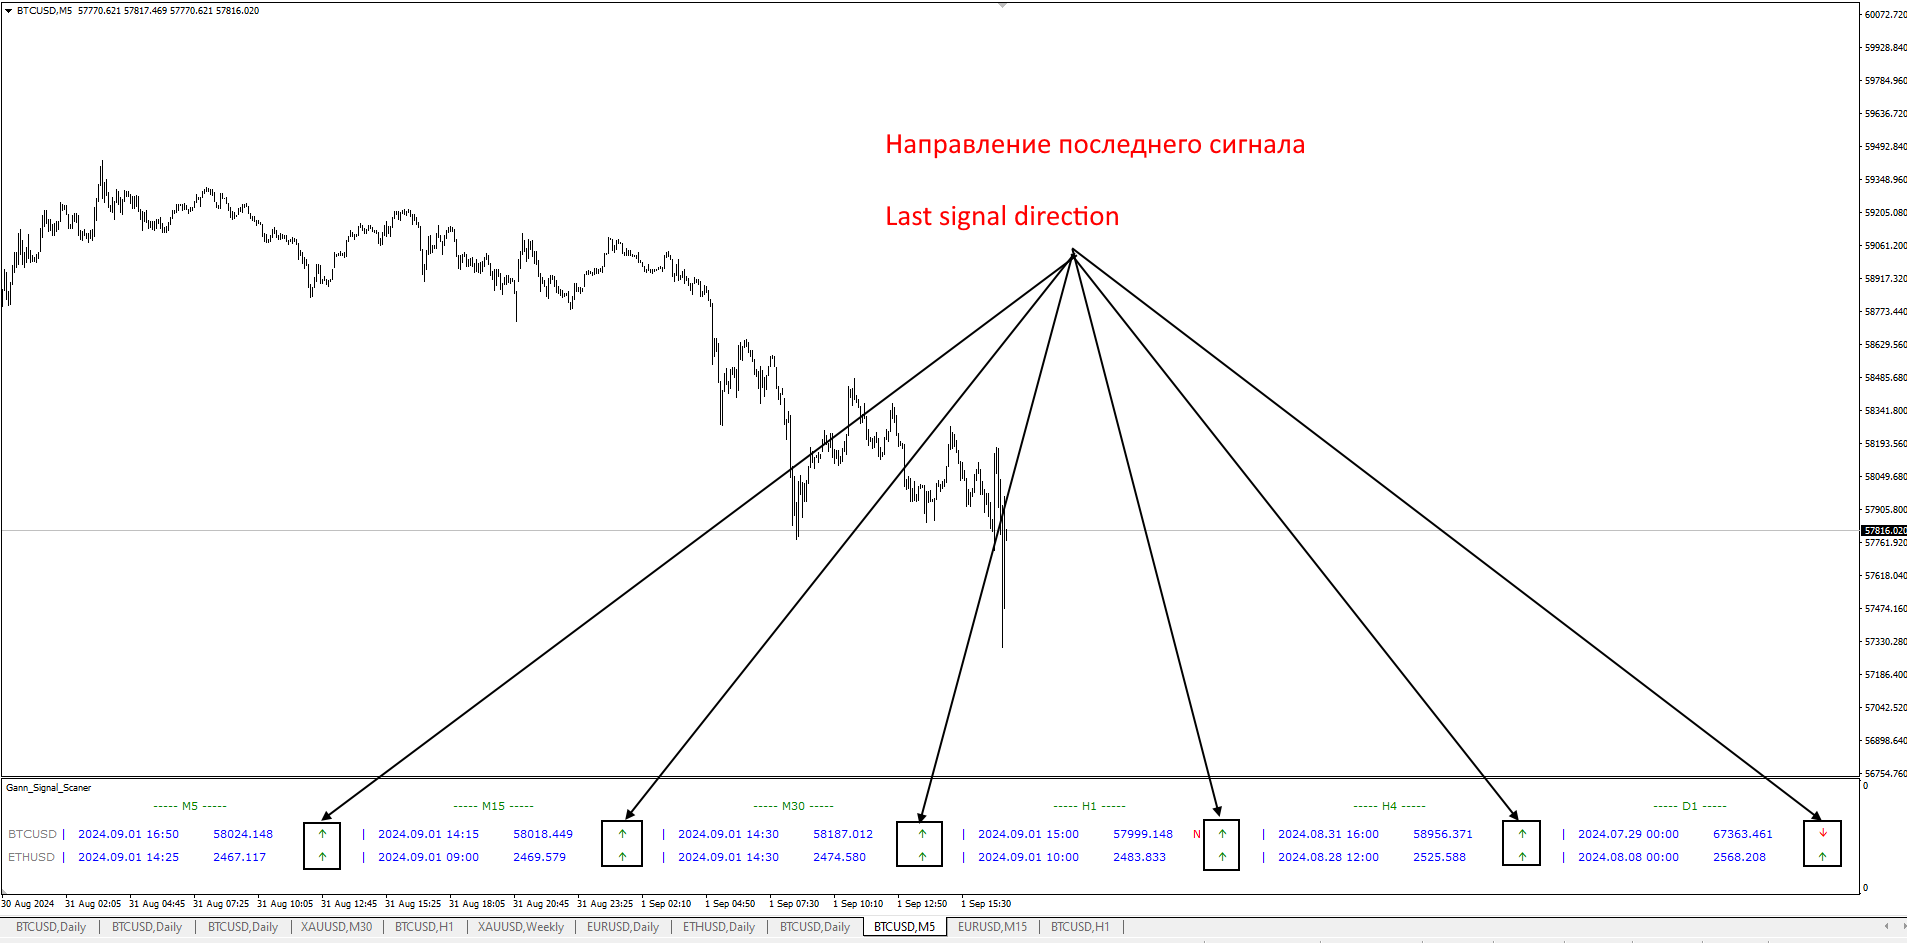
This indicator is based on the Gann Signal indicator and acts as a market scanner. All you need to do is fill in the selected currency pairs in the settings and that’s it. Next, the indicator itself will view all these currency pairs and time frames from M5 to D1 simultaneously. When a new signal appears, the indicator will give you an Alert and also draw the letter N where this new signal will be.