• Aperçu
  • Avis (1)
  • Commentaires (5)
  • Nouveautés

VolumeSecret

VolumeSecret : Le Pouvoir du Volume entre Vos Mains

Dans le monde complexe de la programmation, nous faisons constamment face à des obstacles qui nous poussent à grandir et à évoluer. Nous comprenons profondément les difficultés que le marché impose et comment les traders luttent pour atteindre une performance optimale. C’est pourquoi nous travaillons sans relâche sur des solutions innovantes pour rendre la prise de décision sur le marché plus fluide et précise.

VolumeSecret est le fruit de cet engagement. C’est un indicateur avancé qui combine l’analyse du volume avec une stratégie sophistiquée, offrant un avantage décisif à ceux qui cherchent à maîtriser le marché.

🔍 Qu'est-ce que VolumeSecret ?

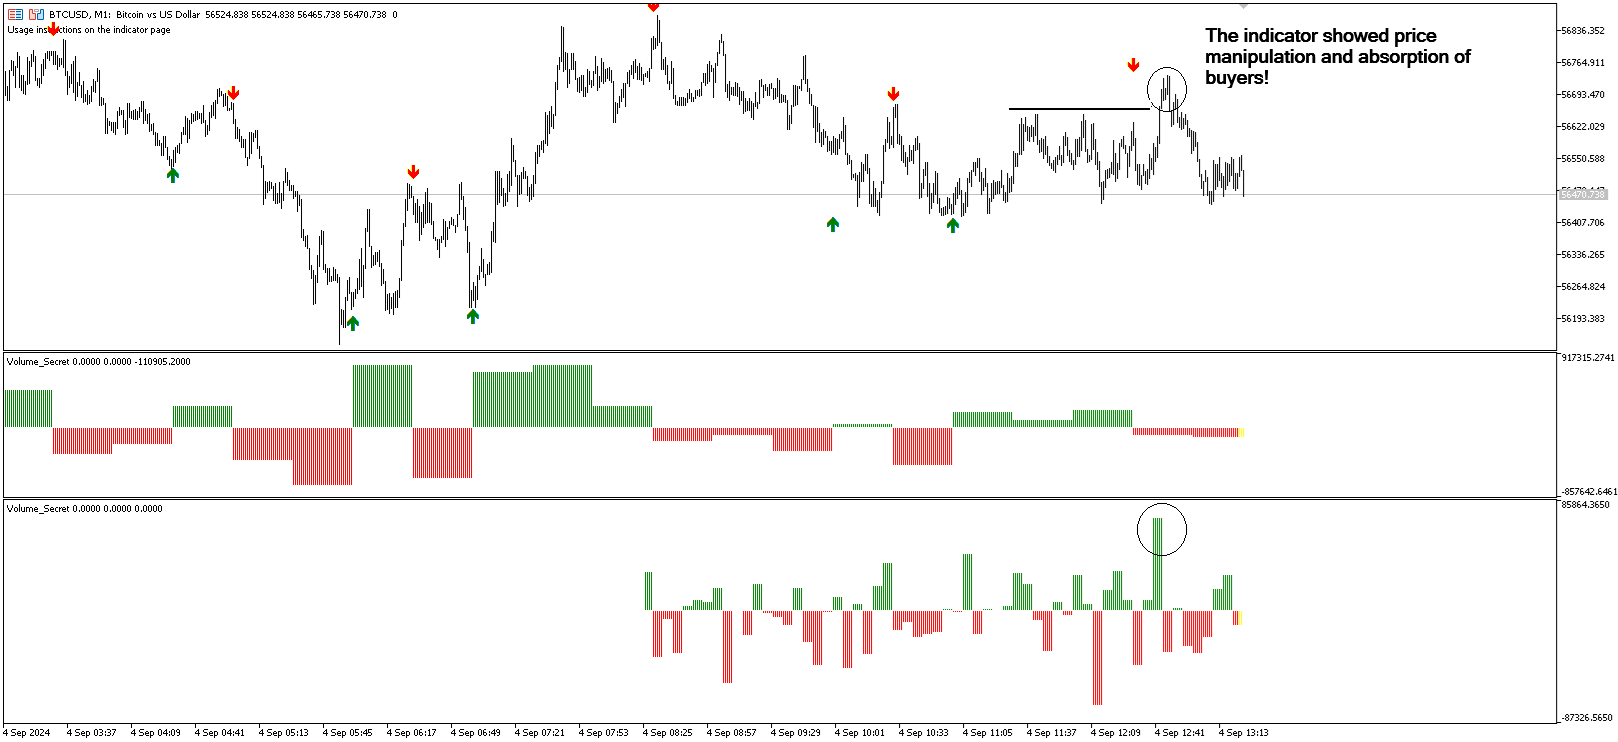
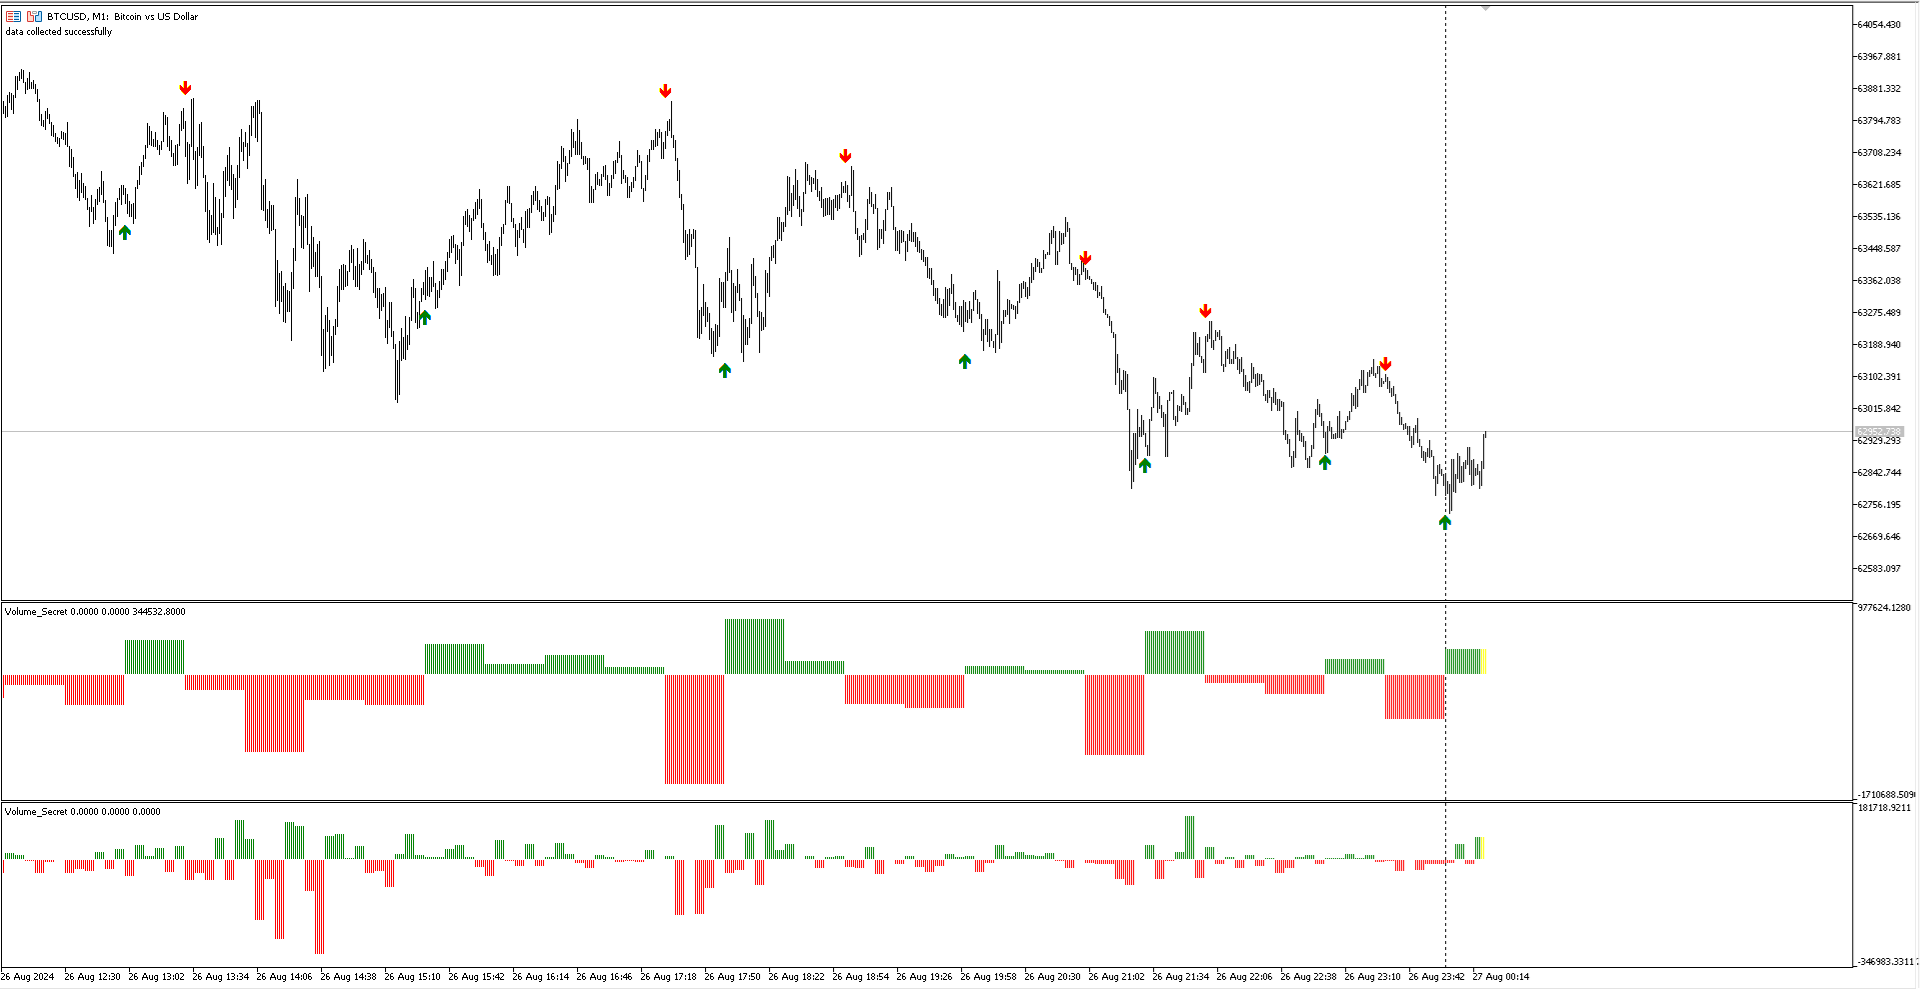
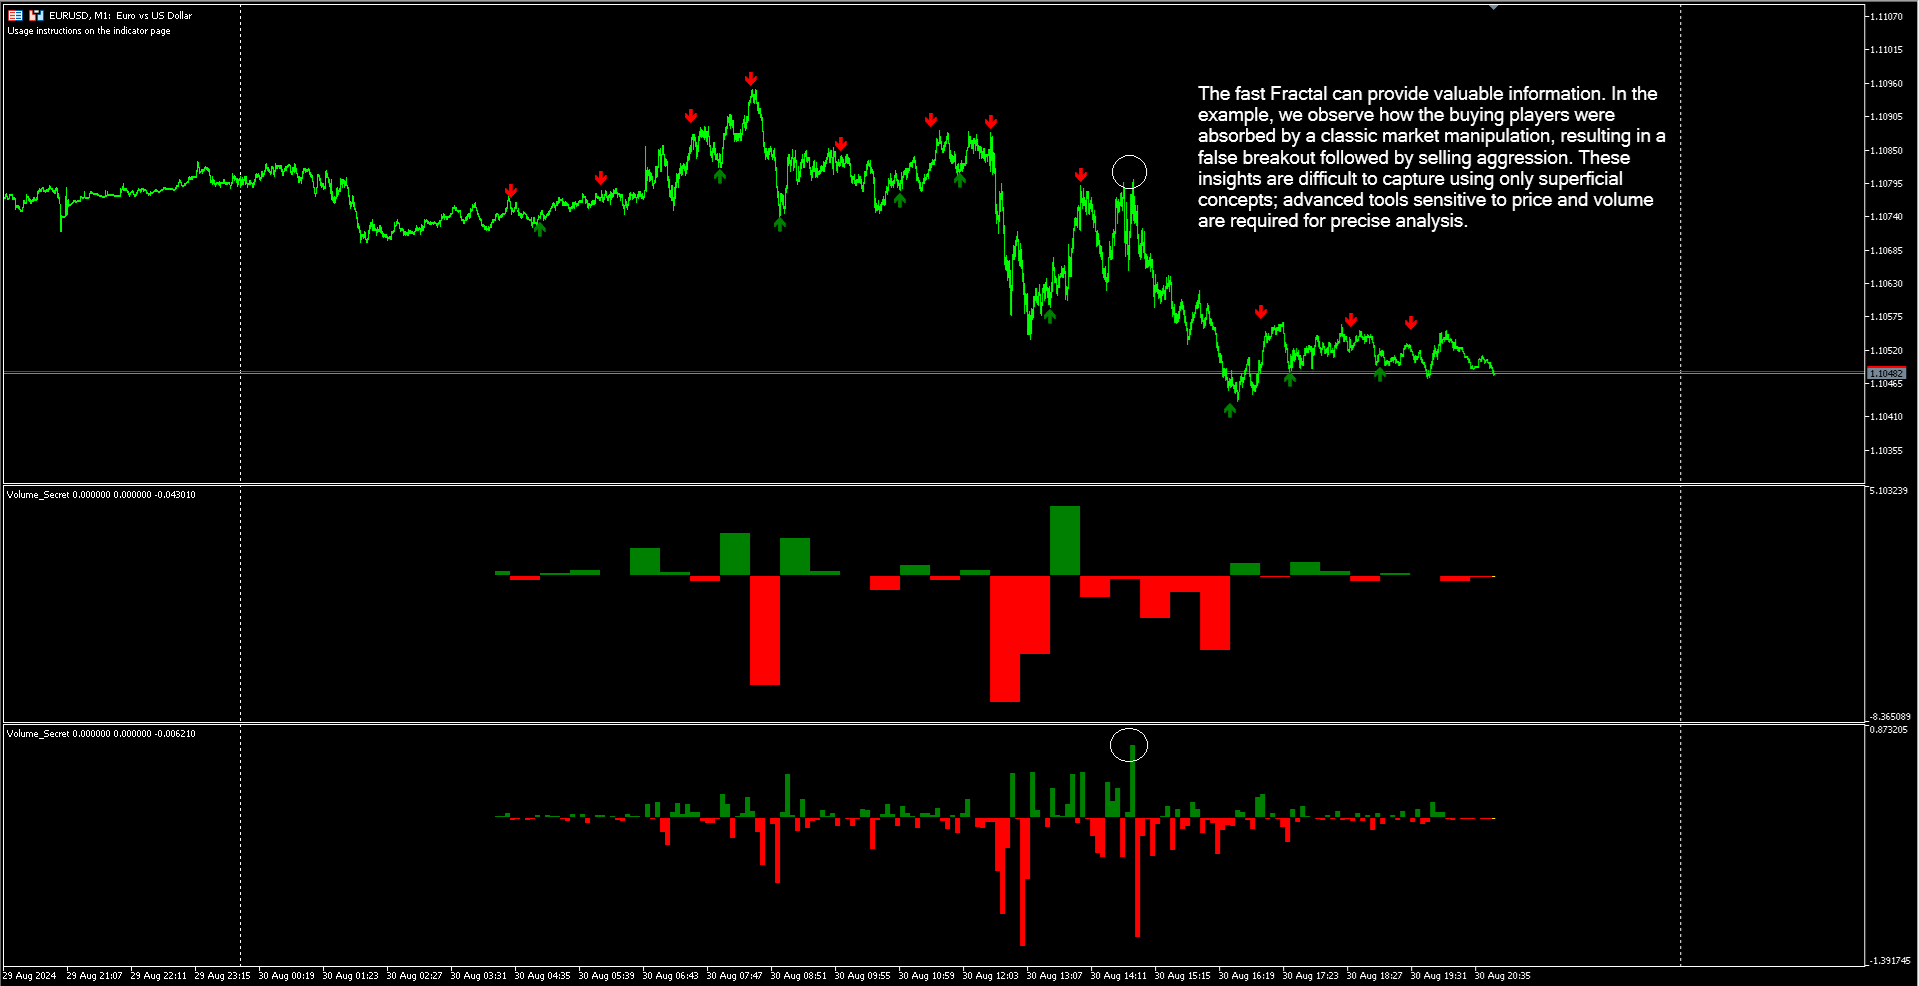
VolumeSecret est un indicateur technique de pointe conçu pour révéler les secrets cachés derrière les mouvements de prix. En utilisant l’analyse du volume comme guide, il aide à identifier les opportunités d’entrée et de sortie avec une grande précision. Il utilise la géométrie fractale et le volume pour fournir une lecture approfondie et détaillée de la dynamique du marché.

🚀 Avantages de VolumeSecret

  • Analyse Approfondie du Volume : Identifie les mouvements institutionnels et les flux de marché cachés.
  • Signaux Précis : Fournit des alertes claires et objectives pour optimiser vos transactions.
  • Stratégie Puissante : Combine le volume avec une méthodologie robuste pour maximiser le potentiel de profit.

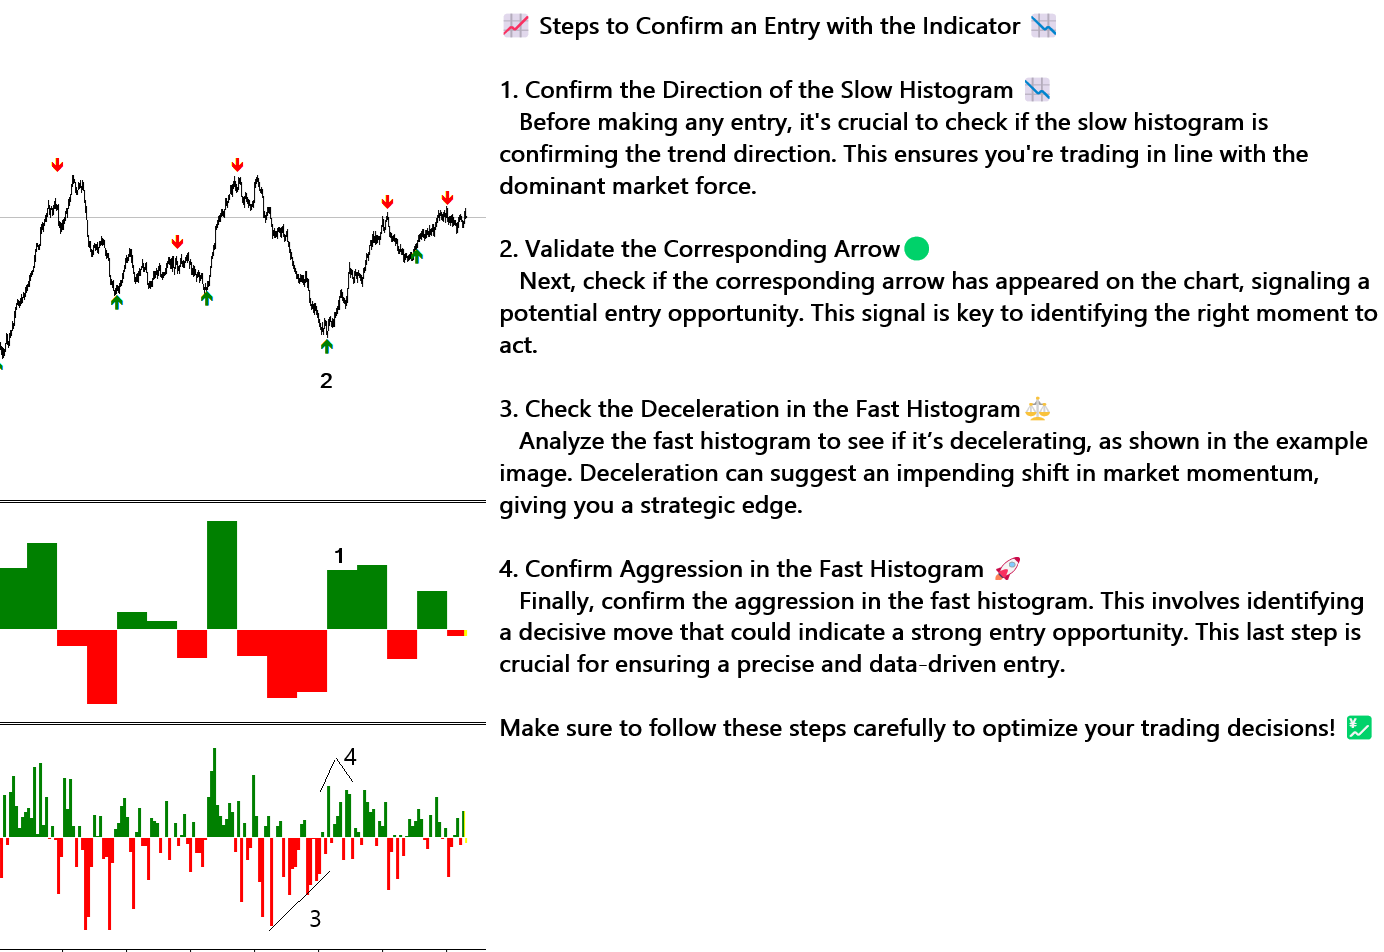
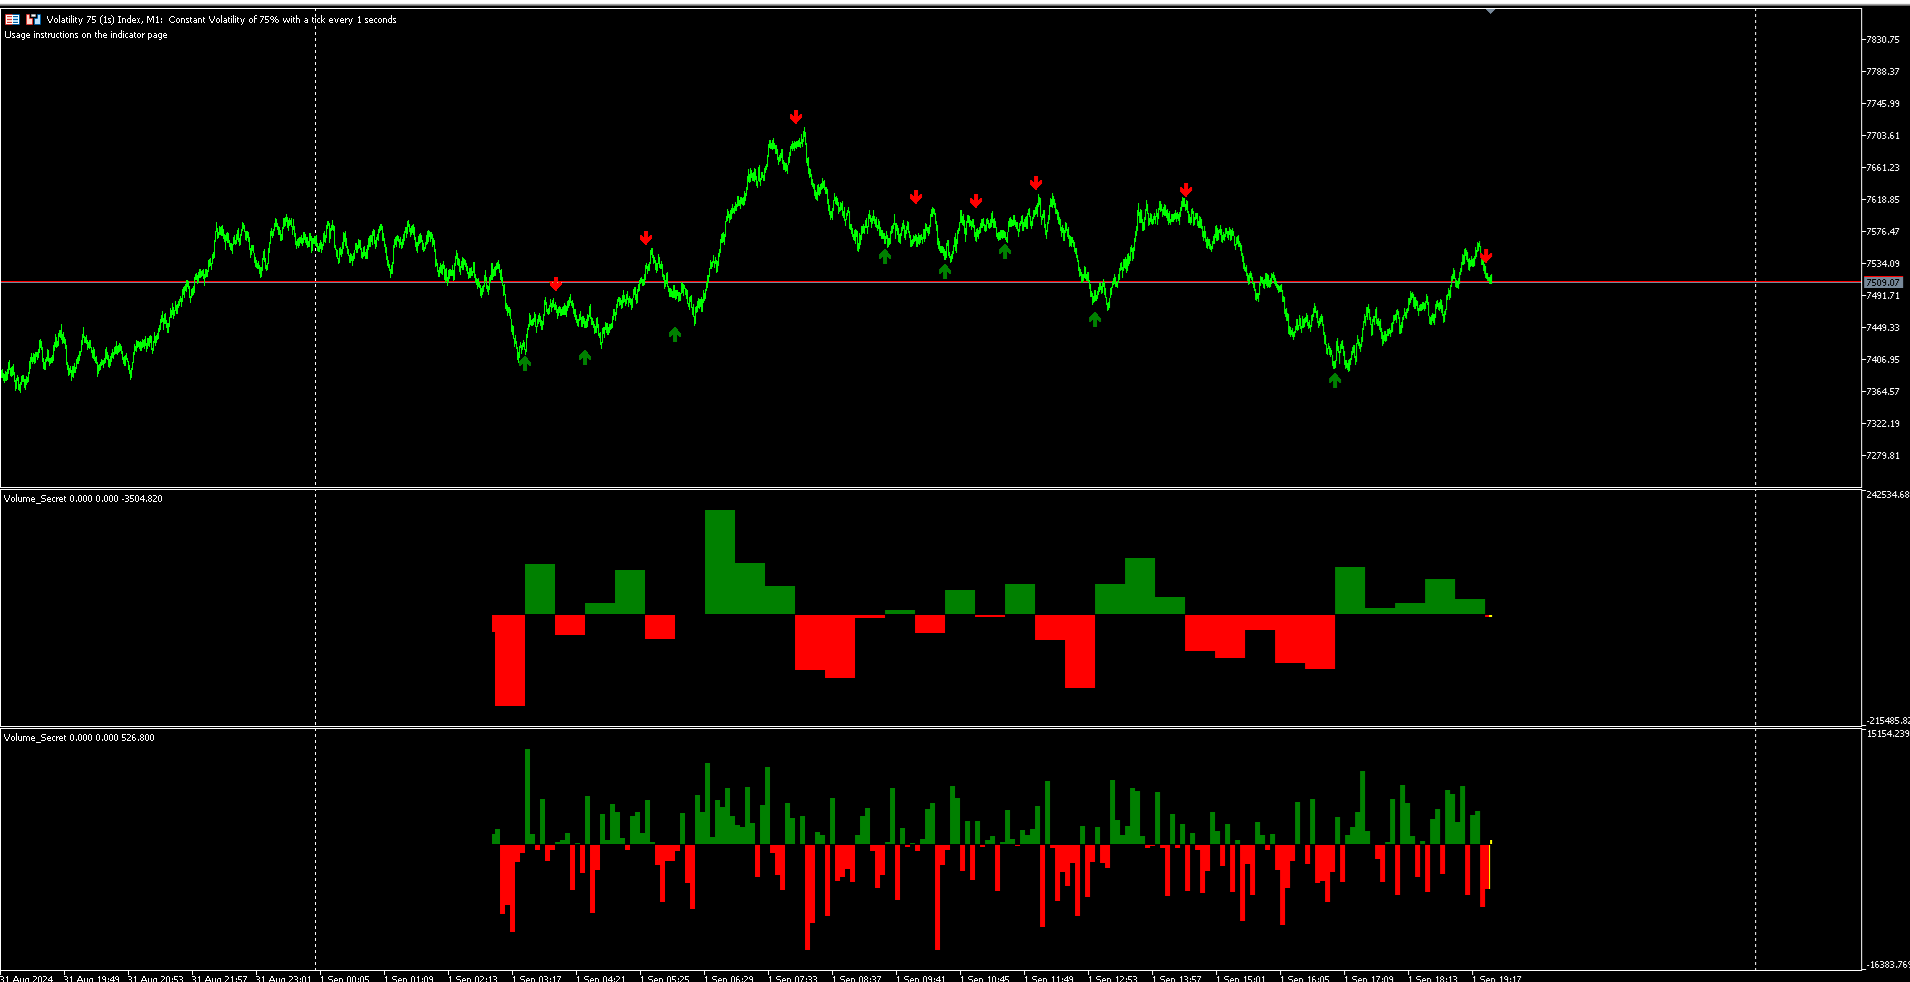
📈 Étapes pour Confirmer une Entrée avec VolumeSecret 📉

  1. Confirmer la Direction de l’Histogramme Lent 📉
    Avant d’effectuer une entrée, assurez-vous que l’histogramme lent confirme la direction de la tendance. Cela garantit que vous tradez en ligne avec la force dominante du marché.

  2. Valider la Flèche Correspondante 🟢
    Ensuite, vérifiez si la flèche correspondante est apparue sur le graphique, signalant une opportunité d’entrée potentielle. Ce signal est crucial pour identifier le bon moment pour agir.

  3. Vérifier la Décélération dans l’Histogramme Rapide ⚖️
    Analysez l’histogramme rapide, qui est utilisé sur un intervalle de temps plus court, pour détecter une éventuelle décélération. Cet histogramme montre de manière précoce ce qui est projeté à l’échelle macro, basé sur des principes fractals, vous offrant ainsi un avantage stratégique.

  4. Confirmer l’Agressivité dans l’Histogramme Rapide 🚀
    Enfin, confirmez l’agressivité dans l’histogramme rapide. Cela implique d’identifier un mouvement décisif qui pourrait indiquer une forte opportunité d’entrée. Cette étape finale est cruciale pour garantir une entrée précise et basée sur des données.

💰 Version 1.2 : Maintenant Compatible avec Tous les Instruments Financiers

La version 1.2 a ajusté VolumeSecret pour analyser et trader avec tous les instruments financiers, y compris les actions, le forex, les crypto-monnaies, les matières premières et plus encore. Cette mise à jour améliore la polyvalence de l’indicateur, permettant une analyse optimisée sur divers marchés.

💬 L’Importance de Votre Retour

Votre retour est essentiel pour l’amélioration continue de VolumeSecret. En partageant votre expérience, vous nous aidez à affiner et à ajuster l’indicateur pour mieux répondre aux besoins des traders. N’hésitez pas à partager vos avis et suggestions afin que nous puissions continuer à offrir le meilleur outil possible !


Produits recommandés
Découvrez RSIScalperPro - un indicateur innovant basé sur le RSI pour MetaTrader 5, optimisé pour le scalping sur des graphiques d'une minute ! Avec RSIScalperPro, vous aurez entre vos mains un puissant outil vous fournissant des signaux d'entrée et de sortie précis. RSIScalperPro utilise deux indicateurs RSI différents pour fournir des signaux clairs pour les niveaux de surachat et de survente. Vous pouvez ajuster les périodes et les valeurs limites des deux RSI selon votre stratégie de tradin
To get access to MT4 version please click here . - This is the exact conversion from TradingView: "Twin Range Filter" by " colinmck ". - This is a light-load processing and non-repaint indicator. - All input options are available.  - Buffers are available for processing in EAs. - You can message in private chat for further changes you need. Here is the code a sample EA that operated based on signals coming from the indicator: #include <Trade\Trade.mqh> CTrade trade; int handle_twr= 0 ; input gro
** All Symbols x All Time frames scan just by pressing scanner button ** *** Contact me  to send you instruction and add you in "Harmonic Scanner group" for sharing or seeing experiences with other users. Introduction Harmonic Patterns are best used to predict turning point. Harmonic Patterns give you high win rate and high opportunities for trade in during one day. This indicator detects the best and successful patterns based on Harmonic Trading concepts . The   Harmonic Patterns   Scanner   Sc
This Indicator adding power to traditional zigzag indicator. With High-Low numbers in vision it will be easier to estimate change of trend by knowing the depth of each wave. Information including points, pips, percentage%, and #bars can be displayed based on configuration. All information is real-time update. This indicator is especially useful in sideway market to buy low sell high.
When analyzing financial time series, researchers most often make a preliminary assumption that prices are distributed according to the normal (Gaussian) law. This approach is due to the fact that a large number of real processes can be simulated using the normal distribution. Moreover, the calculation of the parameters of this distribution presents no great difficulties. However, when applied to financial markets, normal distribution does not always work. The returns on financial instruments of
Best swing
Winsou Cedric Anicet Kpanou
-- BEST SWING  -- L'indicateur BEST SWING est un indicateur technique personnalisé, un excellent outil pour négocier les cassures en fonction des niveaux de support et de résistance horizontaux. L'indicateur BEST SWING utilise une formule complexe en analysant des données de prix autrement incongrues sur les cours de clôture de chaque période, ainsi que les hauts et les bas du prix, afin de donner un aperçu de la force ou de la faiblesse de la tendance du marché et de sa probabilité
Signal Eskiya, in addition to channel lines, reflects entry signals in the form of arrows. Trading strategies using the channel indicator belong to the classic methods of technical analysis, are easy to execute, and therefore available even to beginners. Price ranges work equally well on any trading assets and timeframes, they can be used both independently and with additional confirmation from oscillators and market volumes. American traders say: “Trend is your friend”, which means “Trend is
Here I present you this awesome indicator I made. This is a nique combination witch puts you in the same level as MM's. So you can surf a lot of waves and identify the rally time, breakouts, and the perfect time to get in the market. ---- The SSL Channel is a great all-rounder based on 2 Simple Moving Averages, one of recent Highs, one of recent Lows. The calculation prints a   channel   on the chart consisting of 2 lines. This strategy gives a Long signal when price closes above the top of the
Volume Bands Chart
Rafael Caetano Pinto
This indicator marks the relevant volume levels among the day. The two relevant levels are the candle with more volume and the period with more volume of lots transacted.  The filled red background is the range of price with the most relevant volume of the day (probably the big player that is command the game). The purple lines shows the range of price with most volume (probably a area where some big player is accumulating before force a market direction). There is also the dot lines that mark
This indicator is an extended implementation of Weis waves. It builds Weis waves on absolute volumes (which is the classical approach) or delta of volumes (unique feature) using different methods of wave formation and visualization. It works with real volumes, if available, or with tick volumes otherwise, but also provides an option to use so called "true volume surrogates", as an artificial substitution for missing real volumes (for example, for Forex symbols), which was introduced in correspo
White Weis Volume Ticks
Ricardo Almeida Branco
5 (3)
White Weis Volume This indicator shows the sum of the volume in each wave, bulish or bearish, as idealized by David Weis , but it brings an important addition , which is the marking of the bar with the highest volume of the wave (White Bar)! In coding the indicator, it was sought to optimize the code to require minimal processing during use and not to overload mt5. The indicator can be used for pre-trading analysis and study, where the trader analyzes possible points of support and resi
Descriptions A point point is a technical analysis indicator, or calculations, used to determine the overall trend of market over different time frames. This indicator calculate the highest or lowest pivots among left x and right y bars and show the high/low level during that period.   From that, you could clearly see the top resistance & bottom support level and how market goes break out. Instructions pivotLeft - pivot left bar count pivotRight - pivot right bar count pivotHighColor - c
The Rocket Trend indicator is trending. The indicator draws two-color points connected by lines along the chart. This is a trend indicator, it is an algorithmic indicator. It is easy to work and understand when a blue circle appears, you need to buy, when a red one appears, sell. The indicator is used for scalping and pipsing, and has proven itself well. Rocket Trend is available for analyzing the direction of the trend for a specific period of time. Ideal for novice traders learning the laws o
Cet indicateur de tableau de bord d'offre et de demande à plusieurs périodes et à plusieurs symboles envoie des alertes lorsque le prix a atteint une zone d'offre/demande. Il est également possible de l'utiliser pour être alerté des doubles hauts/bas réguliers au lieu des zones. Il peut être utilisé avec toutes les plages horaires de M1 à MN.       Un maximum de 9 périodes peuvent être affichées dans le tableau de bord en même temps.   Il est possible d'utiliser des filtres RSI, divergence (MACD
Value Chart Candlesticks
Flavio Javier Jarabeck
4.7 (10)
The idea of a Value Chart indicator was presented in the very good book I read back in 2020 , " Dynamic Trading Indicators: Winning with Value Charts and Price Action Profile ", from the authors Mark Helweg and David Stendahl. The idea is simple and the result is pure genius: Present candlestick Price analysis in a detrended way! HOW TO READ THIS INDICATOR Look for Overbought and Oversold levels. Of course, you will need to test the settings a lot to find the "correct" one for your approach.
FREE
TilsonT3
Jonathan Pereira
Tillson's T3 moving average was introduced to the world of technical analysis in the article ''A Better Moving Average'', published in the American magazine Technical Analysis of Stock Commodities. Developed by Tim Tillson, analysts and traders of futures markets soon became fascinated with this technique that smoothes the price series while decreasing the lag (lag) typical of trend-following systems.
FREE
Stackable VWAP
Flavio Javier Jarabeck
3.5 (4)
Volume Weighted Average Price (VWAP) is a trading benchmark commonly used by Big Players that gives the average price a Symbol has traded throughout the day. It is based on both Volume and price. Additionally we put in this indicator the MVWAP (Moving Volume Weighted Average Price). For those who do not know the usage and the importance od this indicator I recommend a great article about this subject at Investopedia ( https://www.investopedia.com/articles/trading/11/trading-with-vwap-mvwap.asp
FREE
Contact me for instruction, any questions! Introduction The Elliott Wave in technical analysis describes price movements in the financial market that are related to changes in trader sentiment and psychology. The 5 W Pattern (Known as 3 Drives) is an Elliott Wave pattern that is formed by 5 consecutive symmetrical moves up or down. In its bullish form, the market is making 5 drives to a bottom before an uptrend forms. In a bearish 5-drive, it is peaking before the bears take over.  5W Pattern S
Candle EA MT5
Mansour Babasafary
4.37 (43)
This expert is based on patterns The main patterns of this specialist are candlestick patterns Detects trends with candlestick patterns It has a profit limit and a loss limit, so it has a low risk The best time frame to use this expert is M30 time frame The best currency pairs to use with this expert is the EURUSD, GBPUSD, AUDUSD, USDCAD currency pairs Attributes: Can be used in the EURUSD, GBPUSD, AUDUSD, USDCAD  currency pairs Can be used in M30, H1, H4 time frames Has profit limit an
Seasonal Pattern Trader
Dominik Patrick Doser
Disclaimer : Keep in mind that seasonal patterns are not always reliable. Therefore, thoughtful risk management is crucial to minimize losses.  Seasonal patterns in the financial world are like a well-guarded secret that successful investors use to their advantage. These patterns are recurring price movements that occur during specific periods or around special events. Additionally, there are also intraday patterns that repeat. For example, Uncle Ted from Forex Family suggests examining previou
A countdown timer for the  Volume bar chart generator  and  Tick chart generator  products, which are available for download from the MQL5 Market: Tick chart generator: https://www.mql5.com/en/market/product/29215 Volume bar chart generator: https://www.mql5.com/en/market/product/47197 The counter conveniently displays the number of ticks or transactions (depending on the chart) that need to pass for a new bar to start printing. The user can set the following indicator inputs. Volume type
FREE
The   Visual Volatility Clustering   indicator clusters the market based on volatility. The indicator does not redraw and gives accurate data, does not use closing prices. Uses the opening prices or the highs or lows of the previous completed bar. Therefore, all information will be clear and unambiguous. The essence of the indicator is to divide the price market into certain areas according to a similar type of volatility. This can be done in any way. In this example, the indicator is configure
Volume Candle MT5
Rafael Caetano Pinto
This indicator shows the candles with the highest volume in the market, based on a period and above-average growth percentage. It is also possible to activate the "Show in-depth analysis" functionality that uses algorithms to paint the candles with the probably market direction instead of painting based on the opening and closing positions. EA programmers: This indicator does not redraw.
Graphic Alignment Context
Ricardo Alexandre Laurentino
The Graphic Alignment Context (GAC) Technical Indicator measures the vertical difference of the simple average price of a financial instrument in the context of three different timeframes determined by a defined number of bars or candles (periods) to determine the strength of the buy or sell trend. sale. Ascending average prices indicate Buying strength (1), Descending average prices indicate Selling strength (-1) and any scenario different from the previous two conditions indicates Neutrality
FREE
This indicator uses a different approach from the previous version to get it's trendlines. This method is derived from Orchard Forex, and the process of making the indicator is demonstrated in there video   https://www.youtube.com/watch?v=mEaiurw56wY&t=1425s . The basic idea behind this indicator is it draws a   tangent line   on the highest levels and lowest levels of the bars used for calculation, while ensuring that the lines don't intersect with the bars in review (alittle confusing? I kno
FREE
Note: If you want to apply this indicators on indicators which are shown in a sub-window, then consider using this indicator instead:  https://www.mql5.com/en/market/product/109066.&nbsp ; AIntel Predict - Your Gateway to Future Trading Success! Unlock the power of predictive analytics with AIntel Predict. Say goodbye to the guesswork and hello to improved forecasting, as AIntel Predict leverages historical data to unveil the future of your trades like never before. Whether you're a seasoned tra
Volume is a widely used indicator in technical analysis, however there is a variation that is even more useful than Volume alone: the Moving Average of Volume. It is nothing more than a moving average applied to the popular Volume indicator. As the name says, Volume + MA serves to display the transacted volume (purchases and sales executed) of a certain financial asset at a given point of time together with the moving average of that same volume over time. What is it for? With the Volume
FREE
BS Vwap 5 Bands
Bruno Gomes Falcao Seixas
The BS Vwap 5 Bands indicator is an advanced tool that integrates price and volume data, providing a comprehensive view of market dynamics. Designed with a focus on performance and tested under real trading conditions, this indicator aims to deliver valuable insights to traders. Its innovative approach combines VWAP with five distinct bands, revealing whether the price is aligned with the "fair price" and indicating overbought or oversold conditions. Additionally, the indicator offers visual cus
Vwap Bands Auto
Ricardo Almeida Branco
The Vwap Bands Auto indicator seeks to automatically map the maximum market frequency ( automatic update of the outermost band ) and has two intermediate bands that also adjust to daily volatility. Another tool from White Trader that combines price and volume, in addition to mapping the daily amplitude. The external band is updated automatically when the daily maximum or minimum breaks the current frequency, and can be an input signal, seeking a return to the daily vwap. Thus, in ad
CYCLE WAVE OSCILLATOR indicator is an indicator based on cyclical price fluctuations. This indicator can help you determine overbought and oversold levels, and help you predict price trends within the cycle. MT4 Version here! You can combine it with our indicators below to make your trading decisions more accurate: Supply Demand Ribbon MT5 Basic Feature: - Three Trend Types: + Zero + Basic + Advanced
FREE
Les acheteurs de ce produit ont également acheté
TPSpro RFI Levels MT5
Roman Podpora
4.73 (11)
INSTRUCTIONS       RUS   -   ANGLAIS       Il   est recommandé de l'utiliser avec un indicateur       -       TPSpro   TENDANCE PRO -   Version MT4         Un élément clé du trading est constitué par les zones ou les niveaux à partir desquels les décisions d'achat ou de vente d'un instrument de trading sont prises. Malgré les tentatives des principaux acteurs de dissimuler leur présence sur le marché, ils laissent inévitablement des traces. Notre tâche était d'apprendre à identifier ces traces
TPSproTREND PrO MT5
Roman Podpora
4.89 (9)
TPSpro TREND PRO  - is a trend indicator that automatically analyzes the market and provides information about the trend and each of its changes, as well as giving signals for entering trades without redrawing! The indicator uses each candle, analyzing them separately. referring to different impulses - up or down impulse. Exact entry points into transactions for currencies, crypto, metals, stocks, indices!  Version MT4               DETAILED DESCRIPTION               R ecommended to use with an
Tout d'abord, il convient de souligner que ce système de trading est un indicateur non repeint, non redessiné et non retardé, ce qui le rend idéal pour le trading manuel et automatisé. Cours en ligne, manuel et téléchargement de préréglages. Le "Système de Trading Smart Trend MT5" est une solution de trading complète conçue pour les traders débutants et expérimentés. Il combine plus de 10 indicateurs premium et propose plus de 7 stratégies de trading robustes, ce qui en fait un choix polyvalent
Atomic Analyst MT5
Issam Kassas
4.42 (19)
Tout d'abord, il convient de souligner que cet indicateur de trading n'est ni repainting, ni redrawing et ne présente aucun délai, ce qui le rend idéal à la fois pour le trading manuel et automatisé. Manuel de l'utilisateur : réglages, entrées et stratégie. L'Analyste Atomique est un indicateur d'action sur les prix PA qui utilise la force et le momentum du prix pour trouver un meilleur avantage sur le marché. Équipé de filtres avancés qui aident à éliminer les bruits et les faux signaux, et à
FX Power MT5 NG
Daniel Stein
5 (5)
Obtenez votre mise à jour quotidienne du marché avec des détails et des captures d'écran via notre Morning Briefing ici sur mql5 et sur Telegram ! FX Power MT5 NG est la nouvelle génération de notre très populaire indicateur de force des devises, FX Power. Et qu'est-ce que ce compteur de force de nouvelle génération offre ? Tout ce que vous avez aimé de l'original FX Power PLUS Analyse de la force de l'OR/XAU Des résultats de calcul encore plus précis Périodes d'analyse configurables individuel
Quantum Trend Sniper
Bogdan Ion Puscasu
4.8 (49)
Présentation       Quantum Trend Sniper Indicator   , l'indicateur révolutionnaire MQL5 qui transforme la façon dont vous identifiez et négociez les inversions de tendance ! Développé par une équipe de traders expérimentés avec une expérience commerciale de plus de 13 ans,       Indicateur Quantum Trend Sniper       est conçu pour propulser votre parcours de trading vers de nouveaux sommets grâce à sa manière innovante d'identifier les inversions de tendance avec une précision extrêmement élevée
AT Forex Indicator MT5
Marzena Maria Szmit
5 (4)
The AT Forex Indicator MT5 is a sophisticated trading tool designed to provide traders with a comprehensive analysis of multiple currency pairs. This powerful indicator simplifies the complex nature of the forex market, making it accessible for both novice and experienced traders. AT Forex Indicator uses advanced algorithms to detect trends, patterns and is an essential tool for traders aiming to enhance their forex trading performance. With its robust features, ease of use, and reliable signal
TrendMaestro5
Stefano Frisetti
note: this indicator is for METATRADER4, if you want the version for METATRADER5 this is the link:  https://www.mql5.com/it/market/product/108106 TRENDMAESTRO ver 2.4 TRENDMAESTRO recognizes a new TREND in the bud, he never makes mistakes. The certainty of identifying a new TREND is priceless. DESCRIPTION TRENDMAESTRO identifies a new TREND in the bud, this indicator examines the volatility, volumes and momentum to identify the moment in which there is an explosion of one or more of these data a
Ce tableau de bord affiche les derniers   modèles harmoniques   disponibles pour les symboles sélectionnés, ce qui vous permettra de gagner du temps et d'être plus efficace /   version MT4 . Indicateur gratuit:   Basic Harmonic Pattern Colonnes de l'indicateur Symbol :   les symboles sélectionnés apparaissent Trend   :   haussière ou baissière Pattern :   type de motif (gartley, papillon, chauve-souris, crabe, requin, cypher ou ABCD) Entry:   prix d'entrée SL:   prix du stop loss TP1:   1
Top indicator for MT5   providing accurate signals to enter a trade without repainting! It can be applied to any financial assets:   forex, cryptocurrencies, metals, stocks, indices .  Watch  the video  (6:22) with an example of processing only one signal that paid off the indicator! MT4 version is here It will provide pretty accurate trading signals and tell you when it's best to open a trade and close it. Most traders improve their trading results during the first trading week with the help of
FxaccurateLS
Shiv Raj Kumawat
WHY IS OUR FXACCCURATE LS MT5 THE PROFITABLE ? PROTECT YOUR CAPITAL WITH RISK MANAGEMENT Gives entry, stop and target levels from time to time. It finds Trading opportunities by analyzing what the price is doing during established trends. POWERFUL INDICATOR FOR A RELIABLE STRATEGIES We have made these indicators with a lot of years of hard work. It is made at a very advanced level. Established trends provide dozens of trading opportunities, but most trend indicators completely ignore them!
Advanced Supply Demand MT5
Bernhard Schweigert
4.5 (14)
La meilleure solution pour tout commerçant débutant ou expert ! Cet indicateur est un outil de trading unique, de haute qualité et abordable car nous avons intégré un certain nombre de fonctionnalités propriétaires et une nouvelle formule. Avec cette mise à jour, vous pourrez afficher des zones à double horaire. Vous pourrez non seulement afficher un TF plus élevé, mais afficher les deux, le graphique TF, PLUS le TF supérieur : AFFICHAGE DES ZONES NICHÉES. Tous les traders Supply Demand vont ado
TPA True Price Action indicator reveals the true price action of the market makers through 100% non-repainting signals strictly at the close of a candle! TPA shows entries and re-entries, every time the bulls are definitely stronger than the bears and vice versa. Not to confuse with red/green candles. The shift of power gets confirmed at the earliest stage and is ONE exit strategy of several. There are available now two free parts of the TPA User Guide for our customers. The first "The Basics"
Blahtech Supply Demand MT5
Blahtech Limited
4.54 (13)
Was: $299  Now: $99   Supply Demand uses previous price action to identify potential imbalances between buyers and sellers. The key is to identify the better odds zones, not just the untouched ones. Blahtech Supply Demand indicator delivers functionality previously unavailable on any trading platform. This 4-in-1 indicator not only highlights the higher probability zones using a multi-criteria strength engine, but also combines it with multi-timeframe trend analysis, previously confirmed swings
Black Dragon indicator mt5
Ramil Minniakhmetov
4.81 (54)
L'indicateur de détection de tendance complétera n'importe quelle stratégie et peut également être utilisé comme un outil indépendant. IMPORTANT! Contactez-moi immédiatement après l'achat pour obtenir des instructions et un bonus !   Avantages Facile à utiliser; ne surcharge pas le graphique avec des informations inutiles. La possibilité d'utiliser comme filtre pour n'importe quelle stratégie. Contient des niveaux dynamiques de cupport et de resistange, qui peuvent être utilisés à la fois
XQ Indicator MetaTrader 5
Marzena Maria Szmit
3 (2)
Step into the realm of Forex trading with confidence and precision using XQ, a cutting-edge Forex indicator designed to elevate your trading game to unprecedented heights. Whether you're a seasoned trader or just stepping into the world of currency exchange, XQ Forex Indicator empowers you with the insights and signals needed to make informed trading decisions. The signal conditions are a combination of three indicators, and XQ Forex Indicator only display  medium and long-term trends . The ind
FX Volume MT5
Daniel Stein
4.93 (14)
Obtenez votre mise à jour quotidienne du marché avec des détails et des captures d'écran via notre Morning Briefing ici sur mql5 et sur Telegram ! FX Volume est le PREMIER et SEUL indicateur de volume qui fournit un VRAI aperçu du sentiment du marché du point de vue d'un courtier. Il fournit des informations impressionnantes sur la façon dont les acteurs institutionnels du marché, comme les courtiers, sont positionnés sur le marché des changes, bien plus rapidement que les rapports COT. Voir c
Was: $249  Now: $99   Market Profile defines a number of day types that can help the trader to determine market behaviour. A key feature is the Value Area, representing the range of price action where 70% of trading took place. Understanding the Value Area can give traders valuable insight into market direction and establish the higher odds trade. It is an excellent addition to any system you may be using. Inspired by Jim Dalton’s book “Mind Over Markets”, this indicator is designed to suit the
Gartley Hunter Multi
Siarhei Vashchylka
5 (8)
Gartley Hunter Multi - An indicator for searching for harmonic patterns simultaneously on dozens of trading instruments and on all possible timeframes. Manual (Be sure to read before purchasing) | Version for MT4 Advantages 1. Patterns: Gartley, Butterfly, Shark, Crab. Bat, Alternate Bat, Deep Crab, Cypher 2. Simultaneous search for patterns on dozens of trading instruments and on all possible timeframes 3. Search for patterns of all possible sizes. From the smallest to the largest 4. A
Ce tableau de bord découvre et affiche les zones   d'offre   et de   demande   sur le graphique, à la fois en mode scalping et à long terme, en fonction de votre stratégie de trading pour les symboles sélectionnés. En outre, le mode scanner du tableau de bord vous permet de vérifier tous les symboles souhaités en un coup d'œil et de ne manquer aucune position appropriée /   Version MT4 Indicateur gratuit:   Basic Supply Demand Caractéristiques Permet de visualiser les opportunités de tr
The Price Action Finder Multi indicator is an indicator of entry points that searches for and displays Price Action system patterns on dozens of trading instruments and on all standard time frames: (m1, m5, m15, m30, H1, H4, D1, Wk, Mn). The indicator places the found patterns in a table at the bottom of the screen. By clicking on the pattern names in the table, you can move to the chart where this pattern is located. Manual (Be sure to read before purchasing) | Version for MT4 Advantages 1. Pa
Golden Spikes Premium
Kwaku Bondzie Ghartey
5 (1)
Golden Spikes Detector Acknowledgement and Dedications:  The name of this indicator was Inspired by an Original; Mr Grant Koopman; a Knowledgeable and experienced Synthetics trader. I dedicate this indicator to Mr Grant.  Overview: The Golden Spikes Premium is a groundbreaking trading indicator meticulously crafted for the Boom and Crash indices on the Deriv market. Tailored to meet the needs of discerning traders, this powerful tool operates exclusively on the one-minute timeframe, providin
MetaForecast M5
Vahidreza Heidar Gholami
5 (2)
MetaForecast prédit et visualise l'avenir de n'importe quel marché en se basant sur les harmoniques des données de prix. Bien que le marché ne soit pas toujours prévisible, s'il y a un motif dans les prix, MetaForecast peut prédire l'avenir aussi précisément que possible. Comparé à d'autres produits similaires, MetaForecast peut générer des résultats plus précis en analysant les tendances du marché. Paramètres d'entrée Past size (Taille passée) Spécifie le nombre de barres que MetaForecast uti
Market Overview MT5
Mehran Sepah Mansoor
Optimisez vos décisions de trading avec notre indicateur de force et de sentiment du marché et ne tradez plus à contre-courant! Méticuleusement conçu pour les traders sérieux qui apprécient les informations précises et opportunes, notre indicateur fournit une vue d'ensemble des 28 paires principales d'une manière très simple. Cet outil est capable de classer les paires de devises en fonction de leur popularité, de la force de la tendance haussière ou baissière et du pourcentage d'acheteurs et
Boom and Crash Trend Detector is a  Non-Repaint   MT5 trading system usually being sold for 50 0$ . Most people use this for Deriv but can be used to forex too. The boom and crash spike indicator is a spike detecting software, with Multiple features, these features include. Spike Alert ( from 10 to 100-second warning before spike) Continues spike Alert (for double or continuous spikes at a time) supports all Boom/crash Indices M6 time frame works best here . Bigger time frame trend pointer f
Trend Forecaster
Alexey Minkov
5 (6)
The Trend Forecaster indicator utilizes a unique proprietary algorithm to determine entry points for a breakout trading strategy. The indicator identifies price clusters, analyzes price movement near levels, and provides a signal when the price breaks through a level. The Trend Forecaster indicator is suitable for all financial assets, including currencies (Forex), metals, stocks, indices, and cryptocurrencies. You can also adjust the indicator to work on any time frames, although it is recommen
Introduction Harmonic Patterns are best used to predict potential turning point. Traditionally, Harmonic Pattern was identified manually connecting peaks and troughs points in the chart. Manual harmonic pattern detection is painfully tedious and not suitable for everyone. You are often exposed under subjective pattern identification with manual pattern detection. To avoid these limitations, Harmonic Pattern Plus was designed to automate your harmonic pattern detection process. The functionality
Renko is a well-known Japanese charting technique that removes time from the chart. Instead of drawing bars in constant intervals (time) as a normal chart would, a Renko chart does so only when price moves beyond a predefined amount. In a Renko chart, a bar is created when price exceeds the previous bar’s high or low by a predefined amount or what we call the Box Size. The result is a chart with equally sized bars running up or down in 45 degree angles. Such a chart offers the following advant
Unlock hidden profits: accurate divergence trading for all markets Special Offer: Purchase now to receive free bonuses worth $90! (Read more for details) Tricky to find and scarce in frequency, divergences are one of the most reliable trading scenarios. This indicator finds and scans for regular and hidden divergences automatically using your favourite oscillator. [ Installation Guide | Update Guide | Troubleshooting | FAQ | All Products ] Easy to trade Finds regular and hidden divergences S
PZ Swing Trading MT5
PZ TRADING SLU
5 (4)
Protect against whipsaws: revolutionize your swing trading approach Special Offer: Purchase now to receive free bonuses worth $135! (Read more for details) Swing Trading is the first indicator designed to detect swings in the direction of the trend and possible reversal swings. It uses the baseline swing trading approach, widely described in trading literature. The indicator studies several price and time vectors to track the aggregate trend direction and detects situations in which the market i
Plus de l'auteur
SwingVolumePro
Thalles Nascimento De Carvalho
Vue d'ensemble SwingVolumePro est un indicateur avancé et polyvalent, conçu pour être utilisé sur une large gamme d'actifs financiers et pour supporter différents styles de trading. Basé sur une analyse rigoureuse du volume et du prix, il fournit des signaux clairs et précis permettant aux traders de tous niveaux de prendre des décisions éclairées basées sur des données de haute qualité. SwingVolumePro.PDF Principales caractéristiques Polyvalence: SwingVolumePro peut être appliqué à
AI Channel
Thalles Nascimento De Carvalho
4 (4)
Welcome to the presentation of the AI Channel indicator, a powerful tool that uses artificial intelligence for price channel analysis in the financial market. In this session, we will explore how this revolutionary indicator can assist investors and traders in making more informed and strategic decisions. Let's get started! I. What is the AI Channel indicator? AI Channel is an indicator developed based on advanced artificial intelligence algorithms. It utilizes historical price data of financial
FREE
Cumulative Volume Bands
Thalles Nascimento De Carvalho
CVB Cumulative Volume Bands : Optimisez vos opérations avec le volume cumulé ! CVB Cumulative Volume Bands est un indicateur avancé conçu pour les traders qui recherchent des signaux précis basés sur le volume cumulé. En utilisant des bandes de volume cumulé, cet indicateur fournit des lectures claires des pressions d'achat et de vente sur le marché, aidant ainsi à identifier les retournements et les mouvements de prix importants. Cumulative Volume Bands for MT5 ! Caractéristiqu
FREE
Box Weis Wave
Thalles Nascimento De Carvalho
5 (1)
Élevez votre analyse avec le Weis Wave Box ! Si vous recherchez précision et clarté dans vos négociations, le Weis Wave Box est l'outil qu'il vous faut. Cet indicateur avancé offre une analyse visuelle détaillée des vagues de volume et des points de swing, vous aidant à mieux comprendre la relation entre effort et résultats sur le marché. Principales caractéristiques du Weis Wave Box : Vagues de Volume Personnalisables : Ajustez les vagues de volume en ticks pour les adapter à vos straté
Swing Point Volume
Thalles Nascimento De Carvalho
Swing Point Volume, the indicator that signals weakness and strength at the tops and bottoms. This indicador can be for used the Wyckoff Method. Information provided; - Swing on customized ticks. - Volume and points in each balance sheet. - Percentage of Displacement. - Sound alert option on top and bottom breaks. - Volume in ticks and Real Volume. - Volume HL (extreme) or (opening and closing) - Customized volume shapes.
Atr Projection
Thalles Nascimento De Carvalho
L'indicateur ATR Projeção se distingue comme un outil robuste dans l'analyse technique, conçu pour fournir des informations précises sur les limites potentielles des mouvements de prix sur les marchés financiers. Son approche flexible permet aux utilisateurs de personnaliser de manière intuitive les métriques d'analyse, en s'adaptant aux besoins spécifiques de chaque actif négocié. Fonctionnement personnalisable : Par défaut, l'ATR Projeção fonctionne en considérant 30 % de la moyenne des
Long Short Pro
Thalles Nascimento De Carvalho
Indicateur Long & Short - Version Pro : Déverrouillez le Potentiel Illimité de Votre Analyse de Marché ! Aucune Limite pour Tous les Actifs La version Pro de l’indicateur Long & Short vous offre une liberté totale pour l’utiliser sur tout actif financier. Plus de limitations – appliquez le même indicateur à tous vos actifs préférés ! Sans Limites Profitez de toutes les fonctionnalités de l’indicateur sans aucune restriction. La version Pro vous offre une expérience complète et ill
Didi Index Volume
Thalles Nascimento De Carvalho
Nous vous présentons le Didi Index Volume, un indicateur d'analyse technique développé par le trader brésilien Odir Aguiar, qui se distingue par son approche avancée et puissante dans l'identification des opportunités sur les marchés financiers. Disponible sur différentes plateformes, le Didi Index Volume est devenu un outil essentiel pour les traders à la recherche d'informations précises et précieuses pour leurs stratégies de trading. Cet indicateur combine le célèbre Didi Index, créé par O
Smart Binary Volume
Thalles Nascimento De Carvalho
L'indicateur Smart Binary Volume est un outil polyvalent qui combine l'analyse du volume de trading avec l'apprentissage automatique. Il peut être appliqué sur différents marchés et stratégies, y compris le scalping et d'autres types de transactions à court terme. En utilisant des algorithmes d'apprentissage automatique avancés, l'indicateur identifie des schémas complexes, générant ainsi des signaux d'achat et de vente plus précis. Buffer to Create EA. Buffer Line Gold = 0. Buffer Line Red =
TimeChannel
Thalles Nascimento De Carvalho
The "Timechannel" is a powerful technical analysis tool designed specifically for traders who want to gain deeper and more accurate insights into price movements across multiple timeframes (multi-timeframe). This indicator is an essential addition to the toolbox of any serious trader seeking to make informed and data-driven trading decisions. Key Features: Advanced Multi-Timeframe Analysis : Timechannel allows traders to analyze price movements on different timeframes simultaneously. This is cr
Big Player Range
Thalles Nascimento De Carvalho
5 (2)
Découvrez la Puissance de "BigPlayerRange" : Votre Allié dans l'Analyse Technique du Marché Nous vous présentons BigPlayerRange , un outil avancé d'analyse technique conçu pour révéler les zones d'intérêt des investisseurs institutionnels sur le marché. Grâce à cet outil, vous pouvez identifier précisément où les principaux acteurs sont activement impliqués et comprendre comment cela peut influencer vos stratégies de trading. Principales Caractéristiques : Cartographie des Zones d'Intérêt I
Master OBV
Thalles Nascimento De Carvalho
MasterOBV : Maîtrisez les Tendances du Marché avec Précision ! MasterOBV est un indicateur d'analyse technique qui combine volume , correlation positive et une Moyenne Mobile (MA) pour affiner l'identification des tendances sur les marchés financiers. Fonctionnalités Principales : Volume Intelligent : Analyse le volume des transactions pour identifier les changements significatifs dans la force de la tendance. Correlation Positive : Intègre des actifs corrélés pour obtenir une vue pl
Smart Delta Volume
Thalles Nascimento De Carvalho
Smart Delta Volume : Précis et Adaptable aux Conditions de Marché Dynamiques Smart Delta Volume est un indicateur technique avancé conçu pour offrir une analyse précise et adaptable dans un environnement de marché en constante évolution. En utilisant des niveaux dynamiques qui s'ajustent automatiquement en fonction de la volatilité, cet indicateur fournit une vue plus complète et fiable de l'interaction entre le flux de volume et l'action des prix. Cette capacité d'adaptation est cruciale pou
VolaMetrics VSA
Thalles Nascimento De Carvalho
VolaMetrics VSA | Un Puissant Allié dans l'Analyse Technique Le VolaMetrics VSA est un indicateur d'analyse technique qui combine la méthode Volume Spread Analysis (VSA) avec une analyse détaillée du volume des transactions . Conçu pour identifier et suivre les mouvements significatifs des prix , le VolaMetrics VSA utilise l'interaction entre volume et écart de prix pour fournir des insights précieux qui peuvent aider à prendre des décisions de trading. Les Fondements de la Volume Spread Anal
CVD SmoothFlow Pro
Thalles Nascimento De Carvalho
CVD SmoothFlow Pro - Analyse de Volume Illimitée pour Tout Actif ! CVD SmoothFlow Pro est la solution ultime pour les traders recherchant une analyse de volume précise et illimitée. En utilisant le calcul du Cumulative Volume Delta (CVD) avec un filtrage avancé du bruit, la version Pro offre la flexibilité et la précision nécessaires pour trader tout actif financier. Que propose CVD SmoothFlow Pro ? Analyse Claire : Filtre le bruit du marché et met en avant les mouvements de volume signifi
Imbalance DOM Pro
Thalles Nascimento De Carvalho
Imbalance DOM Pro : Optimisez vos opérations avec le déséquilibre du carnet d'ordres Opportunités avec les petits mouvements de prix Imbalance DOM Pro est un outil essentiel pour les analystes qui traitent avec le flux des ordres . Idéal pour les scalpers , il a été conçu pour ceux qui souhaitent tirer parti des petites oscillations de prix avec une grande précision. Grâce à un calcul avancé, l'indicateur identifie les déséquilibres dans le carnet d'ordres , fournissant des signaux pré
Cumulative Vol Bands
Thalles Nascimento De Carvalho
CVB Cumulative Volume Bands : Optimisez vos opérations avec le volume cumulé ! CVB Cumulative Volume Bands est un indicateur avancé conçu pour les traders qui recherchent des signaux précis basés sur le volume cumulé. En utilisant des bandes de volume cumulé, cet indicateur fournit des lectures claires des pressions d'achat et de vente sur le marché, aidant ainsi à identifier les retournements et les mouvements de prix importants. Caractéristiques principales : Analyse du volume c
ZigWave Oscillator
Thalles Nascimento De Carvalho
ZigWave Oscillator : Optimisez vos transactions avec des oscillateurs et ZigZag ! Le ZigWave Oscillator est l'outil parfait pour les traders recherchant précision et clarté dans l'analyse du marché financier. Cet indicateur combine la puissance des oscillateurs avec la simplicité visuelle du ZigZag, vous aidant à identifier rapidement et efficacement les meilleures opportunités d'achat et de vente. Pourquoi choisir le ZigWave Oscillator ? Analyse précise des oscillateurs : Intégrez RS
Filtrer:
Alejandro Perez Gonzalez
225
Alejandro Perez Gonzalez 2024.09.02 20:21 
 

L'utilisateur n'a laissé aucun commentaire sur la note

Thalles Nascimento De Carvalho
6363
Réponse du développeur Thalles Nascimento De Carvalho 2024.09.02 20:43
Los fractales funcionan como preavisos, que pueden o no activarse, ayudando a mantener al trader atento al mercado. La entrada debe ser validada por la aceleración o desaceleración en el histograma rápido (en un timeframe menor). Además, el histograma rápido ofrece un análisis sobre la absorción de precio basada en el volumen. Los ejemplos están disponibles en las capturas de pantalla, junto con el paso a paso completo. Importante: ¡No opere exclusivamente basándose en las flechas (arrows)! Gracias por su feedback.
Répondre à l'avis
Version 1.3 2024.09.08
Improved hardware usage
Version 1.2 2024.09.01
Des instructions d'utilisation ont été ajoutées et l'indicateur a été adapté à divers instruments.