• Aperçu
  • Avis
  • Commentaires

CVD SmoothFlow Pro

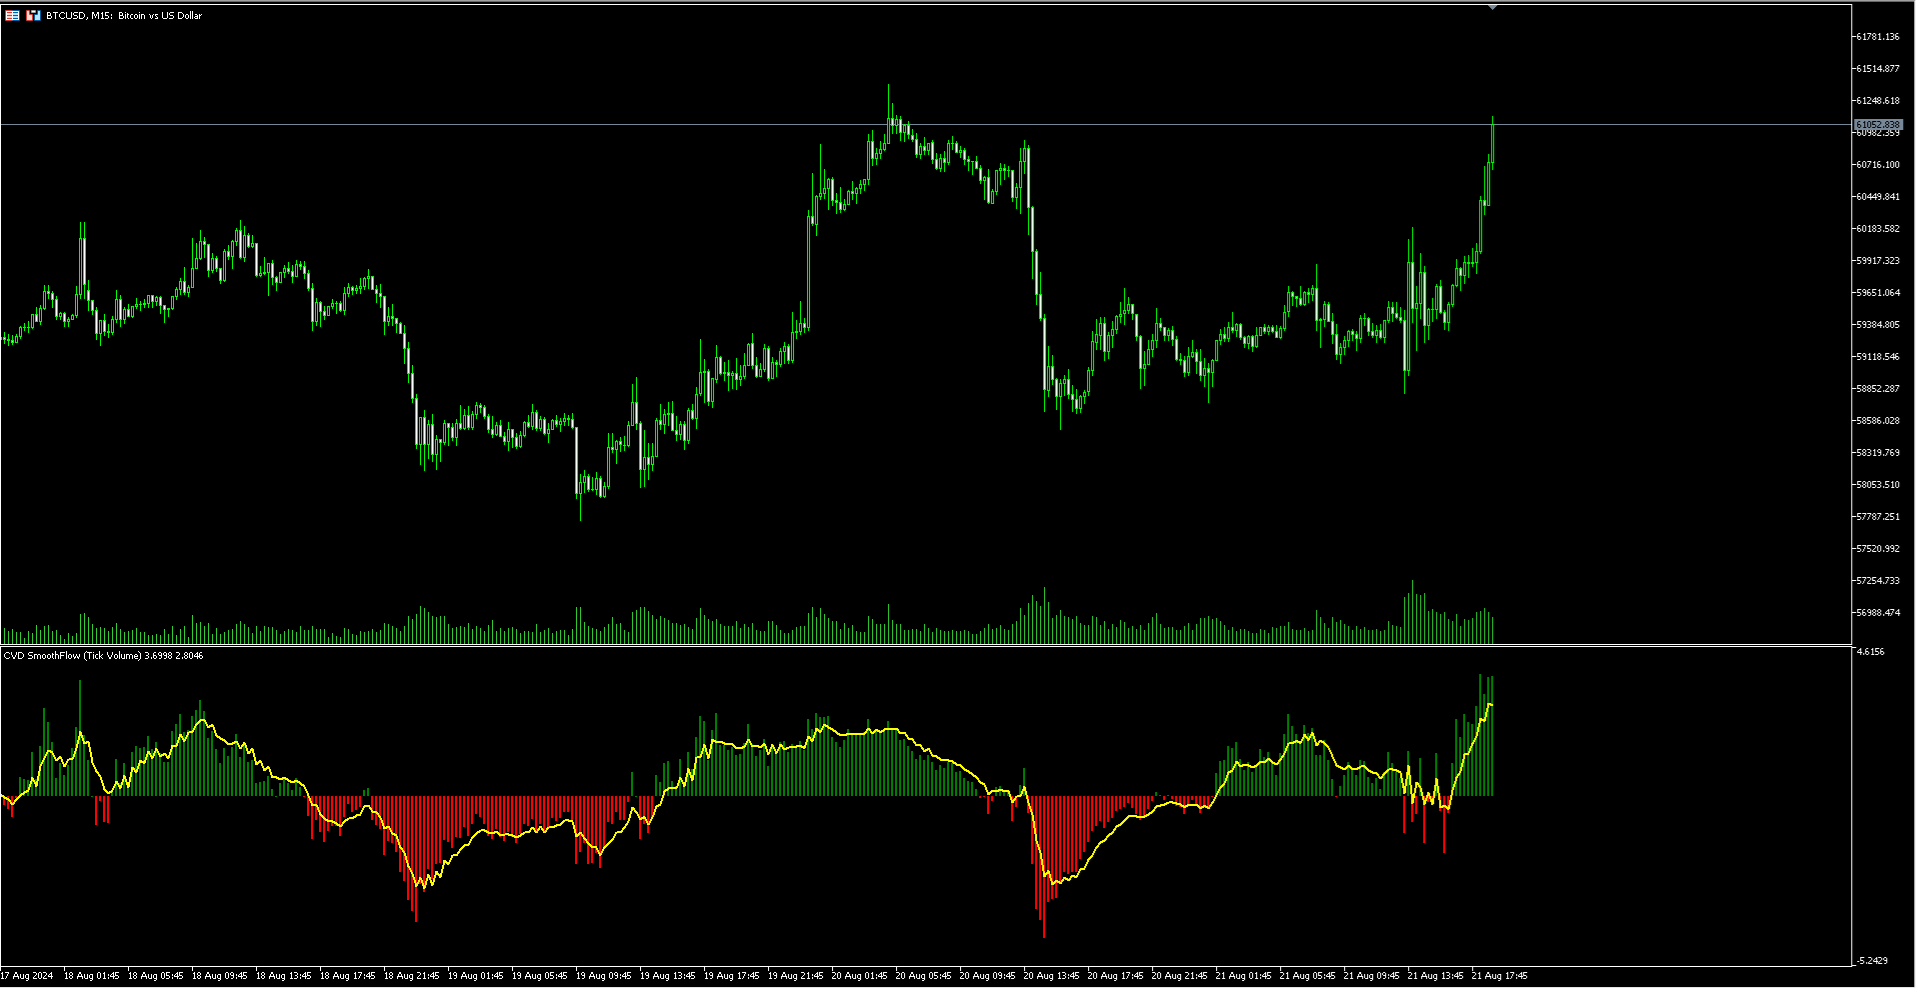
CVD SmoothFlow Pro - Analyse de Volume Illimitée pour Tout Actif !

CVD SmoothFlow Pro est la solution ultime pour les traders recherchant une analyse de volume précise et illimitée. En utilisant le calcul du Cumulative Volume Delta (CVD) avec un filtrage avancé du bruit, la version Pro offre la flexibilité et la précision nécessaires pour trader tout actif financier.

🔍 Que propose CVD SmoothFlow Pro ?

📊 Analyse Claire : Filtre le bruit du marché et met en avant les mouvements de volume significatifs pour tout actif financier.

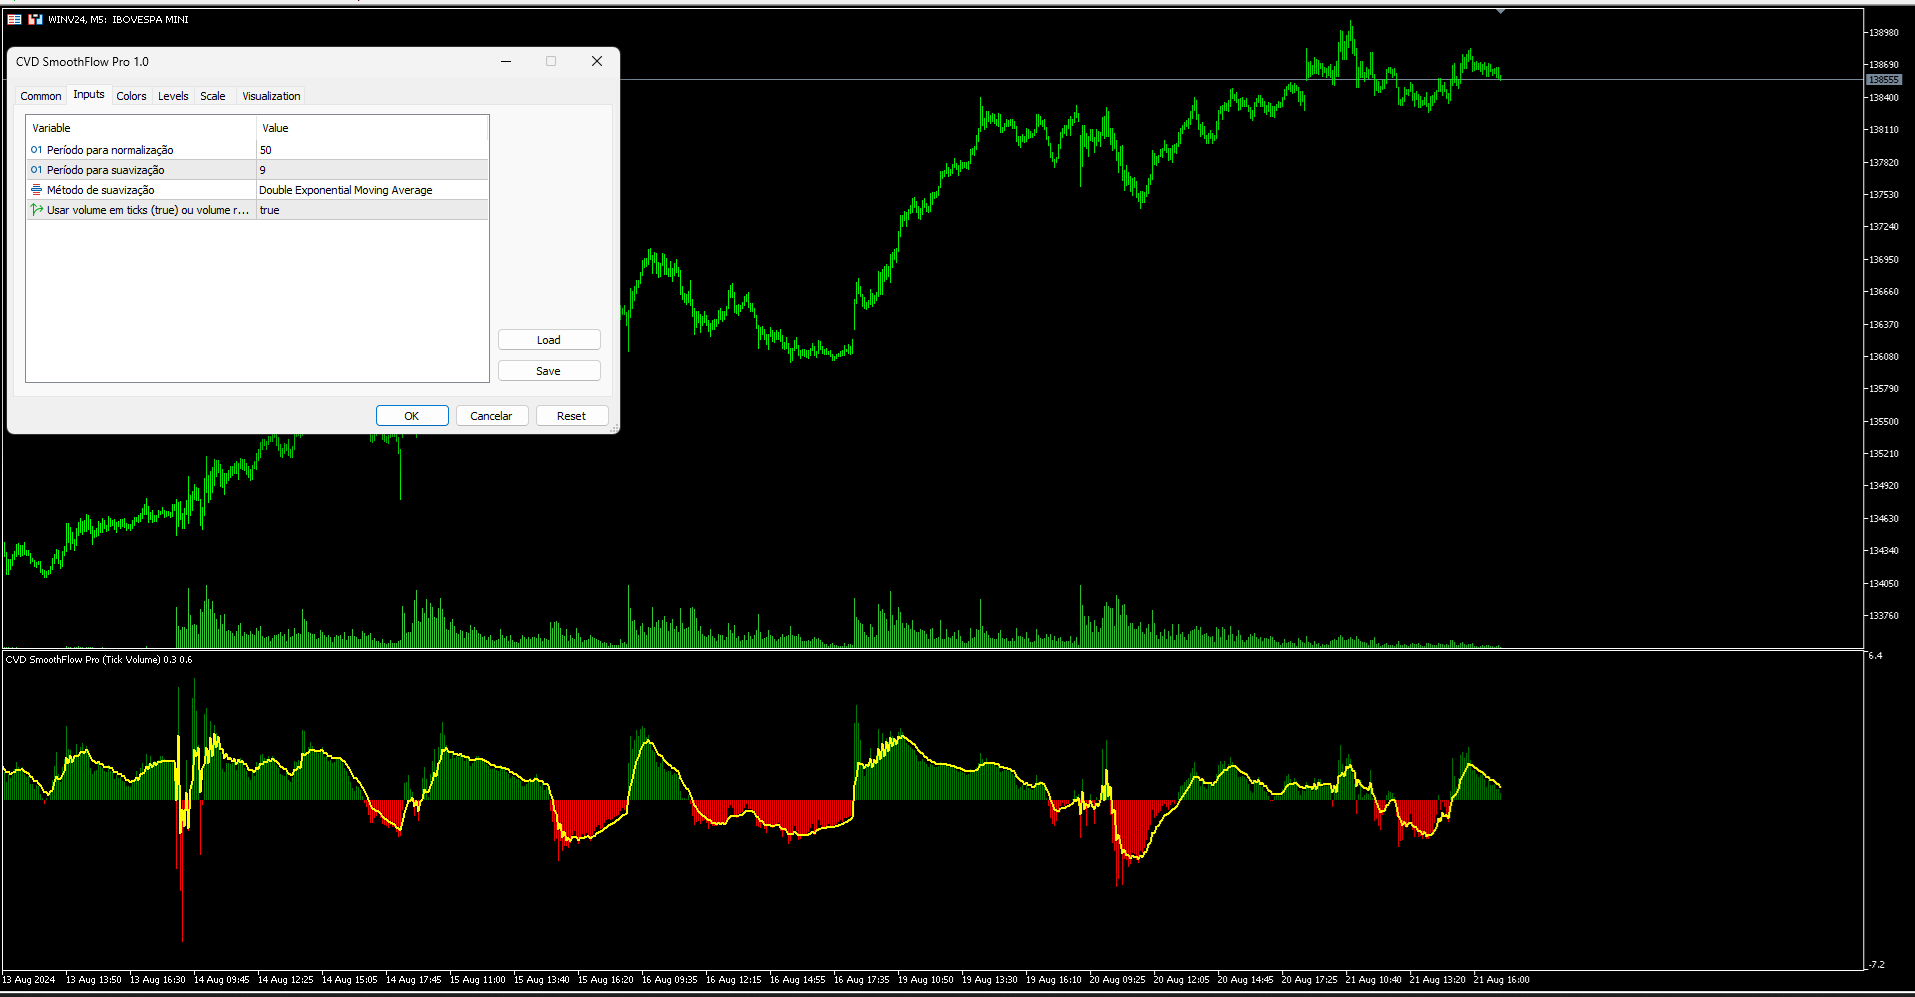
⚙️ Calcul Précis : Surveille les différences entre les achats et les ventes, offrant une vue détaillée du comportement du volume dans le forex, les indices, les cryptomonnaies, et plus encore.

💡 Interface Intuitive : Fournit une analyse accessible et efficace avec une présentation claire des données.

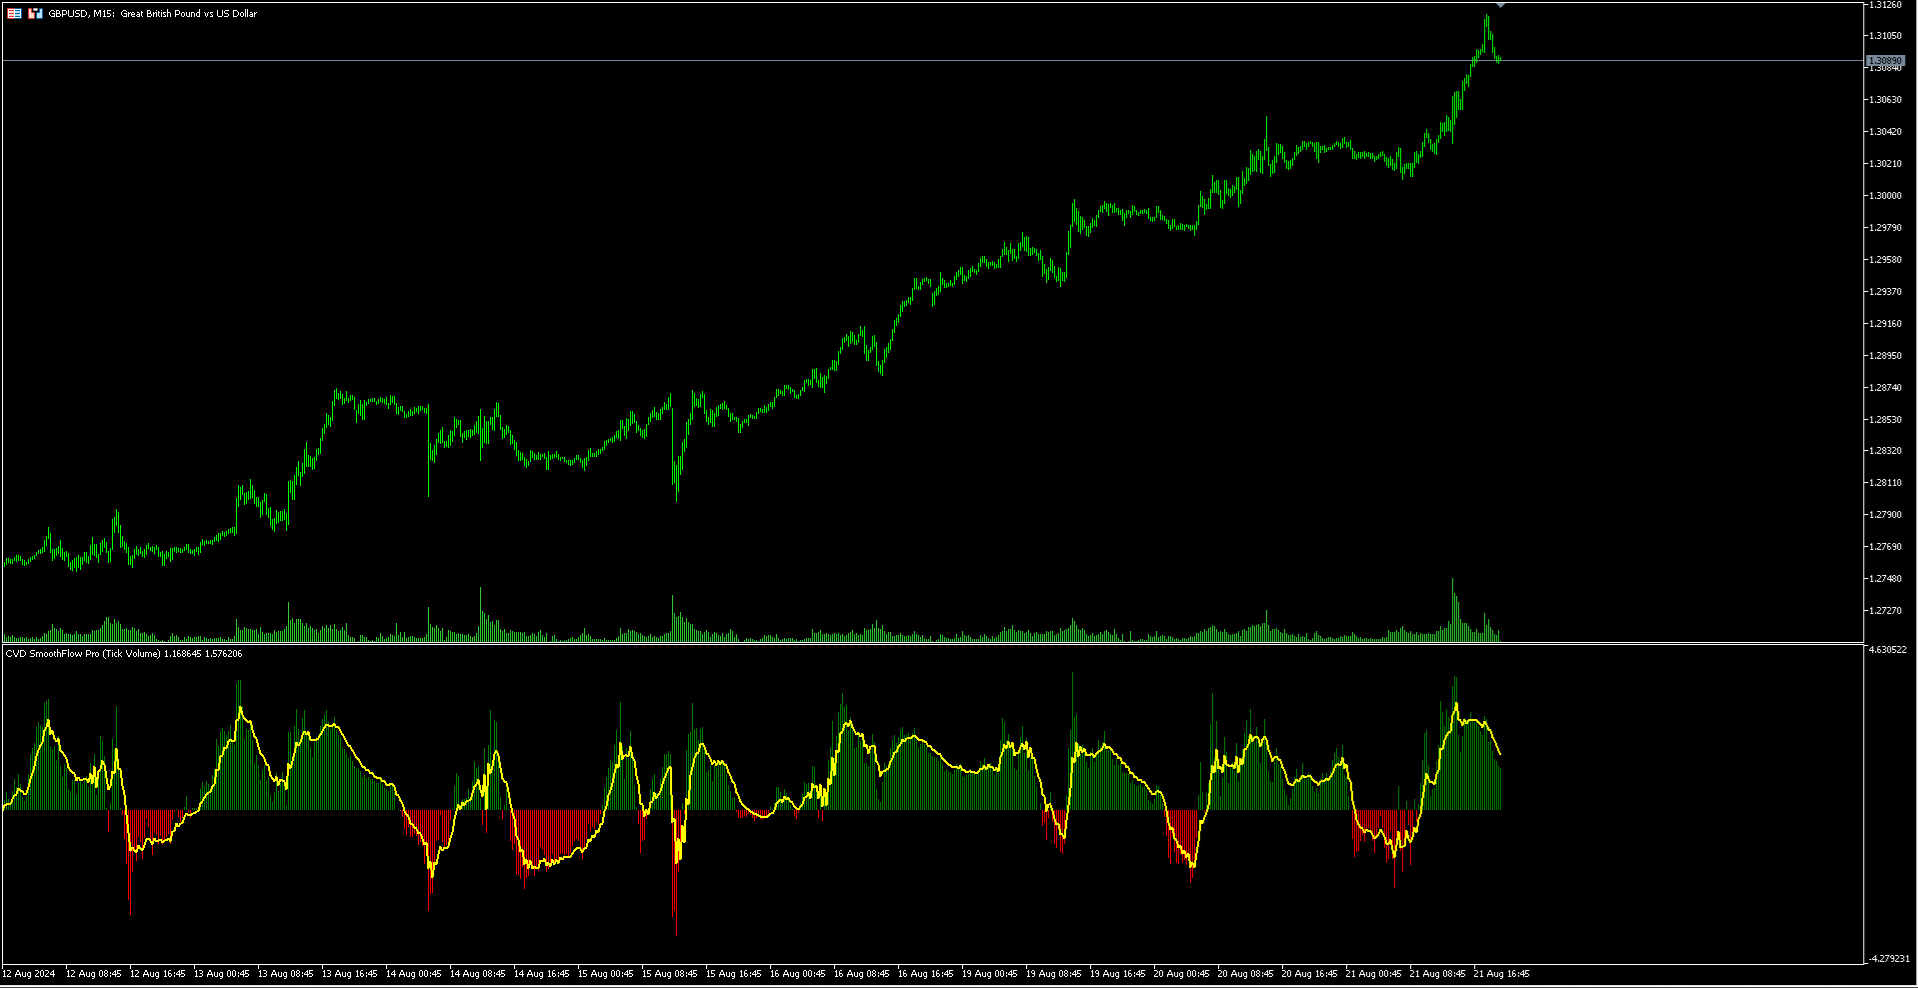
📈 Identification des Tendances : Identifiez les tendances du marché avec confiance, facilitant la prise de décisions éclairées.

💼 Applications Pratiques :

  • Surveillez l'équilibre entre acheteurs et vendeurs en temps réel pour tout actif.
  • Identifiez les renversements de tendance basés sur le volume.
  • Concentrez-vous sur les mouvements pertinents avec un filtrage précis dans le forex, les indices, les cryptomonnaies et d'autres actifs.

🔓 Version Pro Illimitée !

La version Pro offre un accès illimité à toutes les fonctionnalités, permettant des analyses détaillées et illimitées pour tout actif financier.


Produits recommandés
Value Chart Candlesticks
Flavio Javier Jarabeck
4.7 (10)
The idea of a Value Chart indicator was presented in the very good book I read back in 2020 , " Dynamic Trading Indicators: Winning with Value Charts and Price Action Profile ", from the authors Mark Helweg and David Stendahl. The idea is simple and the result is pure genius: Present candlestick Price analysis in a detrended way! HOW TO READ THIS INDICATOR Look for Overbought and Oversold levels. Of course, you will need to test the settings a lot to find the "correct" one for your approach.
FREE
Weis Waves
Flavio Javier Jarabeck
3.15 (26)
The original author is David Weis, an expert in the Wyckoff Method. The Weis Wave is a modern adaptation of the 1930's Wyckoff Method, another expert in Tape Reading techniques and Chart Analysis. Weis Waves takes market volume and stacks it into waves according to price conditions giving the trader valuable insights about the market conditions. If you want to learn more about this subject you can find tons of videos in YouTube. Just look for "The Wickoff Method", "Weis Wave" and "Volume Spread
FREE
Aggression Volume
Flavio Javier Jarabeck
3.91 (22)
Aggression Volume Indicator is the kind of indicator that is rarely found in the MQL5 community because it is not based on the standard Volume data provided by the Metatrader 5 platform. It requires the scrutiny of all traffic Ticks requested on the platform... That said, Aggression Volume indicator requests all Tick Data from your Broker and processes it to build a very special version of a Volume Indicator, where Buyers and Sellers aggressions are plotted in a form of Histogram. Additionally,
FREE
This indicator allows you to enjoy the two most popular products for analyzing request volumes and market deals at a favorable price: Actual Depth of Market Chart Actual Tick Footprint Volume Chart This product combines the power of both indicators and is provided as a single file. The functionality of Actual COMBO Depth of Market AND Tick Volume Chart is fully identical to the original indicators. You will enjoy the power of these two products combined into the single super-indicator! Below is
Weis Wave Result MT5
Sant Clear Ali Costa
Features 3 types of waves: bullish, bearish and unknown. The unknown tower comes when prices move in opposite the direction of the current tower. Label that shows the percentage remaining for the next tower. Allows you set the type of volume that will be accumulated in the towers, either real or tick volumes. Thus, the indicator works in any market, for example: stocks, futures, forex, commodities, etc. Allows you to set the required score for the tower exchange. Allows you to set the font size
VP hidden
Emr Aljnaby
4.44 (9)
The indicator works to convert normal volume into levels and determine financial liquidity control points. It is very similar in function to Fixed Volume Profile. But it is considered more accurate and easier to use than the one found on Trading View because it calculates the full trading volumes in each candle and in all the brokers present in MetaTrade, unlike what is found in Trading View, as it only measures the broker’s displayed prices. To follow us on social media platforms: tel
FREE
Was: $249  Now: $99   Market Profile defines a number of day types that can help the trader to determine market behaviour. A key feature is the Value Area, representing the range of price action where 70% of trading took place. Understanding the Value Area can give traders valuable insight into market direction and establish the higher odds trade. It is an excellent addition to any system you may be using. Inspired by Jim Dalton’s book “Mind Over Markets”, this indicator is designed to suit the
Wapv Price and volume
Eduardo Da Costa Custodio Santos
L'indicateur de prix et de volume WAPV pour MT5 fait partie de l'ensemble d'outils (Wyckoff Academy Wave Market) et (Wyckoff Academy Price and Volume). L'indicateur de prix et de volume WAPV pour MT5 a été créé pour faciliter la visualisation intuitive du mouvement du volume sur le graphique. Avec lui, vous pouvez observer les moments de pic de volume et les moments où le marché n'a aucun intérêt professionnel Identifiez les moments où le marché évolue par inertie et non par mouvement de "smart
Segmented Volume MT5
Eduardo Da Costa Custodio Santos
L'indicateur de volume segmenté MT5 a été créé pour faciliter ceux qui négocient en utilisant l'analyse des prix et des volumes, VSA, VPA, la méthode Wyckoff et le système Smart Money. Le volume segmenté fonctionne sur n'importe quel marché (Crypto, CFD, Forex, Futures, Actions...) et fonctionne à n'importe quel moment du graphique. Voyez à quel point votre interprétation est facile : #Vert : Volume bien supérieur à la moyenne du marché #Rose foncé : Volume supérieur à la moyenne #Bleu : Volume
If you like this project, leave a 5 star review. Follow on TikTok: @quantum.trader       [ Any Symbol Can Be ADDED ]       DM me for adding any Pair symbol, crypto, index, stock or anything related. you can also DM me in TikTok [@quantum.trader] Works on [ EURUSD-GBPUSD-GBPJPY-USDJPY-XAUUSD ] This indicator calculate and draw the Prediction or Forecast the peaks of the current day ( forecast high - forecast low - forecast middle - forecast upper q - forecast lower q ) These are important
Do you use volume in your reading of the market? Certainly many traders use it, and do not imagine operating without it. The Color Histogram Volume Set indicator allows the user to choose the value that he considers interesting to monitor. When you pass this you will have visual confirmation and if you want you will also have the audible alert that is given by the indicator. Of course, there are other ways to try to find a high volume, such as assessing whether the volume
Volumes Direction MT5
William Oswaldo Mayorga Urduy
VOLUMES DIRECTION MT5 Normalement, l'indicateur de volume a un changement de couleur par défaut lorsque le volume actuel est plus élevé que le précédent, c'est important mais pas très utile. Pour cette raison, cet indicateur a été créé pour qu'en plus du volume normal, lorsque la bougie est haussière ou baissière, il les peint d'une couleur différente, par défaut bleu pour haussier et rouge pour baissier, mais ces couleurs peuvent être personnalisées selon le Le goût du commerçant. N'
VolumeDeltaBars
Stanislav Korotky
This indicator is a conventional analytical tool for tick volumes changes. It calculates tick volumes for buys and sells separately, and their delta on every bar, and displays volumes by price clusters (cells) within a specified bar (usually the latest one). The algorithm used internally is the same as in the indicator VolumeDeltaMT5 , but results are shown as cumulative volume delta bars (candlesticks). Analogous indicator for MetaTrader 4 exists - CumulativeDeltaBars . This is a limited substi
Volume by Price MT5
Brian Collard
3.6 (5)
The Volumebyprice.com Indicator for MetaTrader 5 features Volume Profile and Market Profile TPO (Time Price Opportunity). Volume and TPO histogram bar and line charts. Volume Footprint charts. TPO letter and block marker collapsed and split structure charts. Static, dynamic and flexible range segmentation and compositing methods with relative and absolute visualizations. Session hours filtering and segment concatenation with Market Watch and custom user specifications. Graphical layering, posit
Market Profile 3 ForexArby com
Hussien Abdeltwab Hussien Ryad
3.92 (13)
Market Profile 3 MetaTrader 5 indicator  version 4.70— is a classic Market Profile implementation that can show the price density over time, outlining the most important price levels, value area, and control value of a given trading session. This indicator can be attached to timeframes between M1 and D1 and will show the Market Profile for daily, weekly, monthly, or even intraday sessions. Lower timeframes offer higher precision. Higher timeframes are recommended for better visibility. It is als
FREE
Waves PRO
Flavio Javier Jarabeck
For those who appreciate Richard Wyckoff approach for reading the markets, we at Minions Labs designed a tool derived - yes, derived, we put our own vision and sauce into this indicator - which we called Waves PRO . This indicator provides a ZigZag controlled by the market volatility (ATR) to build its legs, AND on each ZigZag leg, we present the vital data statistics about it. Simple and objective. This indicator is also derived from the great book called " The Secret Science of Price and Volum
Golden Limit
Renato Fridschtein
There are no limits! Golden Limit is the ultimate indicator to get clear and easy readings of price movements on charts. It projects support and resistance ranges, calculated by statistical models involving Price Action and the Fibonacci sequence, revealing in advance the behavior of prices and the best places to trade and not to trade. It also has two moving averages to help choose the best entries. The Golden Limit method was created from a proven model. In summary: We use the names of preci
BoxInside MT5
Evgeny Shevtsov
5 (4)
This indicator calculates the volume profile and places labels that correspond to the VAH, VAL and POC levels, for each candle individually. Indicator operation features The indicator works on the timeframes from M3 to MN, but it uses the history data of smaller periods: M1 - for periods from M3 to H1, M5 - for periods from H2 to H12, M30 - for the D1 period, H4 - for the W1 period, D1 - for the MN period. The color and location of the VAL, VAH and POC labels on the current candle are consider
FREE
The VWAP indicator is our version of the popular Volume-Weighted Average Price indicator. The VWAP is the ratio between the value traded (price multiplied by the number of volume traded) and the total volume traded over a specific time period. As a result, it measures the average price of the instrument much better than the simple moving average. Although there are many ways to use the VWAP, most investors use it to calculate the daily average.  The indicator works in five modes: Moving  - In
L'indicateur construit les cotations actuelles, qui peuvent être comparées aux cotations historiques et, sur cette base, faire une prévision de l'évolution des prix. L'indicateur dispose d'un champ de texte pour une navigation rapide jusqu'à la date souhaitée. Option : Symbole - sélection du symbole que l'indicateur affichera ; SymbolPeriod - sélection de la période à partir de laquelle l'indicateur prendra des données ; IndicatorColor - couleur de l'indicateur ; HorisontalShift -
A countdown timer for the  Volume bar chart generator  and  Tick chart generator  products, which are available for download from the MQL5 Market: Tick chart generator: https://www.mql5.com/en/market/product/29215 Volume bar chart generator: https://www.mql5.com/en/market/product/47197 The counter conveniently displays the number of ticks or transactions (depending on the chart) that need to pass for a new bar to start printing. The user can set the following indicator inputs. Volume type
FREE
FRB Support and Resistance
Fernando Baratieri
5 (2)
FRB Trader - Our mission is to provide the best support to customers through conted and tools so that they can achieve the expected results FRB Support and Resistance - Indicator places lines on the chart to show Support and Resistance regions. - You can choose the timeframe you want to calculate, as well as the colors of the lines. - Algorithm calculates the points where the strengths of the asset are considered and are extremely important for decision making.
FREE
BoxChart MT5
Evgeny Shevtsov
5 (7)
The market is unfair if only because 10% of participants manage 90% of funds. An ordinary trader has slim changes to stand against these "vultures". This problem can be solved. You just need to be among these 10%, learn to predict their intentions and move with them. Volume is the only preemptive factor that faultlessly works on any timeframe and symbol. First, the volume appears and is accumulated, and only then the price moves. The price moves from one volume to another. Areas of volume accumu
UPD1 Profile Levels MT5
Vitaliy Kuznetsov
5 (3)
L'indicateur trouve les niveaux de volume de prix maximum et minimum (profil de marché) sur l'histogramme de travail pour le nombre de barres spécifié.   Profil composite. La hauteur de l'histogramme est entièrement automatique et s'adapte à n'importe quel outil et période. L'algorithme de l'auteur est utilisé et ne répète pas les analogues connus. La hauteur des deux histogrammes est approximativement égale à la hauteur moyenne de la bougie. Smart alert vous permet de vous informer sur le prix
VolumeProfile MT5
Robert Hess
3.75 (8)
Description: The Volume Profile displays detailed informations of historical trading activities at certain price levels (Market Profile). Locate the areas with the best prices in the market and get an advantage over other market participants. Features: Customizable Market Profile Shows the "fair" Value Area with 70% of all Volume Shows critical low volume zones Shows VPOC, VAL and VAH Points integrated resource management to reduce the load while working with multiple charts Works on all tim
Blahtech Supply Demand MT5
Blahtech Limited
4.54 (13)
Was: $299  Now: $99   Supply Demand uses previous price action to identify potential imbalances between buyers and sellers. The key is to identify the better odds zones, not just the untouched ones. Blahtech Supply Demand indicator delivers functionality previously unavailable on any trading platform. This 4-in-1 indicator not only highlights the higher probability zones using a multi-criteria strength engine, but also combines it with multi-timeframe trend analysis, previously confirmed swings
WAPV Weis Wave Chart Forex
Eduardo Da Costa Custodio Santos
Le Weis Wave Chart Forex pour MT5 est un indicateur de prix et de volume. La lecture du prix et du volume a été largement diffusée par Richard Demille Wyckoff sur la base des trois lois qu'il a créées : l'offre et la demande, la cause et l'effet et l'effort contre le résultat. En 1900 R.Wyckoff utilisait déjà le wave chart dans ses analyses. De nombreuses années plus tard, vers 1990, David Weis a automatisé le diagramme d'onde de R. Wyckoff et aujourd'hui nous vous apportons l'évolution du diagr
Donchian Pro
Paulo Henrique Faquineli Garcia
5 (2)
The Donchian Channel Channels are among the most popular tools of technical analysis, as they visually convey to the analyst the limits within which most price movement tends to occur. Channel users know that valuable information can be obtained at any time, whether prices are in the central region of a band or close to one of the border lines. One of the best known techniques to explore these concepts is Bollinger Bands. However, John Bollinger was not the only one to research the applicatio
FREE
Mini Chart Indicators
Flavio Javier Jarabeck
The Metatrader 5 has a hidden jewel called Chart Object, mostly unknown to the common users and hidden in a sub-menu within the platform. Called Mini Chart, this object is a miniature instance of a big/normal chart that could be added/attached to any normal chart, this way the Mini Chart will be bound to the main Chart in a very minimalist way saving a precious amount of real state on your screen. If you don't know the Mini Chart, give it a try - see the video and screenshots below. This is a gr
No Demand No Supply MT5
Trade The Volume Waves Single Member P.C.
No Demand No Supply   This indicator identifies   No Demand –No Supply candles to your chart and plots volume bars colored according to the signal. It can be applied to all timeframes or to a specific one only. It can also be used as regular volume indicator  with exceptional future of WEIGHTED VOLUME. Furthermore is has an alert notification, sound and email when a signals occurs. The indicator does not repaint but the alert will come on two candles back due to the definition of No Demand No Su
Les acheteurs de ce produit ont également acheté
Atomic Analyst MT5
Issam Kassas
4.79 (19)
Tout d'abord, il convient de souligner que cet indicateur de trading n'est ni repainting, ni redrawing et ne présente aucun délai, ce qui le rend idéal à la fois pour le trading manuel et automatisé. Manuel de l'utilisateur : réglages, entrées et stratégie. L'Analyste Atomique est un indicateur d'action sur les prix PA qui utilise la force et le momentum du prix pour trouver un meilleur avantage sur le marché. Équipé de filtres avancés qui aident à éliminer les bruits et les faux signaux, et à
Tout d'abord, il convient de souligner que ce système de trading est un indicateur non repeint, non redessiné et non retardé, ce qui le rend idéal pour le trading manuel et automatisé. Cours en ligne, manuel et téléchargement de préréglages. Le "Système de Trading Smart Trend MT5" est une solution de trading complète conçue pour les traders débutants et expérimentés. Il combine plus de 10 indicateurs premium et propose plus de 7 stratégies de trading robustes, ce qui en fait un choix polyvalent
TPSproTREND PrO MT5
Roman Podpora
4.89 (9)
TPSpro TREND PRO  - is a trend indicator that automatically analyzes the market and provides information about the trend and each of its changes, as well as giving signals for entering trades without redrawing! The indicator uses each candle, analyzing them separately. referring to different impulses - up or down impulse. Exact entry points into transactions for currencies, crypto, metals, stocks, indices!  Version MT4               DETAILED DESCRIPTION               R ecommended to use with an
TPSpro RFI Levels MT5
Roman Podpora
4.67 (9)
Reversal First Impulse levels (RFI)      INSTRUCTIONS        RUS       -       ENG              R ecommended to use with an indicator   -   TPSpro  TREND PRO -  Version MT4                 A key element in trading is zones or levels from which decisions to buy or sell a trading instrument are made. Despite attempts by major players to conceal their presence in the market, they inevitably leave traces. Our task was to learn how to identify these traces and interpret them correctly. Main functi
Top indicator for MT5   providing accurate signals to enter a trade without repainting! It can be applied to any financial assets:   forex, cryptocurrencies, metals, stocks, indices .  Watch  the video  (6:22) with an example of processing only one signal that paid off the indicator! MT4 version is here It will provide pretty accurate trading signals and tell you when it's best to open a trade and close it. Most traders improve their trading results during the first trading week with the help of
Quantum Trend Sniper
Bogdan Ion Puscasu
4.92 (48)
Présentation       Quantum Trend Sniper Indicator   , l'indicateur révolutionnaire MQL5 qui transforme la façon dont vous identifiez et négociez les inversions de tendance ! Développé par une équipe de traders expérimentés avec une expérience commerciale de plus de 13 ans,       Indicateur Quantum Trend Sniper       est conçu pour propulser votre parcours de trading vers de nouveaux sommets grâce à sa manière innovante d'identifier les inversions de tendance avec une précision extrêmement élevée
FX Power MT5 NG
Daniel Stein
5 (6)
Obtenez votre mise à jour quotidienne du marché avec des détails et des captures d'écran via notre Morning Briefing ici sur mql5 et sur Telegram ! FX Power MT5 NG est la nouvelle génération de notre très populaire indicateur de force des devises, FX Power. Et qu'est-ce que ce compteur de force de nouvelle génération offre ? Tout ce que vous avez aimé de l'original FX Power PLUS Analyse de la force de l'OR/XAU Des résultats de calcul encore plus précis Périodes d'analyse configurables individuel
FX Volume MT5
Daniel Stein
4.94 (17)
Obtenez votre mise à jour quotidienne du marché avec des détails et des captures d'écran via notre Morning Briefing ici sur mql5 et sur Telegram ! FX Volume est le PREMIER et SEUL indicateur de volume qui fournit un VRAI aperçu du sentiment du marché du point de vue d'un courtier. Il fournit des informations impressionnantes sur la façon dont les acteurs institutionnels du marché, comme les courtiers, sont positionnés sur le marché des changes, bien plus rapidement que les rapports COT. Voir c
XQ Indicator MetaTrader 5
Marzena Maria Szmit
3.5 (2)
Step into the realm of Forex trading with confidence and precision using XQ, a cutting-edge Forex indicator designed to elevate your trading game to unprecedented heights. Whether you're a seasoned trader or just stepping into the world of currency exchange, XQ Forex Indicator empowers you with the insights and signals needed to make informed trading decisions. The signal conditions are a combination of three indicators, and XQ Forex Indicator only display  medium and long-term trends . The ind
Ce tableau de bord affiche les derniers   modèles harmoniques   disponibles pour les symboles sélectionnés, ce qui vous permettra de gagner du temps et d'être plus efficace /   version MT4 . Indicateur gratuit:   Basic Harmonic Pattern Colonnes de l'indicateur Symbol :   les symboles sélectionnés apparaissent Trend   :   haussière ou baissière Pattern :   type de motif (gartley, papillon, chauve-souris, crabe, requin, cypher ou ABCD) Entry:   prix d'entrée SL:   prix du stop loss TP1:   1
TrendMaestro5
Stefano Frisetti
note: this indicator is for METATRADER4, if you want the version for METATRADER5 this is the link:  https://www.mql5.com/it/market/product/108106 TRENDMAESTRO ver 2.4 TRENDMAESTRO recognizes a new TREND in the bud, he never makes mistakes. The certainty of identifying a new TREND is priceless. DESCRIPTION TRENDMAESTRO identifies a new TREND in the bud, this indicator examines the volatility, volumes and momentum to identify the moment in which there is an explosion of one or more of these data a
Gartley Hunter Multi
Siarhei Vashchylka
5 (8)
Gartley Hunter Multi - An indicator for searching for harmonic patterns simultaneously on dozens of trading instruments and on all possible timeframes. Manual (Be sure to read before purchasing) | Version for MT4 Advantages 1. Patterns: Gartley, Butterfly, Shark, Crab. Bat, Alternate Bat, Deep Crab, Cypher 2. Simultaneous search for patterns on dozens of trading instruments and on all possible timeframes 3. Search for patterns of all possible sizes. From the smallest to the largest 4. A
Unlock key market insights with automated support and resistance lines Special Offer: Purchase now to receive free bonuses worth $89! (Read more for details) Tired of plotting support and resistance lines? This is a multi-timeframe indicator that detects and plots supports and resistance lines in the chart with the same precision as a human eye would. As price levels are tested over time and its importance increases, the lines become thicker and darker, making price leves easy to glance and ev
Volatility Trend System - est un système commercial qui fournit des signaux pour les entrées. Le système de volatilité donne des signaux linéaires et ponctuels dans le sens de la tendance, ainsi que des signaux pour en sortir, sans redessin ni délai. L'indicateur de tendance surveille la direction de la tendance à moyen terme, montre la direction et son changement. L'indicateur de signal est basé sur les changements de volatilité et montre les entrées sur le marché. L'indicateur est équipé
Gold TMAF MTF - il s'agit d'un meilleur indicateur technique boursier. L'algorithme de l'indicateur analyse le mouvement du prix d'un actif et reflète la volatilité et les zones d'entrée potentielles. Les meilleurs signaux de l'indicateur: - Pour VENDRE = limite supérieure rouge de la TMA2 au-dessus de la limite supérieure rouge de la TMA1 + indicateur fractal rouge au-dessus + flèche jaune du signal SR dans la même direction. - Pour l'ACHAT = limite inférieure bleue de la TMA2 en desso
Automated Trendlines MT5
Georgios Kalomoiropoulos
Les lignes de tendance sont l'outil d'analyse technique le plus essentiel dans le trading forex. Malheureusement, la plupart des commerçants ne les dessinent pas correctement. L'indicateur Automated Trendlines est un outil professionnel pour les traders sérieux qui vous aide à visualiser le mouvement de tendance des marchés. Il existe deux types de lignes de tendance, les lignes de tendance haussières et les lignes de tendance baissières. Dans la tendance haussière, la ligne de tendance
TPA True Price Action indicator reveals the true price action of the market makers through 100% non-repainting signals strictly at the close of a candle! TPA shows entries and re-entries, every time the bulls are definitely stronger than the bears and vice versa. Not to confuse with red/green candles. The shift of power gets confirmed at the earliest stage and is ONE exit strategy of several. There are available now two free parts of the TPA User Guide for our customers. The first "The Basics"
Présentation       Quantum Breakout PRO   , l'indicateur révolutionnaire MQL5 qui transforme la façon dont vous négociez les zones d'évasion ! Développé par une équipe de traders expérimentés avec une expérience commerciale de plus de 13 ans,       Évasion quantique PRO       est conçu pour propulser votre parcours commercial vers de nouveaux sommets grâce à sa stratégie de zone de discussion innovante et dynamique. Quantum Breakout Indicator vous donnera des flèches de signalisation sur le
If you want to find good trading opportunities, then you must trade near the Trend Line. This allows you to have a tighter         stop loss   on your trades — which improves your       risk to reward . But that’s not all… Because if you combine Trend Line with Support and Resistance, that’s where you find the best trading opportunities. Now you might wonder: “So when do I enter a trade?” Well, you can use reversal     candlestick patterns   (like the   Hammer, Bullish Engulfing, etc.) as your e
Owl Smart Levels MT5
Sergey Ermolov
4.31 (39)
Version MT4   |  FAQ L' indicateur Owl Smart Levels est un système de trading complet au sein d'un seul indicateur qui comprend des outils d'analyse de marché populaires tels que les fractales avancées de Bill Williams , Valable ZigZag qui construit la structure d'onde correcte du marché et les niveaux de Fibonacci qui marquent les niveaux exacts d'entrée. sur le marché et les endroits où prendre des bénéfices. Description détaillée de la stratégie Mode d'emploi de l'indicateur Conseiller-Assis
Gold ATR MTF - il s'agit d'un bon indicateur technique boursier. L'algorithme de l'indicateur ATR (Average True Range) analyse l'évolution du prix de l'actif et reflète la volatilité en dessinant les niveaux correspondants dans des pourcentages spécifiés (%) du prix d'ouverture de la période spécifiée (D1). Les indicateurs (rouge et/ou bleu D1 H4) de la direction du mouvement des prix du symbole et les signaux fléchés sont des aides supplémentaires et essentielles pour un trading intrajournalie
Notre tableau de bord innovant " Basic Candlestick Patterns " est spécialement conçu pour identifier automatiquement les modèles de chandeliers rentables sur le graphique. Ce tableau de bord utilise des algorithmes avancés pour analyser les graphiques de prix en temps réel et détecter un large éventail de configurations de chandeliers, des plus classiques aux plus complexes. En outre, il dispose d'une interface facile à utiliser qui vous permet de visualiser les configurations détectées sur dif
Elliot Waves Analyzer Pro
Viktor Weidenthal
3.25 (4)
Elliot Waves Analyzer Pro calculates Elliot Waves to Help Identify Trend direction and Entry Levels. Mainly for Swing Trading Strategies. Usually one would open a Position in trend direction for Wave 3 or a Correction for Wave C . This Indicator draws Target Levels for the current and next wave. Most important Rules for Elliot Wave Analysis are verified by the Indicator.  The Pro version analyzes Multiple Timeframes and shows the Subwaves and Target-Levels.   For an Overview  " Elliot Waves Anal
Bill Williams Advanced
Siarhei Vashchylka
5 (7)
Bill Williams Advanced is designed for automatic chart analysis using Bill Williams' "Profitunity" system. The indicator analyzes four timeframes at once. Manual (Be sure to read before purchasing) Advantages 1. Automatically analyzes the chart using the "Profitunity" system of Bill Williams. The found signals are placed in a table in the corner of the screen. 2. Equipped with a trend filter based on the Alligator indicator. Most of the system signals are recommended to be used only accordi
Trend Master Pro MT5
Tatiana Zyrianova
4.67 (3)
MT5 trend indicator with a probability of reaching a profit of 70-90%! Works without redrawing and delays. Trend Master PRO shows good results on all trading instruments: currencies, metals, indices, stocks, cryptocurrencies. Recommended timeframe: H1-H4. More information about the indicator is here :  https://www.mql5.com/en/blogs/post/744748 Recommendations for use Use automatic period detection           The main feature of the indicator is the self-optimization function.             Th
Trade smarter, not harder: Empower your trading with Harmonacci Patterns Special Offer: Purchase now to receive free bonuses worth $165! (Read more for details) This is arguably the most complete harmonic price formation auto-recognition indicator you can find for the MetaTrader Platform. It detects 19 different patterns, takes fibonacci projections as seriously as you do, displays the Potential Reversal Zone (PRZ) and finds suitable stop-loss and take-profit levels. [ Installation Guide | Up
Advanced Supply Demand MT5
Bernhard Schweigert
4.53 (15)
La meilleure solution pour tout commerçant débutant ou expert ! Cet indicateur est un outil de trading unique, de haute qualité et abordable car nous avons intégré un certain nombre de fonctionnalités propriétaires et une nouvelle formule. Avec cette mise à jour, vous pourrez afficher des zones à double horaire. Vous pourrez non seulement afficher un TF plus élevé, mais afficher les deux, le graphique TF, PLUS le TF supérieur : AFFICHAGE DES ZONES NICHÉES. Tous les traders Supply Demand vont ado
PipFinite Trend PRO MT5
Karlo Wilson Vendiola
4.87 (666)
Breakthrough Solution For Trend Trading And Filtering With All Important Features Built Inside One Tool! Trend PRO's smart algorithm detects the trend, filters out market noise and gives entry signals with exit levels. The new features with enhanced rules for statistical calculation improved the overall performance of this indicator. Important Information Revealed Maximize the potential of Trend Pro, please visit www.mql5.com/en/blogs/post/713938 The Powerful Expert Advisor Version Automa
Trend Forecaster
Alexey Minkov
5 (6)
The Trend Forecaster indicator utilizes a unique proprietary algorithm to determine entry points for a breakout trading strategy. The indicator identifies price clusters, analyzes price movement near levels, and provides a signal when the price breaks through a level. The Trend Forecaster indicator is suitable for all financial assets, including currencies (Forex), metals, stocks, indices, and cryptocurrencies. You can also adjust the indicator to work on any time frames, although it is recommen
AT Forex Indicator MT5
Marzena Maria Szmit
5 (4)
The AT Forex Indicator MT5 is a sophisticated trading tool designed to provide traders with a comprehensive analysis of multiple currency pairs. This powerful indicator simplifies the complex nature of the forex market, making it accessible for both novice and experienced traders. AT Forex Indicator uses advanced algorithms to detect trends, patterns and is an essential tool for traders aiming to enhance their forex trading performance. With its robust features, ease of use, and reliable signal
Plus de l'auteur
AI Channel
Thalles Nascimento De Carvalho
4 (4)
Welcome to the presentation of the AI Channel indicator, a powerful tool that uses artificial intelligence for price channel analysis in the financial market. In this session, we will explore how this revolutionary indicator can assist investors and traders in making more informed and strategic decisions. Let's get started! I. What is the AI Channel indicator? AI Channel is an indicator developed based on advanced artificial intelligence algorithms. It utilizes historical price data of financial
FREE
Master OBV FX
Thalles Nascimento De Carvalho
5 (1)
MasterOBV : Maîtrisez les Tendances du Marché avec Précision ! MasterOBV est un indicateur d'analyse technique qui combine volume , correlation positive et une Moyenne Mobile (MA) pour affiner l'identification des tendances sur les marchés financiers. Fonctionnalités Principales : Volume Intelligent : Analyse le volume des transactions pour identifier les changements significatifs dans la force de la tendance. Correlation Positive : Intègre des actifs corrélés pour obtenir une vue pl
FREE
Long Short
Thalles Nascimento De Carvalho
4.67 (3)
Indicateur Long & Short : L'outil ultime pour l'analyse des mouvements du marché Taux de réussite élevé avec des informations en temps réel Suivez les mouvements des actifs avec une grande précision et basez vos décisions sur des données actualisées instantanément. ️ Entrées plus sécurisées dans les opérations Utilisez la puissance des corrélations positives et négatives pour effectuer des entrées plus sûres et informées dans vos opérations. Facilite l'analyse à court et à long
FREE
CVD SmoothFlow
Thalles Nascimento De Carvalho
CVD SmoothFlow - Simplifiez l'Analyse du Volume avec Précision pour BTCUSD ! CVD SmoothFlow est un indicateur technique spécialement conçu pour les traders qui opèrent avec la paire BTCUSD . En utilisant le calcul de Cumulative Volume Delta (CVD) , il applique un filtrage avancé du bruit, offrant une lecture claire et précise du marché. Que propose CVD SmoothFlow ? Analyse Claire : Filtre le bruit du marché pour vous permettre de vous concentrer sur les mouvements de volume les plus pertin
FREE
Swing Point Volume
Thalles Nascimento De Carvalho
Swing Point Volume, the indicator that signals weakness and strength at the tops and bottoms. This indicador can be for used the Wyckoff Method. Information provided; - Swing on customized ticks. - Volume and points in each balance sheet. - Percentage of Displacement. - Sound alert option on top and bottom breaks. - Volume in ticks and Real Volume. - Volume HL (extreme) or (opening and closing) - Customized volume shapes.
Atr Projection
Thalles Nascimento De Carvalho
L'indicateur ATR Projeção se distingue comme un outil robuste dans l'analyse technique, conçu pour fournir des informations précises sur les limites potentielles des mouvements de prix sur les marchés financiers. Son approche flexible permet aux utilisateurs de personnaliser de manière intuitive les métriques d'analyse, en s'adaptant aux besoins spécifiques de chaque actif négocié. Fonctionnement personnalisable : Par défaut, l'ATR Projeção fonctionne en considérant 30 % de la moyenne des
Box Weis Wave
Thalles Nascimento De Carvalho
5 (1)
Élevez votre analyse avec le Weis Wave Box ! Si vous recherchez précision et clarté dans vos négociations, le Weis Wave Box est l'outil qu'il vous faut. Cet indicateur avancé offre une analyse visuelle détaillée des vagues de volume et des points de swing, vous aidant à mieux comprendre la relation entre effort et résultats sur le marché. Principales caractéristiques du Weis Wave Box : Vagues de Volume Personnalisables : Ajustez les vagues de volume en ticks pour les adapter à vos straté
Long Short Pro
Thalles Nascimento De Carvalho
Indicateur Long & Short - Version Pro : Déverrouillez le Potentiel Illimité de Votre Analyse de Marché ! Aucune Limite pour Tous les Actifs La version Pro de l’indicateur Long & Short vous offre une liberté totale pour l’utiliser sur tout actif financier. Plus de limitations – appliquez le même indicateur à tous vos actifs préférés ! Sans Limites Profitez de toutes les fonctionnalités de l’indicateur sans aucune restriction. La version Pro vous offre une expérience complète et ill
Reversal Vol Propagation
Thalles Nascimento De Carvalho
Are you tired of missing out on trading opportunities by not being able to identify price reversals in time? Do you want to maximize your profits and make informed trading decisions? Introducing the Reversal Vol Propagation Indicator, the revolutionary tool that uses neural networks and volume data to predict potential price reversals. Based on a powerful combination of advanced algorithms and cutting-edge technology, the Reversal Vol Propagation meticulously analyzes volume patterns and past pr
Didi Index Volume
Thalles Nascimento De Carvalho
Nous vous présentons le Didi Index Volume, un indicateur d'analyse technique développé par le trader brésilien Odir Aguiar, qui se distingue par son approche avancée et puissante dans l'identification des opportunités sur les marchés financiers. Disponible sur différentes plateformes, le Didi Index Volume est devenu un outil essentiel pour les traders à la recherche d'informations précises et précieuses pour leurs stratégies de trading. Cet indicateur combine le célèbre Didi Index, créé par O
Smart Binary Volume
Thalles Nascimento De Carvalho
L'indicateur Smart Binary Volume est un outil polyvalent qui combine l'analyse du volume de trading avec l'apprentissage automatique. Il peut être appliqué sur différents marchés et stratégies, y compris le scalping et d'autres types de transactions à court terme. En utilisant des algorithmes d'apprentissage automatique avancés, l'indicateur identifie des schémas complexes, générant ainsi des signaux d'achat et de vente plus précis. Buffer to Create EA. Buffer Line Gold = 0. Buffer Line Red =
TimeChannel
Thalles Nascimento De Carvalho
The "Timechannel" is a powerful technical analysis tool designed specifically for traders who want to gain deeper and more accurate insights into price movements across multiple timeframes (multi-timeframe). This indicator is an essential addition to the toolbox of any serious trader seeking to make informed and data-driven trading decisions. Key Features: Advanced Multi-Timeframe Analysis : Timechannel allows traders to analyze price movements on different timeframes simultaneously. This is cr
DeltaBook
Thalles Nascimento De Carvalho
L'indicateur Delta Book est un puissant outil d'analyse de marché qui combine l'utilisation du delta de volume avec des informations issues du carnet d'ordres pour détecter le flux des prix sur les marchés financiers tels que les actions, les contrats à terme et les cryptomonnaies. Il est important de noter que le Delta Book nécessite un accès aux données de volume en temps réel et aux informations du carnet d'ordres pour exploiter pleinement son potentiel. La caractéristique principale du Delta
Big Player Range
Thalles Nascimento De Carvalho
5 (2)
Découvrez la Puissance de "BigPlayerRange" : Votre Allié dans l'Analyse Technique du Marché Nous vous présentons BigPlayerRange , un outil avancé d'analyse technique conçu pour révéler les zones d'intérêt des investisseurs institutionnels sur le marché. Grâce à cet outil, vous pouvez identifier précisément où les principaux acteurs sont activement impliqués et comprendre comment cela peut influencer vos stratégies de trading. Principales Caractéristiques : Cartographie des Zones d'Intérêt I
Master OBV
Thalles Nascimento De Carvalho
MasterOBV : Maîtrisez les Tendances du Marché avec Précision ! MasterOBV est un indicateur d'analyse technique qui combine volume , correlation positive et une Moyenne Mobile (MA) pour affiner l'identification des tendances sur les marchés financiers. Fonctionnalités Principales : Volume Intelligent : Analyse le volume des transactions pour identifier les changements significatifs dans la force de la tendance. Correlation Positive : Intègre des actifs corrélés pour obtenir une vue pl
Smart Delta Volume
Thalles Nascimento De Carvalho
Smart Delta Volume : Précis et Adaptable aux Conditions de Marché Dynamiques Smart Delta Volume est un indicateur technique avancé conçu pour offrir une analyse précise et adaptable dans un environnement de marché en constante évolution. En utilisant des niveaux dynamiques qui s'ajustent automatiquement en fonction de la volatilité, cet indicateur fournit une vue plus complète et fiable de l'interaction entre le flux de volume et l'action des prix. Cette capacité d'adaptation est cruciale pou
VolaMetrics VSA
Thalles Nascimento De Carvalho
VolaMetrics VSA | Un Puissant Allié dans l'Analyse Technique Le VolaMetrics VSA est un indicateur d'analyse technique qui combine la méthode Volume Spread Analysis (VSA) avec une analyse détaillée du volume des transactions . Conçu pour identifier et suivre les mouvements significatifs des prix , le VolaMetrics VSA utilise l'interaction entre volume et écart de prix pour fournir des insights précieux qui peuvent aider à prendre des décisions de trading. Les Fondements de la Volume Spread Anal
SwingVolumePro
Thalles Nascimento De Carvalho
Vue d'ensemble SwingVolumePro est un indicateur avancé et polyvalent, conçu pour être utilisé sur une large gamme d'actifs financiers et pour supporter différents styles de trading. Basé sur une analyse rigoureuse du volume et du prix, il fournit des signaux clairs et précis permettant aux traders de tous niveaux de prendre des décisions éclairées basées sur des données de haute qualité. Principales caractéristiques Polyvalence: SwingVolumePro peut être appliqué à divers actifs, y compr
Filtrer:
Aucun avis
Répondre à l'avis