RSI Oscillator Breakout
- Indicateurs
- Mohamed Hassan Mohamed Hassan Alsherbiny
- Version: 1.0
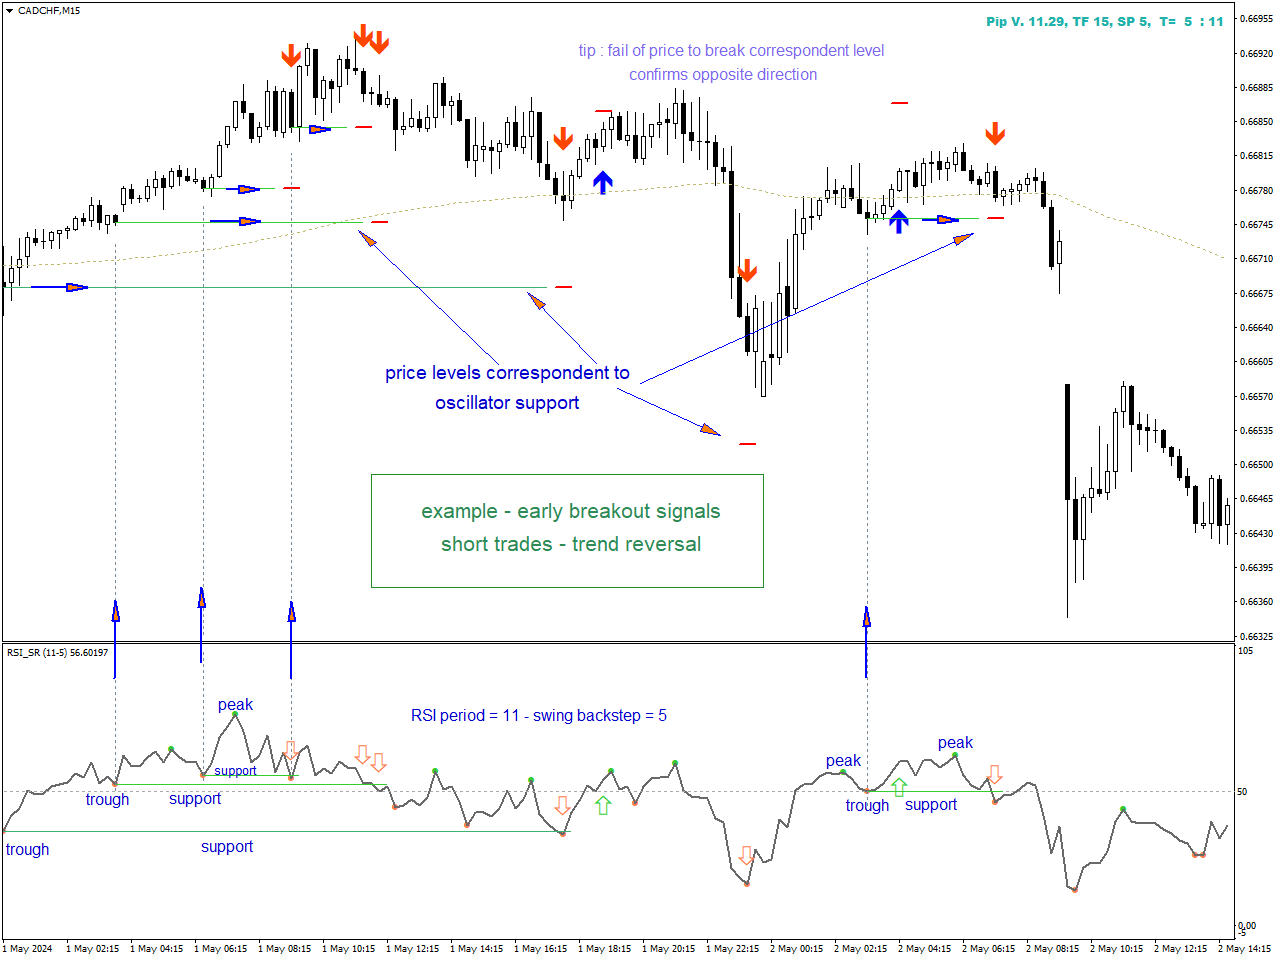
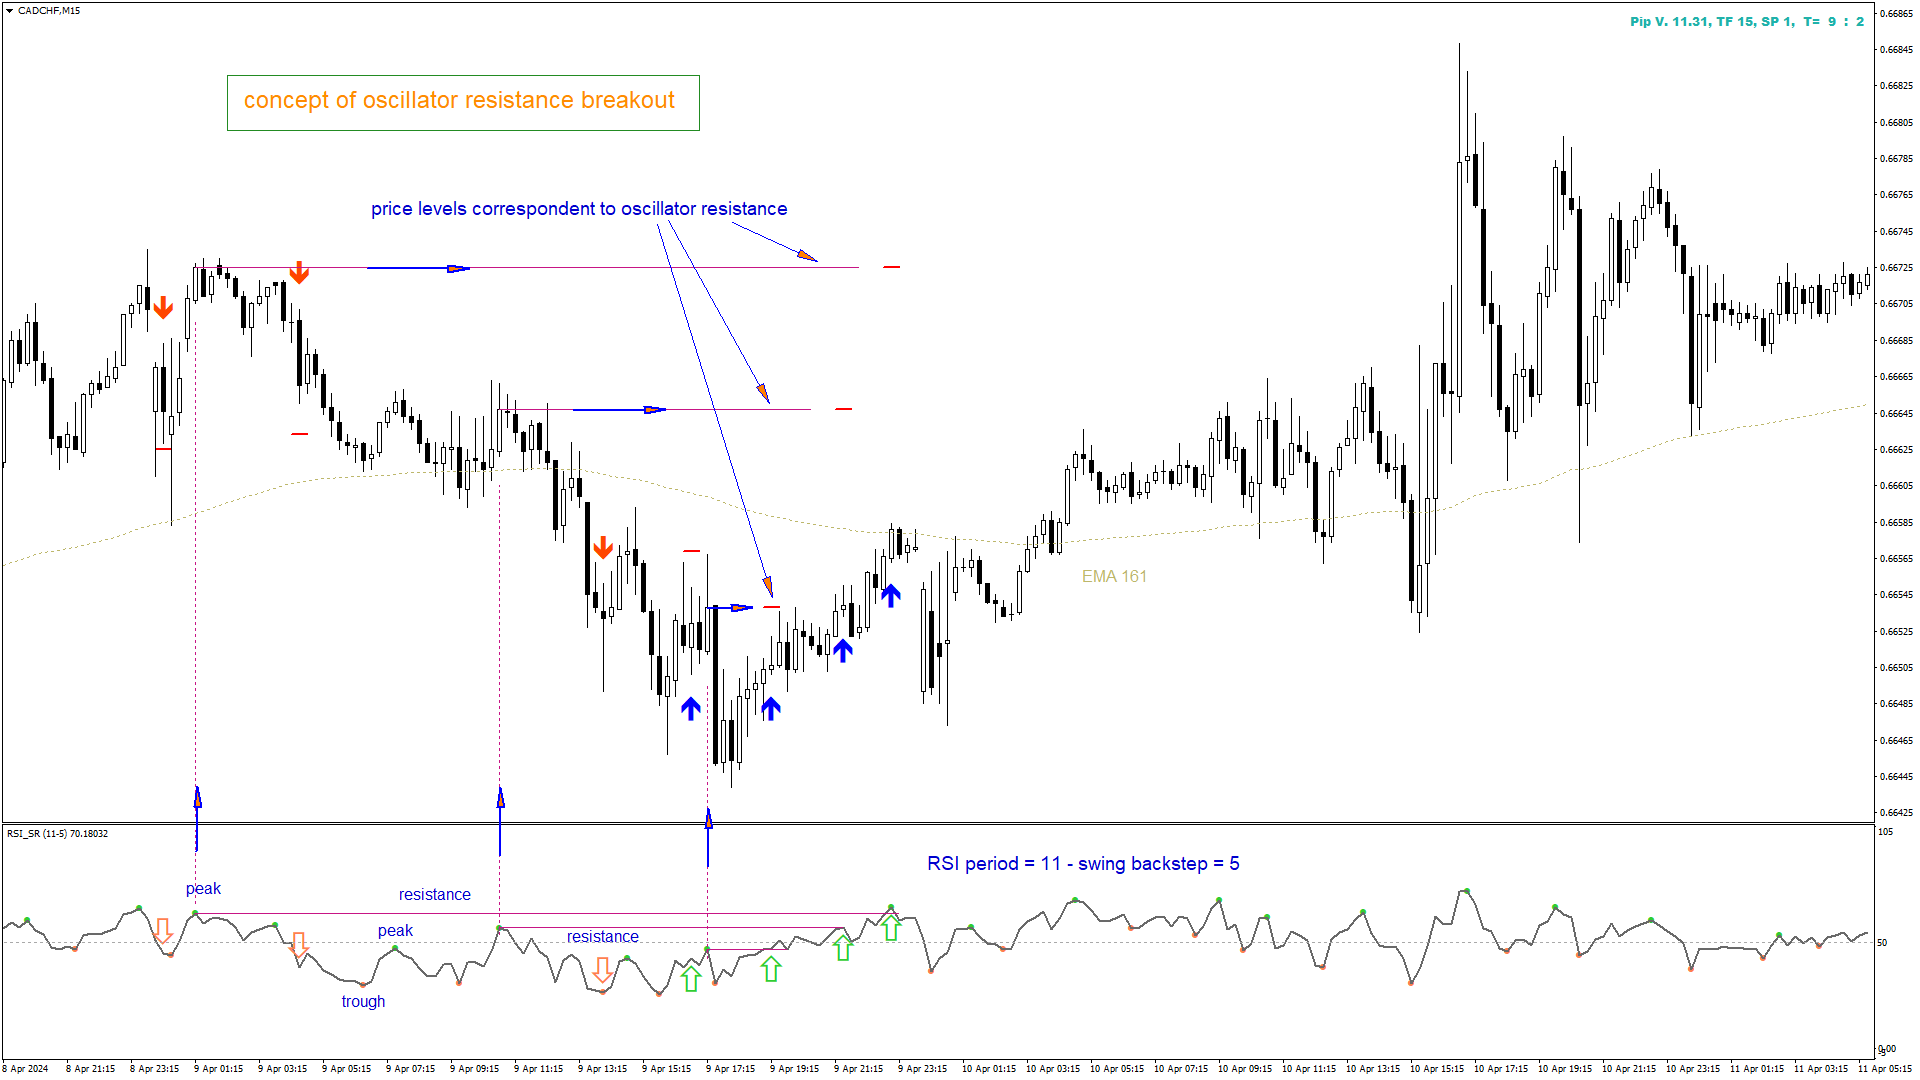
The likelihood of farther price movement increases when Relative Strength Index oscillator "RSI" breaks through its historical resistance levels in conjunction with prices breakout of resistance levels. It's strongly encouraged to confirm price breakout with oscillator breakout since they have comparable effects to price breaking support and resistance levels; similar perception is applied to short trades.
Concept is based on find swing levels which based on number of bars by each side to confirm peak or trough and in turn subjected to change by indicator settings "swing backstep".
Concept of oscillator support & resistance breakout is explained by the first & second screenshot. Thresholds have been provided to utilize if required, but remember to disable when looking for the earliest reversal signal.
Indicator signals are shown only on chart; separate window shown by screenshots depicted only for illustration purpose; however, in case of desire to have signals displayed in separated window, pertained indicator could be found at https://www.mql5.com/en/market/product/122045
Having desire to use the indicator in your EA, consider buffer no 3 for long trades, and buffer no 4 for short trades. Indicator recommended to be used coinciding with other indicators for price support and resistance, supply & demand zones, and/or trend indicator/s
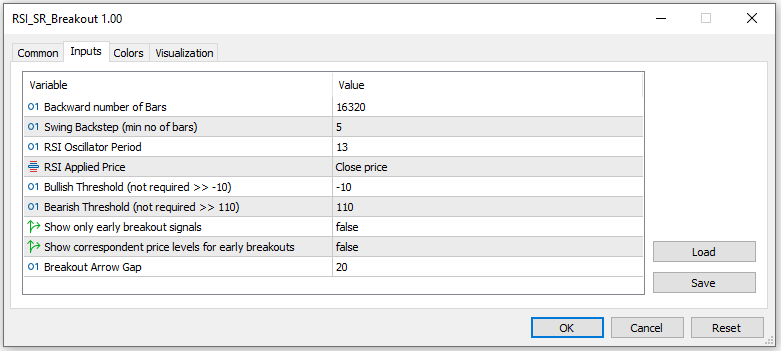
indicator setting:
- Backward number of Bars : No of backward bars in demand to analyse by indicator
- Swing Backstep (min no of bars) : minimum no of bars to form peak or trough by each side
- RSI oscillator Period : applied number of bars for RSI calculation
- RSI applied price : price type used for RSI calculation
- Bullish Threshold (if not required >> -10.0) : minimum RSI value to consider overbought and display signal; having no desire to use threshold and display signals of any breakout, use a very low value (ex. -10.0)
- Bearish Threshold (if not required >> +110.0) : maximum RSI value to consider oversold and display signal; having no desire to use threshold and display signals of any breakout, use a very high value (ex. +110)
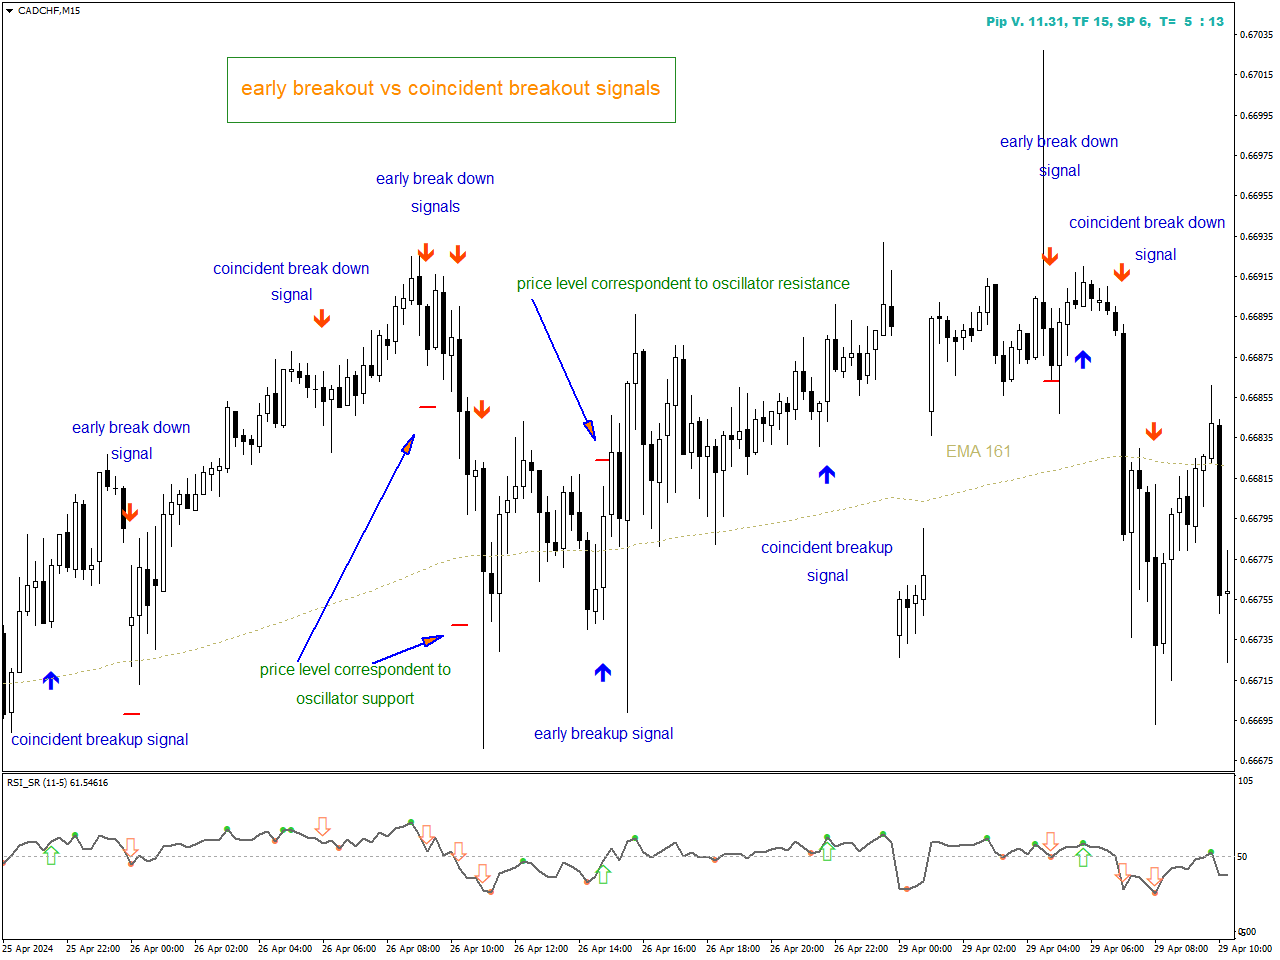
- Show only early breakout signals : Only display oscillator breakouts when occurs together with delay of price breakout (if required).
- Show correspondent prices for early breakouts : show price levels corresponding to oscillator early broken levels
- Breakout Signal Gap : controls the distance between signal arrow and bar wick
Note: No indicator will guarantee 100% of winning trades, but trader shall backtest for optimized setting in conjunction with other indicators
MT4 version available at https://www.mql5.com/en/market/product/63662