HiperCube Renko Candles
- Indicateurs
- Adrian Lara Carrasco
- Version: 1.1
- Mise à jour: 21 août 2024
Bienvenue sur HiperCube Renko Candles
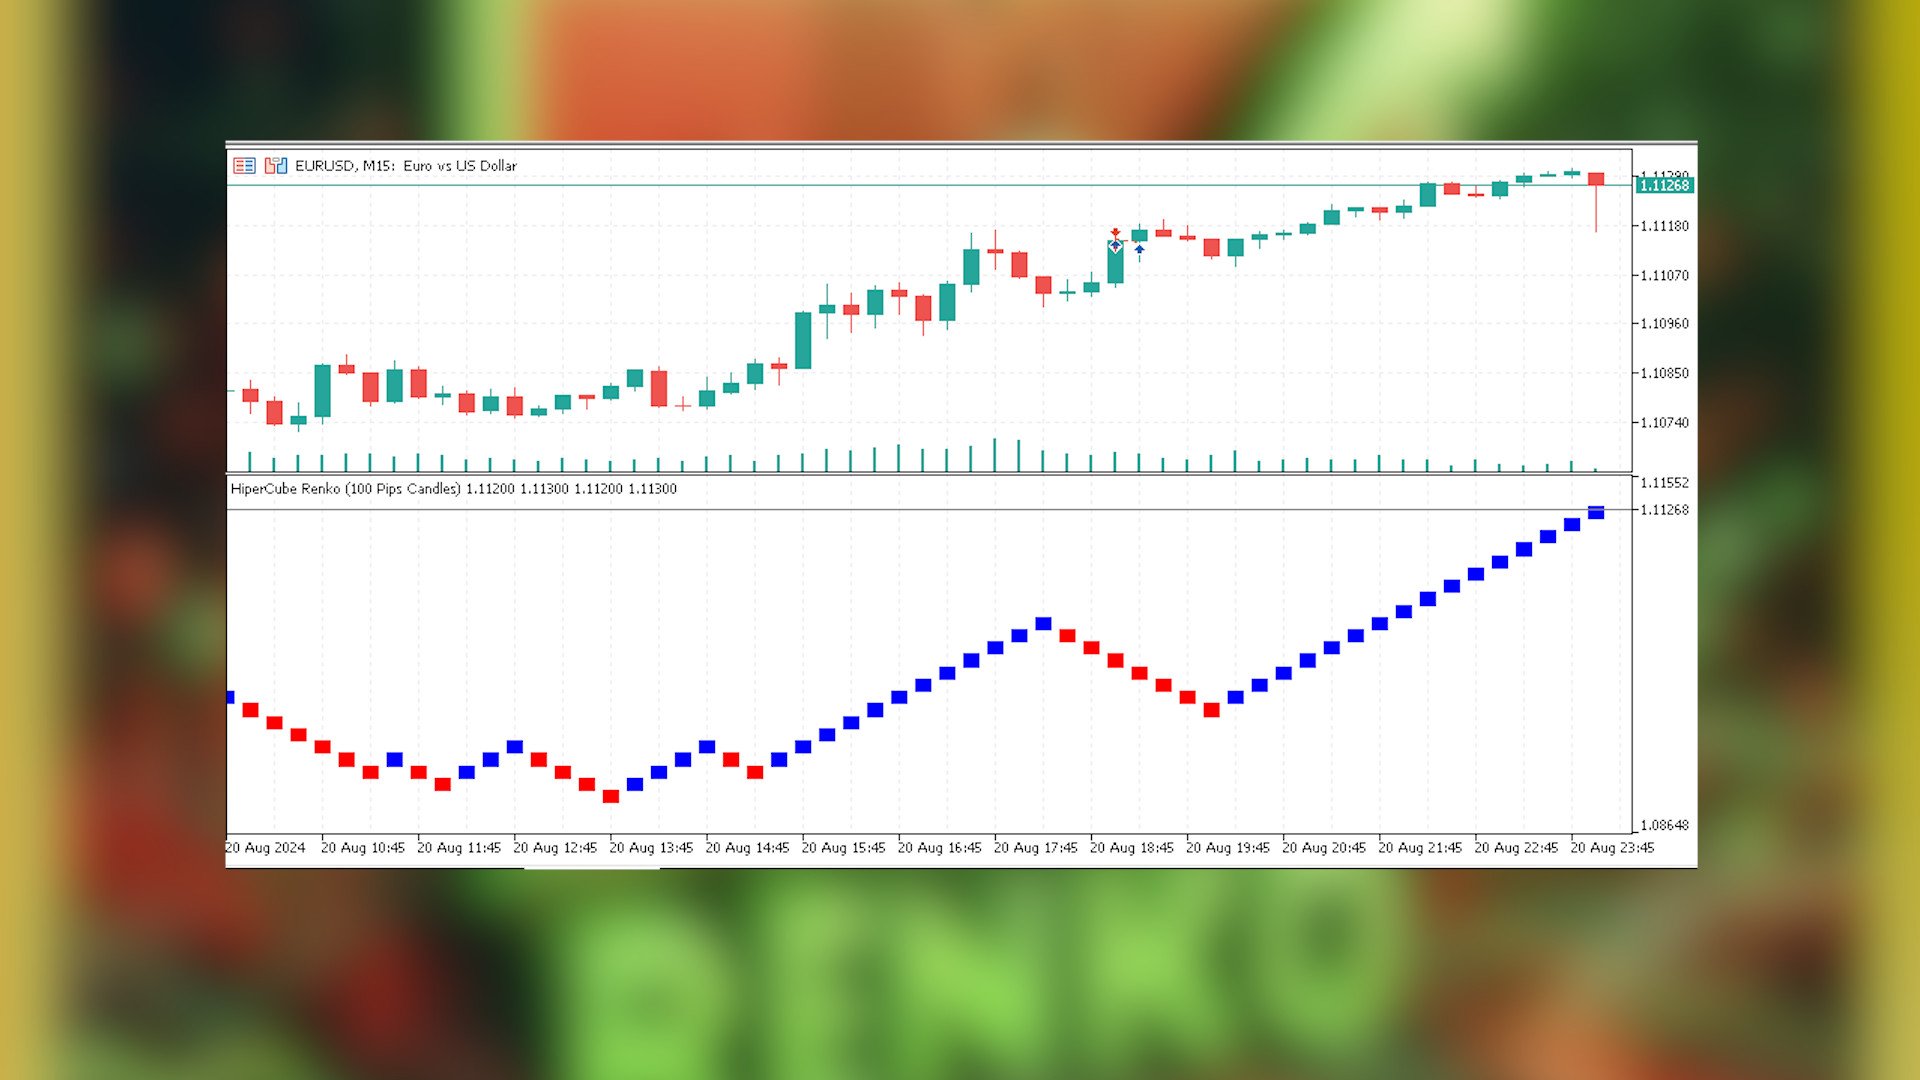
Cet indicateur vous fournit une véritable information sur la transformation du marché en Renko Candle Style.
Définition
Les graphiques Renko sont un type de graphique financier qui mesure et trace les variations de prix, en utilisant des briques (ou des barres) pour représenter les mouvements de prix. Contrairement aux graphiques en chandeliers traditionnels, les graphiques Renko n'affichent pas d'informations temporelles, se concentrant uniquement sur les fluctuations de prix.
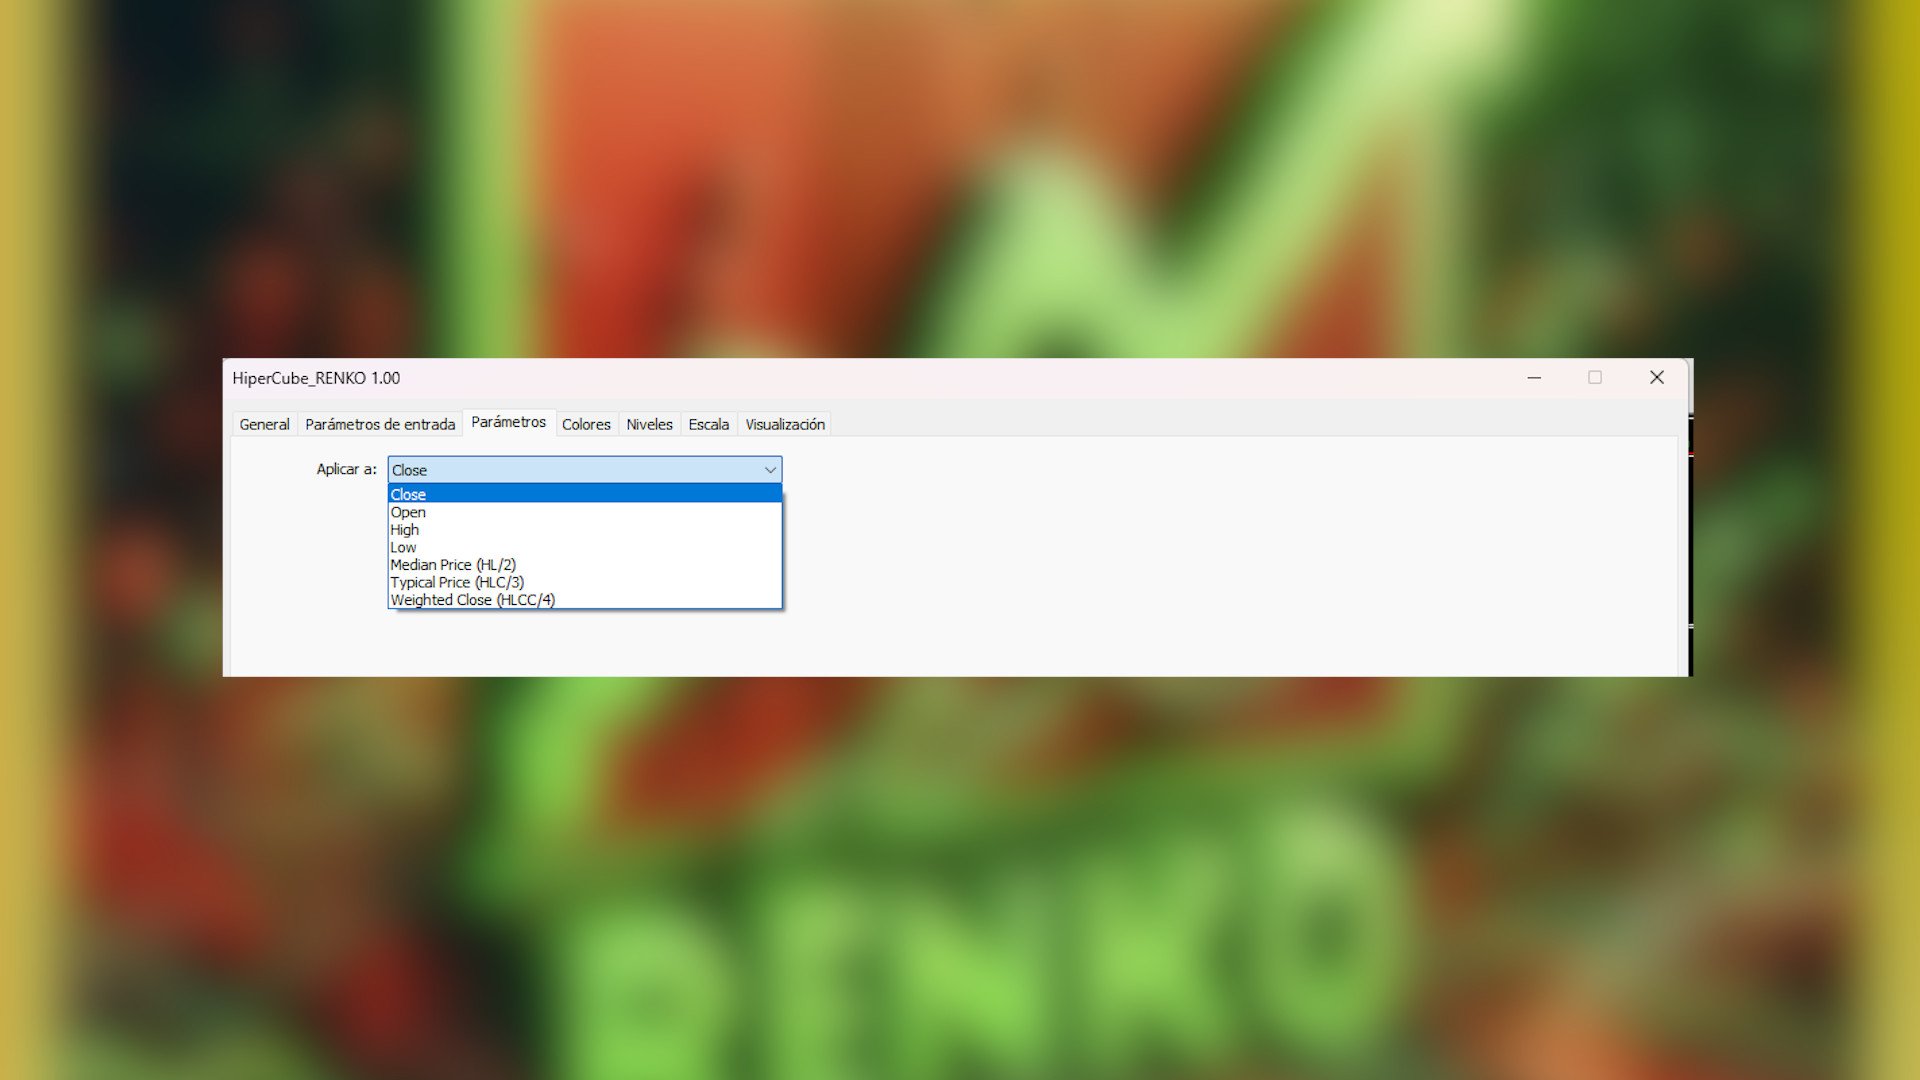
Caractéristiques :
- Indicateur dans des fenêtres séparées
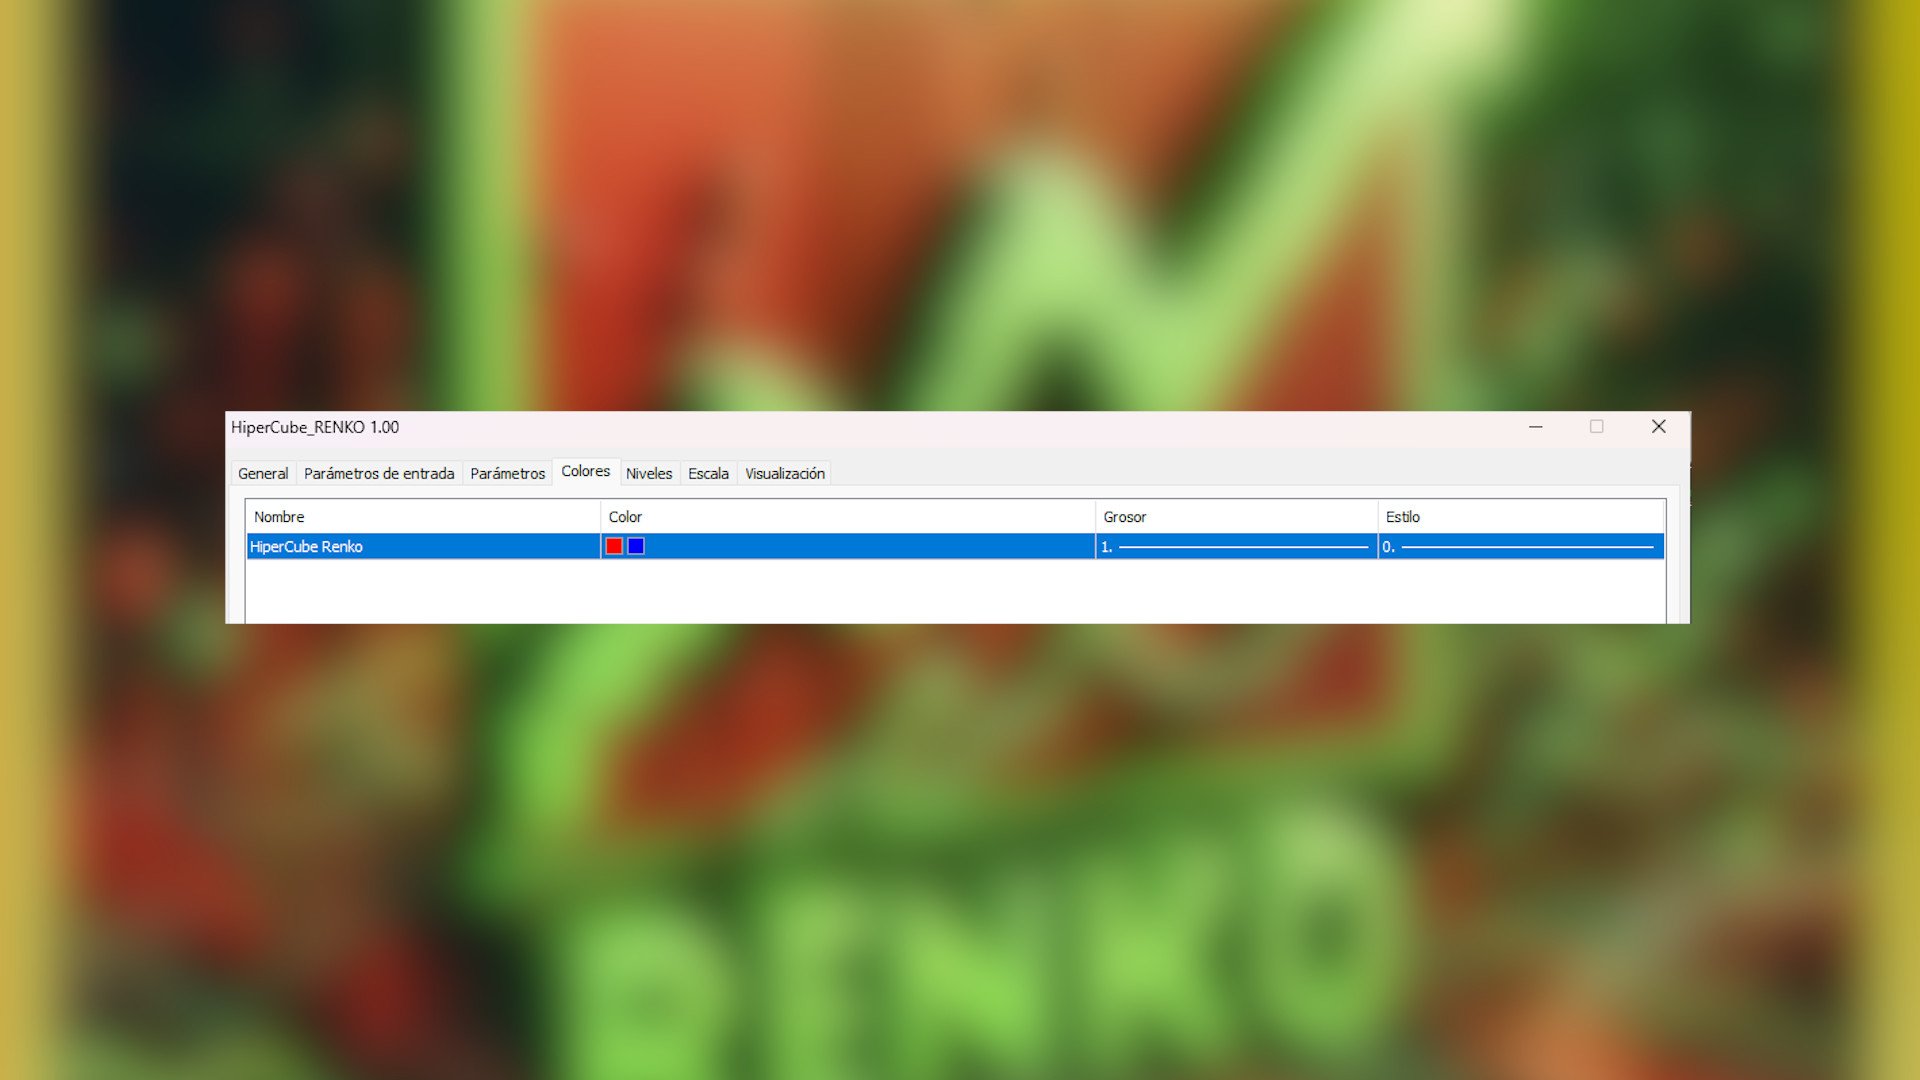
- Personnalisez les couleurs de vos bougies
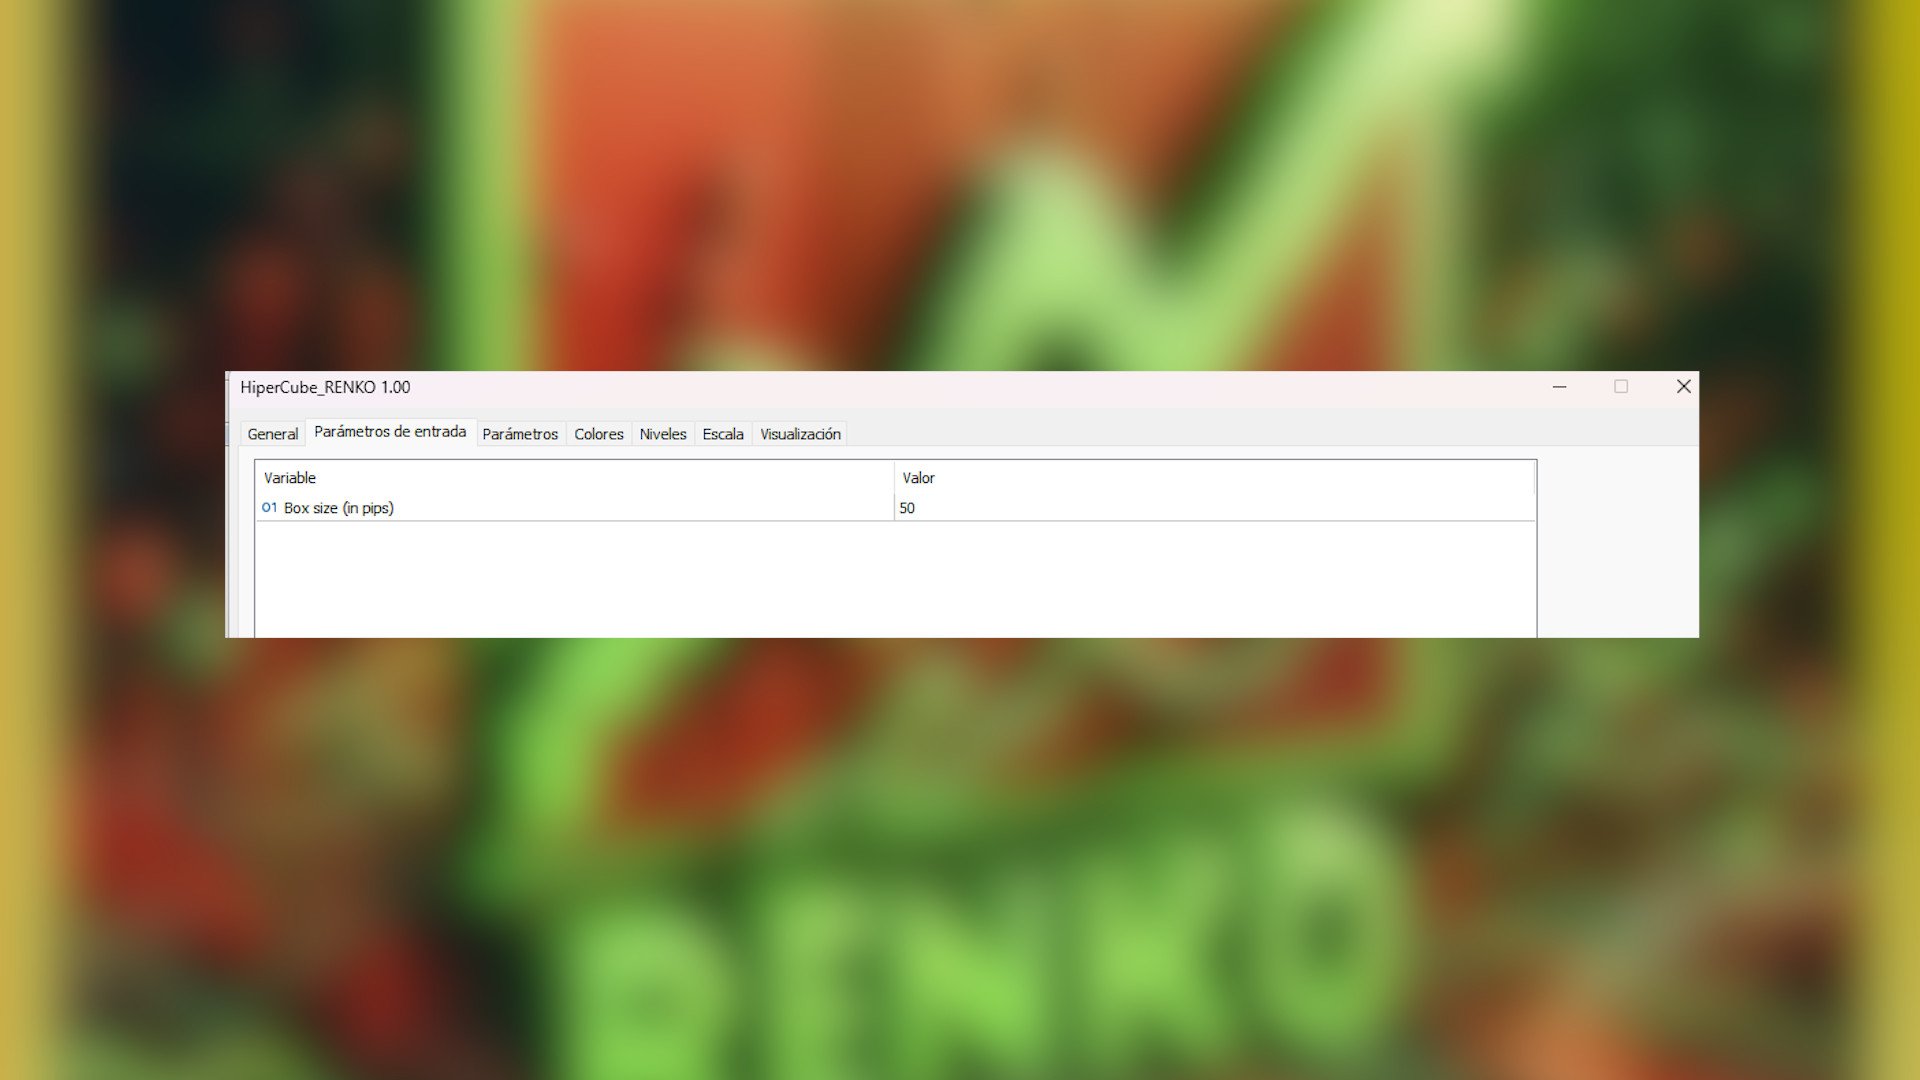
- Taille personnalisée des bougies/briques en pips
- Chat gpt et l'IA ont été utilisés pour le développer
Exemple de stratégie avec Renko :
- Identifiez la tendance
- attendez le retrait et l'engloutissement avec les bougies Renko
- Mettez votre entrée
- SL Lower of engulfing
- TP at Risk Reward 1:2, 1:3...
Notez qu'il s'agit d'un exemple et qu'il peut s'agir d'une stratégie de base ou nouvelle, mais essayez de le tester avant de l'utiliser sur des comptes réels, ces informations sont uniquement destinées à vous aider à comprendre comment utiliser l'indicateur hipercube des bougies Renko