• Aperçu
  • Avis
  • Commentaires

Bitcoin Expert

- Real price is 500$ - Limited Discount (It is now 99$)

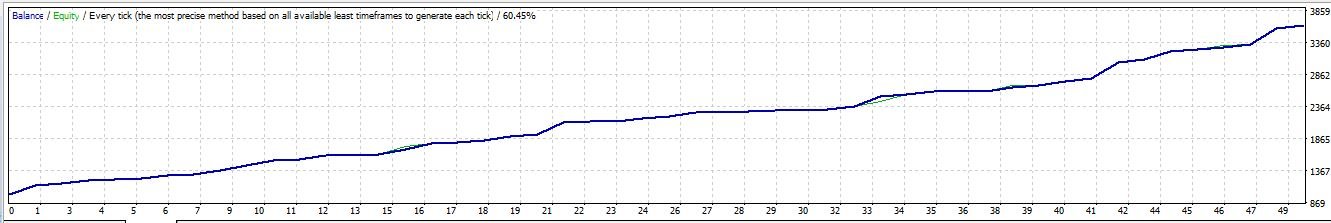
Welcome, Bitcoin Expert opens trade with Highly profit, Fixed Stop loss.

No Martingale, No Grid, No Scam


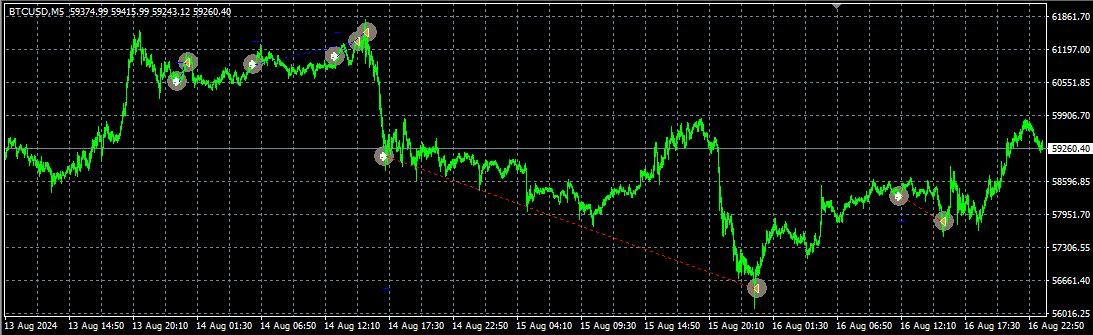
It is fully focused on exploiting the volatility of the Bitcoin market by trading the breakouts of support and resistance levels.

The focus of the EA lies on safety, which translates a very good risk/reward ratio on the trades.

All you have to do is set the lot size and decide whether you want the Bitcoin Robot to trade 7 days and 24 hours a day or on specific days and hours.

Features:

  • News filter
  • All updates for free
  • Popular BTCUSD pair
  • A tested product developed by skilled programmers
  • Trading 7 days a week or on specific days and hours 
  • Quick installation, only one parameter needs to be changed
  • Private group with dedicated support that will assist you at every step
  • All positions are protected by Take Profit, Stop Loss, Trailing Stop and Break Even
  • No grid, no martingale, no hedging.

Parameters:

  • Lots - the fixed lots size
  • Lots  - the percent lots size
  • Take profit - is a set as default, no need to change
  • Stop Loss - is set as default, no need to change
  • The magic number - can be changed to any number

Information:

  • Pair: BTCUSD
  • Timeframe: M5
  • Minimum lots: 0.01
  • Platform: Meta Trader 4
  • Minimum deposit: 100
  • Type of account: Hedging, Zero, Cent, Micro, Standard, Premium or ECN


Plus de l'auteur
- Real price is 80$ - 40% Discount ( It is 49$ now ) Contact me for instruction, any questions! Introduction The breakout and retest strategy is traded support and resistance levels. it involves price breaking through a previous level.  The break and retest strategy is designed to help traders do two main things, the first is to avoid false breakouts. Many false breakouts start with a candlestick that breaks out of a level but ends with an immediate candlestick that brings the price back into t
-   Real price is 200$   - 60% Discount (It is now 79$) - Pass your challenge in 1 hour Welcome to the next generation of trading,   HFT Prop Firm Bot only opens   one trade at a time   with   Highly profit,   Fixed Stop loss and Very low Draw-down. Live Monitoring (Passed in 1 day): myfxbook.com/portfolio/hft-prop-firm/11004800 No Martingale, No Grid, No Scam What is HFT Prop Firm? High-frequency trading (HFT) systems are based on sophisticated algorithms that can execute trades with lightenin
-   Real price is 70$   - 50% Discount ( It is 35$ now ) Contact me for instruction, any questions! Introduction A flag can be used as an entry pattern for the continuation of an established trend. The formation usually occurs after a strong trending move. The pattern usually forms at the midpoint of a full swing and shows the start of moving. Bullish flags can form after an uptrend, bearish flags can form after a downtrend. Flag Pattern Scanner Indicator It is usually difficult for a trade
Contact me for instruction, any questions! Introduction The breakout and retest strategy is traded support and resistance levels. it involves price breaking through a previous level.  The break and retest strategy is designed to help traders do two main things, the first is to avoid false breakouts. Many false breakouts start with a candlestick that breaks out of a level but ends with an immediate candlestick that brings the price back into the level. The second thing that the breakout and re
It is FREE on EURUSD chart. All Symbols version! Contact me for any questions Introduction The breakout and retest strategy is traded support and resistance levels. it involves price breaking through a previous level.  The   break and retest   strategy is designed to help traders do two main things, the first is to avoid false breakouts. Many false breakouts start with a candlestick that breaks out of a level but ends with an immediate candlestick that brings the price back into the level. The
FREE
-   Real price is 90$   - 50% Discount ( It is 45$ now ) Contact me for instruction, any questions! Introduction V Bottoms and Tops are popular   chart patterns   among traders due to their potential for identifying trend reversals. These patterns are characterized by sharp and sudden price movements, creating a V-shaped or inverted V-shaped formation on the   chart . By recognizing these patterns, traders can anticipate potential shifts in market direction and position themselves according
Contact me for instruction, any questions! Introduction The Elliott Wave in technical analysis describes price movements in the financial market that are related to changes in trader sentiment and psychology. The 5 W Pattern (Known as 3 Drives) is an Elliott Wave pattern that is formed by 5 consecutive symmetrical moves up or down. In its bullish form, the market is making 5 drives to a bottom before an uptrend forms. In a bearish 5-drive, it is peaking before the bears take over.  5W Pattern S
-   Real price is 70$   - 50% Discount ( It is 35$ now ) Contact me for instruction, any questions! Introduction The Elliott Wave in technical analysis describes price movements in the financial market that are related to changes in trader sentiment and psychology. The 5 W Pattern (Known as 3 Drives) is an Elliott Wave pattern that is formed by 5 consecutive symmetrical moves up or down. In its bullish form, the market is making 5 drives to a bottom before an uptrend forms. In a bearish 5-dri
-   Real price is 60$   - 50% Discount ( It is 30$ now ) Contact me for instruction, any questions! Introduction Triangle chart patterns are used in   technical analysis , which is a trading strategy that involves charts and patterns that help traders identify trends in the market to make predictions about future performance.   Triangle Pattern Scanner Indicator It is usually difficult for a trader to recognize classic patterns on a chart, as well as searching for dozens of charts and tim
Contact me for instruction, any questions! Introduction Chart patterns   are an essential tool traders and investors use to analyze the future price movements of securities. One such pattern is the triple bottom or the triple top pattern, which can provide valuable insights into potential price reversals. This pattern forms when a security reaches a low   price level   three times before reversing upward or reaches a high price level three times before reversing downward.   Triple Top Bottom
Contact me for instruction, any questions! Introduction V Bottoms and Tops are popular   chart patterns   among traders due to their potential for identifying trend reversals. These patterns are characterized by sharp and sudden price movements, creating a V-shaped or inverted V-shaped formation on the   chart . By recognizing these patterns, traders can anticipate potential shifts in market direction and position themselves accordingly.  V pattern is a powerful bullish/bearish reversal pattern
Contact me for instruction, any questions! Introduction A flag can be used as an entry pattern for the continuation of an established trend. The formation usually occurs after a strong trending move. The pattern usually forms at the midpoint of a full swing and shows the start of moving. Bullish flags can form after an uptrend, bearish flags can form after a downtrend. Flag Pattern Scanner Indicator It is usually difficult for a trader to recognize classic patterns on a chart, as well as sear
Filtrer:
Aucun avis
Répondre à l'avis