Volatility Ratio Mt5
- Indicateurs
- Noiros Tech
- Version: 1.0
YOU CAN NOW DOWNLOAD FREE VERSIONS OF OUR PAID INDICATORS . IT'S OUR WAY OF GIVING BACK TO THE COMMUNITY !
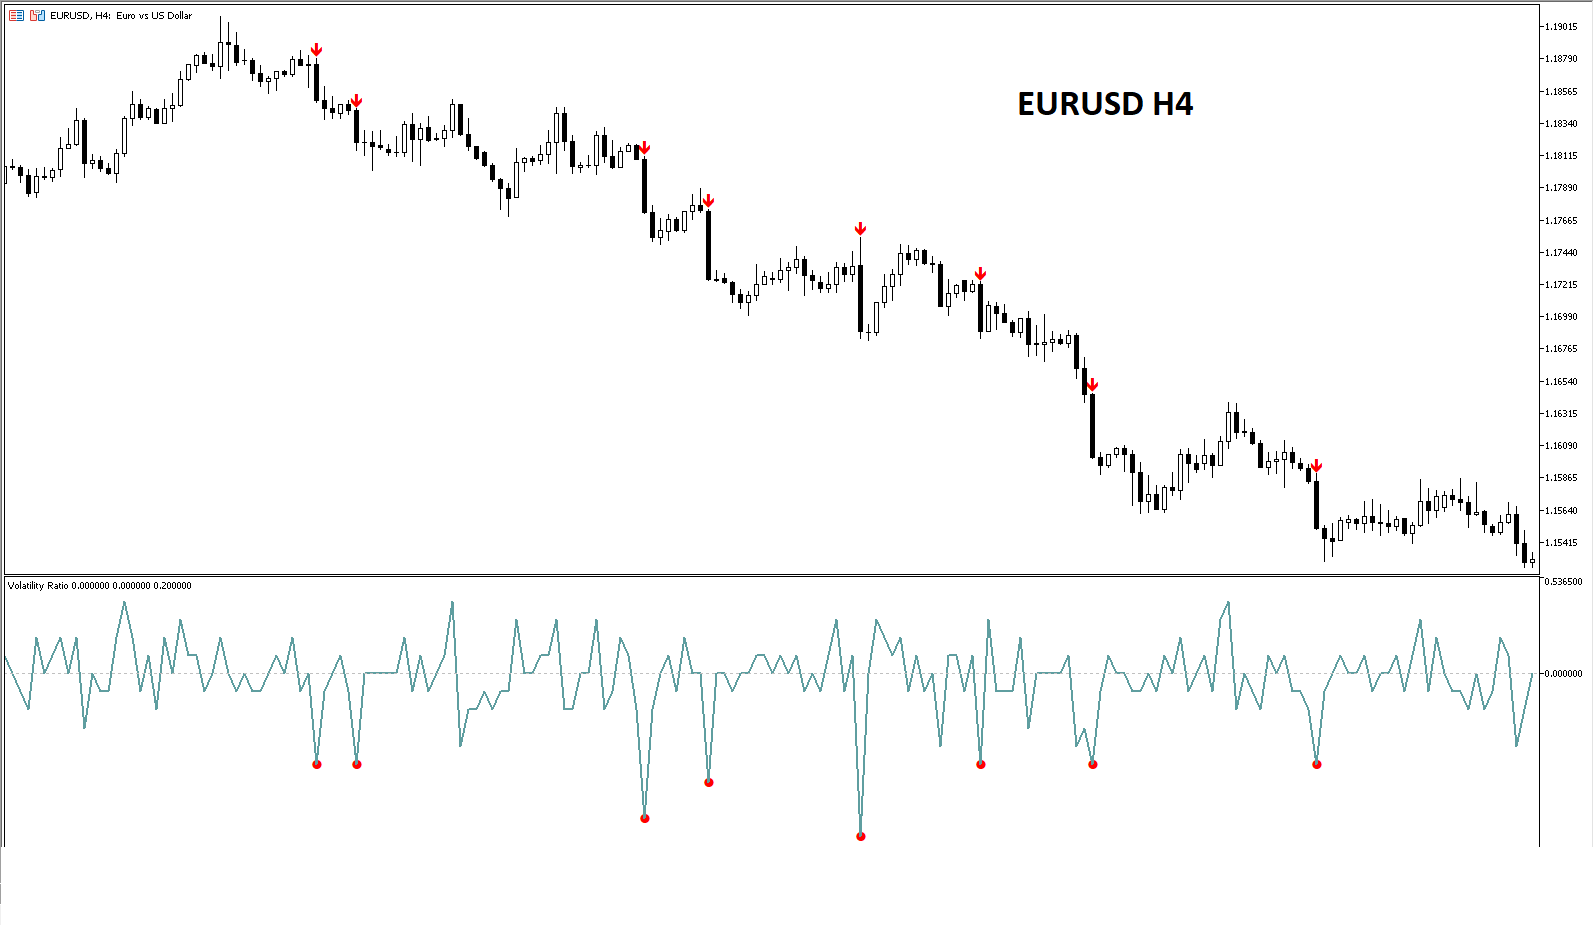
The Volatility Ratio was developed by Jack D. Schwager to identify trading range and signal potential breakouts. The volatility ratio is defined as the current day's true range divided by the true range over a certain number of days N (i.e. N periods). The following formula is used to calculate the volatility ratio:
Volatility Ratio (VR) = Today's True Range/True Range over N number of days
To calculate the volatility ratio, the true range is calculated using the following formula:
Today's True Range = MAX (today's high, yesterday's close) - MIN (today's low, yesterday's close)
and
True Range over N number of days= MAX (Day1 High, Day 2 High, ...Day N High, Day 0 Close) minus MIN(Day1 Low, Day 2 Low, ...Day N Low, Day 0 Close)
For example, the volatility ratio for a stock with a true range of 1.5 and a true range over the last 10 days of 3.5 would be 1.5/3.5 = 0.428. This volatility ratio is bordering on significant. No rules or numbers are set in stone, but a volatility ratio higher than 0.5 will generally signify to some traders that a reversal is likely.
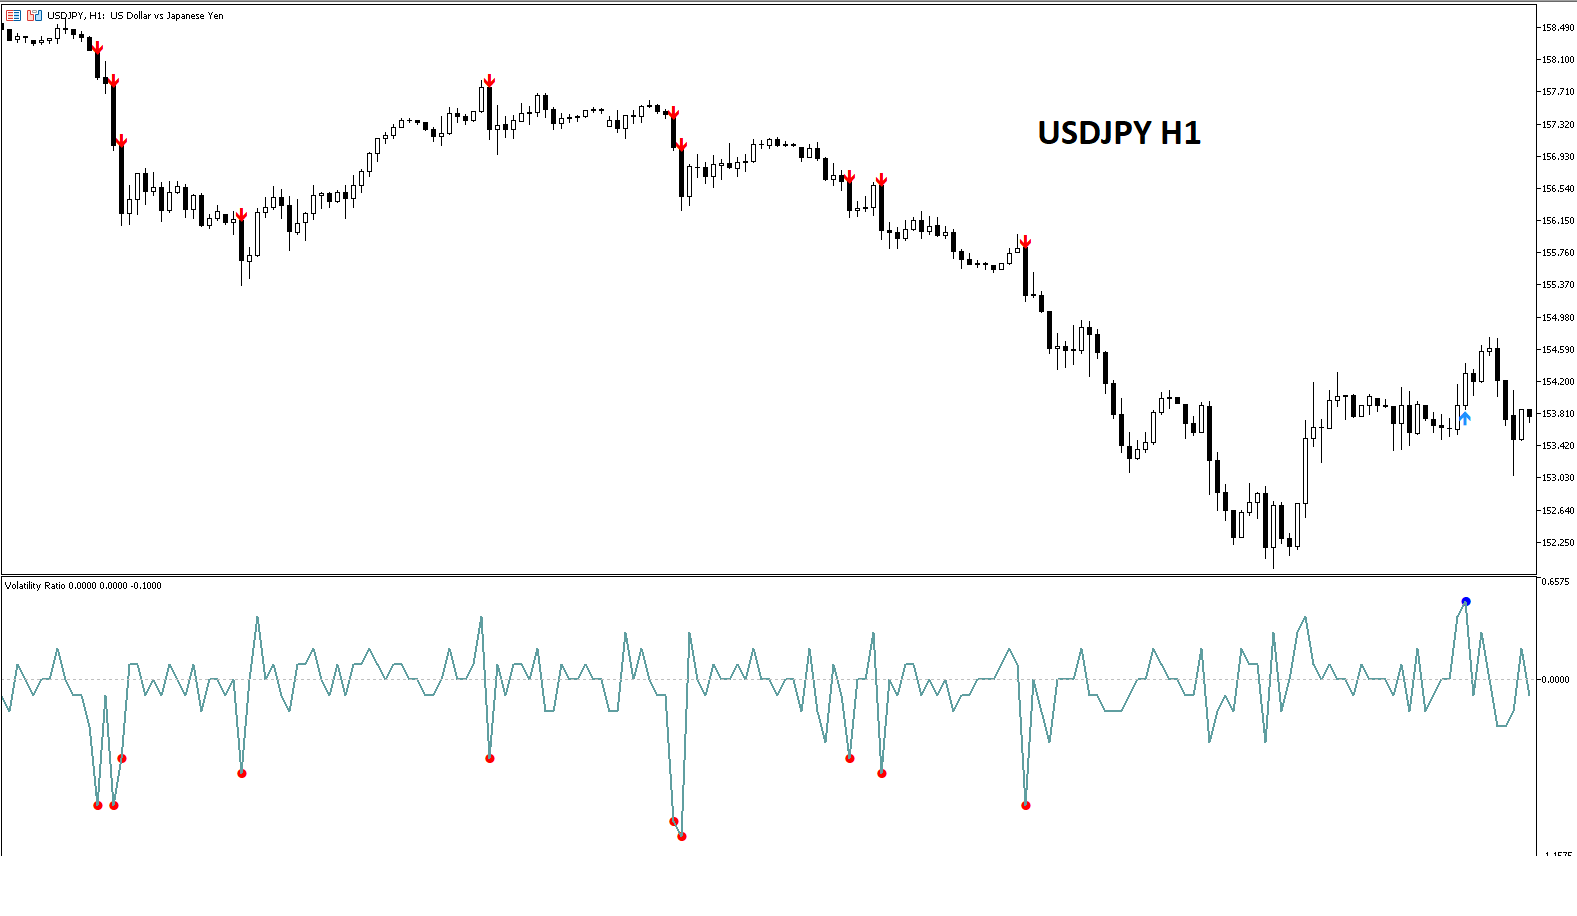
How to Use Volatility Ratio
The use of a volatility ratio helps to identify situations where the price of a stock has moved out of its true range and may signal possible reversal days in the near future.
The volatility ratio identifies for traders time periods when price has exceeded its most recent price range to an extent significant enough to constitute a breakout. Precise readings that indicate a breakout are usually adapted by traders to the specific stock or market they are trading, but a commonly used reading is 0.5. This level represents the point at which the current true range is equal to twice the previous true range. To confirm breakout signals given by the volatility ratio indicator, traders often use other technical indicators such as volume, since trading volume generally increases sharply during market breakouts.
Input menu
- Period - This is the period setting for the Average True Range indicator used in the calculation of the volatility ratio indicator. (Period of 14 is widely used).
- SELECTION - Select the ratio for average true range calculation, it can be from High to Low or Highest Close to Lowest Close.
- Min_Ratio - Minimum Volatility Ratio required for signal (0.5 recommended).
- Volume_Filter - Enable / Disable Volume filter.