Imbalance SM
- Indicateurs
- Mikhail Nazarenko
- Version: 1.3
- Mise à jour: 31 octobre 2024
- Activations: 8
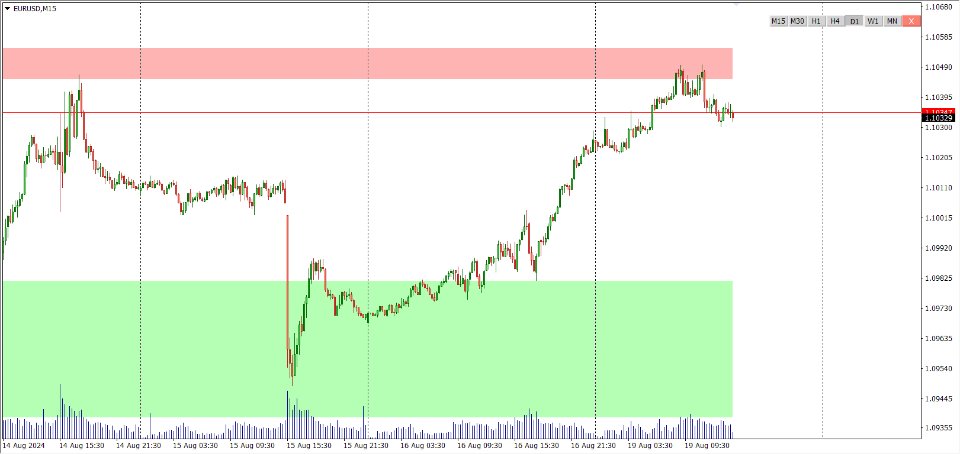
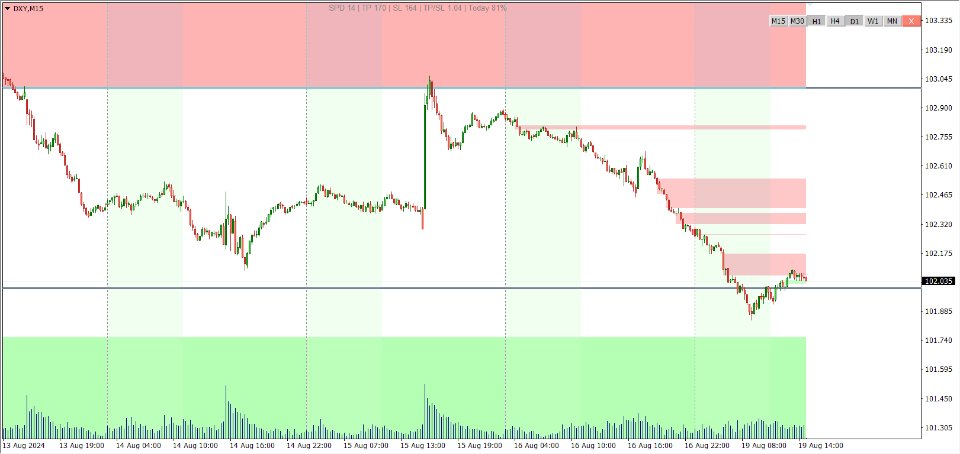
Imbalance is one of the important zones on the chart, to which the price will always strive to cover it. It is from the imbalance zone that the market most often makes significant reversals, rollbacks and gives entry points that you can successfully trade.
In the Smart Money concept, the imbalance zone is used to find an entry point, as well as a place for take profit at the level of imbalance overlap by the price. Until the imbalance is overlapped, it is the closest target for the price.
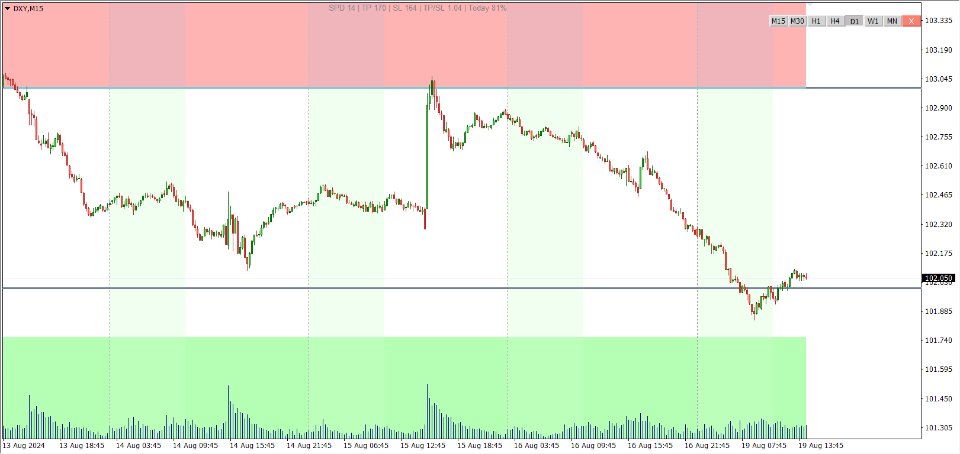
However, there is a problem, imbalances of higher timeframes are not obvious on lower timeframes.
To apply the imbalance of a higher time frame to the chart, you need to switch to a higher time frame and make a markup, and then return to a lower time frame, which is long and inconvenient.
The Imbalance SM indicator is a great tool for successful trading in the Smart Money concept. Simply by pressing or pressing the corresponding button of the Imbalance SM indicator you overlay the imbalance of the higher timeframe on the current chart.
Imbalance SM will not miss any uncovered imbalance. It will save time on searching for entry points, will show the places of taking profit. The quality of the Imbalance SM indicator can be seen in detail in the video or download the demo and check it in the MT4 strategy tester.
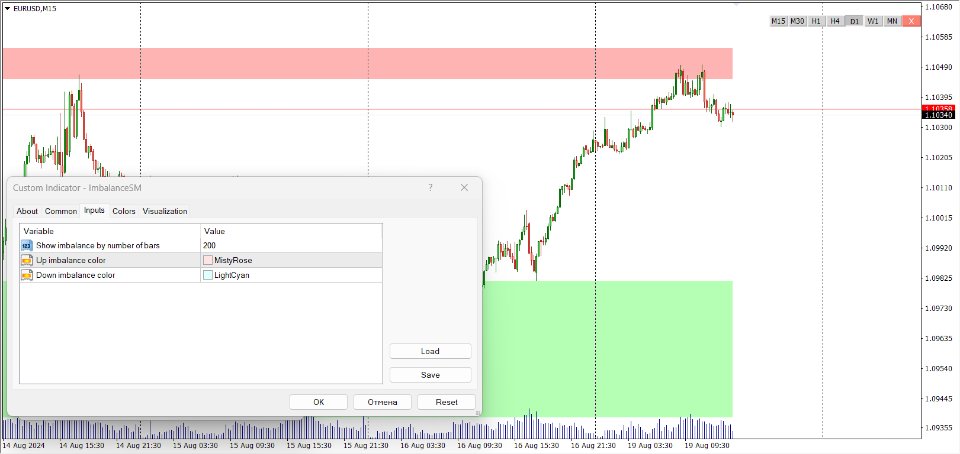
Imbalance SM indicator settings
- Show imbalance by number of bars - the number of bars of the current chart to show the imbalance, if 0 - the number of candles visible on the chart
- Up imbalance color - color of imbalance zones for sale
- Down imbalance color - color of imbalance zones for purchase
If you find an error or suggest any improvements, I would appreciate your feedback.
Write to the author personally.
Show all products by this author
