• Aperçu
  • Avis
  • Commentaires

VolaMetrics VSA

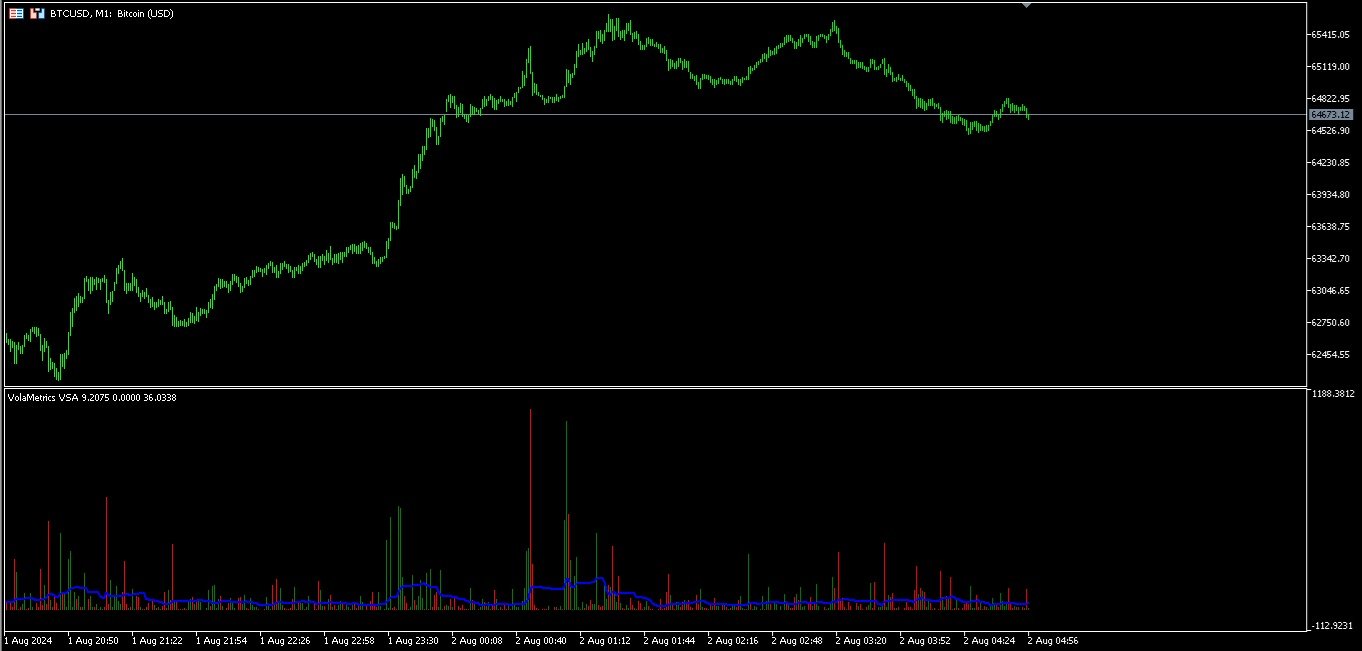
VolaMetrics VSA est un indicateur technique avancé qui combine la méthodologie Volume Spread Analysis (VSA) avec une analyse détaillée du volume des transactions. Cet indicateur a été développé pour identifier et suivre les mouvements de prix significatifs sur le marché en utilisant l'interaction entre le volume et la variation des prix.

Fondements de la Volume Spread Analysis (VSA)

La VSA est une méthodologie qui analyse la relation entre le volume des transactions, la variation des prix (spread) et le cours de clôture sur une période donnée. Le principe de base de la VSA est que les mouvements de prix sont le résultat des activités des opérateurs les mieux informés (smart money), qui laissent des traces dans les schémas de volume et de spread. En étudiant ces schémas, il est possible d’identifier des signes d'accumulation ou de distribution, qui précèdent souvent des mouvements de prix importants.

Comment fonctionne VolaMetrics VSA

VolaMetrics VSA automatise l'analyse VSA traditionnelle, offrant aux traders un outil puissant pour détecter les signaux de renversement ou de continuation de tendance. L'indicateur analyse simultanément le volume des transactions et la variation des prix sur plusieurs périodes, à la recherche de schémas indiquant la présence d'une activité institutionnelle significative.

  • Analyse du volume : VolaMetrics VSA surveille le volume des transactions pour identifier des augmentations ou des baisses anormales, qui peuvent signaler l'entrée ou la sortie de grands acteurs du marché.

  • Spread des prix : Le spread des prix est analysé en conjonction avec le volume pour déterminer la force ou la faiblesse d'un mouvement. Par exemple, une augmentation du volume accompagnée d'un spread étroit peut indiquer une tendance à l'épuisement.

  • Contexte du marché : L'indicateur prend en compte le contexte du marché, comme les niveaux de support et de résistance, pour ajuster l'interprétation des signaux VSA, augmentant ainsi la précision des prévisions.

Efficacité de VolaMetrics VSA dans le suivi des mouvements de prix

VolaMetrics VSA se distingue par sa capacité à anticiper les mouvements du marché basés sur les signaux VSA, qui précèdent souvent les changements de tendance. En combinant ces signaux avec une analyse robuste du volume, VolaMetrics VSA peut identifier les opportunités d'entrée et de sortie avec une plus grande précision.

Applications pratiques :

  • Détection d'accumulation/distribution : Identifie les phases où les grands acteurs accumulent ou distribuent des actifs, ce qui précède souvent des mouvements importants.

  • Confirmation des tendances : Valide la force d'une tendance existante, aidant les traders à décider s'ils doivent maintenir ou ajuster leurs positions.

  • Signaux de renversement : Fournit des alertes précoces sur les renversements potentiels, permettant aux traders de se positionner de manière adéquate.

Conclusion

VolaMetrics VSA est un outil technique puissant et polyvalent, essentiel pour les traders qui souhaitent approfondir leur analyse de marché. Son approche basée sur la VSA et le volume permet une lecture plus précise des mouvements de prix, offrant un avantage concurrentiel dans l'identification des opportunités de trading.


Produits recommandés
UPD1 Profile Levels MT5
Vitaliy Kuznetsov
5 (3)
L'indicateur trouve les niveaux de volume de prix maximum et minimum (profil de marché) sur l'histogramme de travail pour le nombre de barres spécifié.   Profil composite. La hauteur de l'histogramme est entièrement automatique et s'adapte à n'importe quel outil et période. L'algorithme de l'auteur est utilisé et ne répète pas les analogues connus. La hauteur des deux histogrammes est approximativement égale à la hauteur moyenne de la bougie. Smart alert vous permet de vous informer sur le prix
WAPV Weis Wave Chart Forex
Eduardo Da Costa Custodio Santos
Le Weis Wave Chart Forex pour MT5 est un indicateur de prix et de volume. La lecture du prix et du volume a été largement diffusée par Richard Demille Wyckoff sur la base des trois lois qu'il a créées : l'offre et la demande, la cause et l'effet et l'effort contre le résultat. En 1900 R.Wyckoff utilisait déjà le wave chart dans ses analyses. De nombreuses années plus tard, vers 1990, David Weis a automatisé le diagramme d'onde de R. Wyckoff et aujourd'hui nous vous apportons l'évolution du diagr
The VWAP indicator is our version of the popular Volume-Weighted Average Price indicator. The VWAP is the ratio between the value traded (price multiplied by the number of volume traded) and the total volume traded over a specific time period. As a result, it measures the average price of the instrument much better than the simple moving average. Although there are many ways to use the VWAP, most investors use it to calculate the daily average.  The indicator works in five modes: Moving  - In
VolumeDeltaBars
Stanislav Korotky
This indicator is a conventional analytical tool for tick volumes changes. It calculates tick volumes for buys and sells separately, and their delta on every bar, and displays volumes by price clusters (cells) within a specified bar (usually the latest one). The algorithm used internally is the same as in the indicator VolumeDeltaMT5 , but results are shown as cumulative volume delta bars (candlesticks). Analogous indicator for MetaTrader 4 exists - CumulativeDeltaBars . This is a limited substi
The Accumulation / Distribution is an indicator which was essentially designed to measure underlying supply and demand. It accomplishes this by trying to determine whether traders are actually accumulating (buying) or distributing (selling). This indicator should be more accurate than other default MT5 AD indicator for measuring buy/sell pressure by volume, identifying trend change through divergence and calculating Accumulation/Distribution (A/D) level. Application: - Buy/sell pressure: above
Wapv Price and volume
Eduardo Da Costa Custodio Santos
L'indicateur de prix et de volume WAPV pour MT5 fait partie de l'ensemble d'outils (Wyckoff Academy Wave Market) et (Wyckoff Academy Price and Volume). L'indicateur de prix et de volume WAPV pour MT5 a été créé pour faciliter la visualisation intuitive du mouvement du volume sur le graphique. Avec lui, vous pouvez observer les moments de pic de volume et les moments où le marché n'a aucun intérêt professionnel Identifiez les moments où le marché évolue par inertie et non par mouvement de "smart
Do you use volume in your reading of the market? Certainly many traders use it, and do not imagine operating without it. The Color Histogram Volume Set indicator allows the user to choose the value that he considers interesting to monitor. When you pass this you will have visual confirmation and if you want you will also have the audible alert that is given by the indicator. Of course, there are other ways to try to find a high volume, such as assessing whether the volume
Mean Reversion Supply Demand Indicator Mean Reversion Supply Demand is the indicator to detect the important supply demand zone in your chart. The concept of supply demand trading relies on the quantity mismatching between buying and selling volumes in the financial market. Typically, supply demand zone serves to predict the turning point. The wave pattern, for any supply demand zone to work as an successful trade, looks like the price must touch the base zone, move away and then return to zone
No Demand No Supply MT5
Trade The Volume Waves Single Member P.C.
No Demand No Supply   This indicator identifies   No Demand –No Supply candles to your chart and plots volume bars colored according to the signal. It can be applied to all timeframes or to a specific one only. It can also be used as regular volume indicator  with exceptional future of WEIGHTED VOLUME. Furthermore is has an alert notification, sound and email when a signals occurs. The indicator does not repaint but the alert will come on two candles back due to the definition of No Demand No Su
Was: $249  Now: $99   Market Profile defines a number of day types that can help the trader to determine market behaviour. A key feature is the Value Area, representing the range of price action where 70% of trading took place. Understanding the Value Area can give traders valuable insight into market direction and establish the higher odds trade. It is an excellent addition to any system you may be using. Inspired by Jim Dalton’s book “Mind Over Markets”, this indicator is designed to suit the
The balance of supply and demand is a simple and effective market analysis method. The supply and demand diagram can show you in advance, even before the trend reversal, where the supply ends and the demand is already emerging, where the demand ends and the supply is emerging, while substantially increasing the probability of making a deal in the right direction and with a high profit factor. Indicator signals The indicator uses the price/volume values to generate signals: ED – excess demand.
The MultiTimeframe Volume Zones Indicator is a powerful tool designed to provide traders with comprehensive insights into market dynamics. It combines several essential features, including volume analysis, Dow Zones, buy and sell arrows, candle timer, and market movement across different time frames. This all-in-one indicator equips traders with valuable information to make informed trading decisions. Key Features: Volume Analysis: Gain a deep understanding of market sentiment and strength by an
Description The indicator uses market profile theory to show the most relevant trading zones, on a daily basis. The zones to be shown are LVN (low volume nodes) and POC (point of control). An LVN zone is one which represents price areas with the least time or volume throughout the day. Typically, these areas indicate a supply or demand initiative, and in the future, they can turn into important breakout or retracement zones. A POC zone is one which represents price areas with the most time or vo
The Volume+ and VSA Signals indicator for MT5 is based on the Volume Spread Analysis (VSA) methodology to provide the signals. The signals are displayed at closing of bars on the main window or subwindow in the form of symbols. The symbols are not repainting.  The indicator produces a signal on an individual bar and this signal is not buy or sell signal. When a minor trend goes in the opposite direction of a major trend, there are sequences of major trend-following signals that give a higher pro
Volumes Direction MT5
William Oswaldo Mayorga Urduy
VOLUMES DIRECTION MT5 Normalement, l'indicateur de volume a un changement de couleur par défaut lorsque le volume actuel est plus élevé que le précédent, c'est important mais pas très utile. Pour cette raison, cet indicateur a été créé pour qu'en plus du volume normal, lorsque la bougie est haussière ou baissière, il les peint d'une couleur différente, par défaut bleu pour haussier et rouge pour baissier, mais ces couleurs peuvent être personnalisées selon le Le goût du commerçant. N'
Waves PRO
Flavio Javier Jarabeck
For those who appreciate Richard Wyckoff approach for reading the markets, we at Minions Labs designed a tool derived - yes, derived, we put our own vision and sauce into this indicator - which we called Waves PRO . This indicator provides a ZigZag controlled by the market volatility (ATR) to build its legs, AND on each ZigZag leg, we present the vital data statistics about it. Simple and objective. This indicator is also derived from the great book called " The Secret Science of Price and Volum
KT Volume Profile MT5
KEENBASE SOFTWARE SOLUTIONS
5 (1)
KT Volume Profile shows the volume accumulation data as a histogram on the y-axis providing an ability to find out the trading activity over specified time periods and price levels. Point of Control (POC) in a Volume Profile POC represents a price level that coincides with the highest traded volume within the whole volume profile histogram. POC is mostly used as a support/resistance or as an essential price level where market retest before going in a specific direction. Features Very easy
This indicator provides an original mix of WPR, VSA, and volume delta. It shows ratio of buy/sell volumes scaled on 100% range based on total volume change for a selected period. The convetional VSA (Volume Spread Analysis) studies interconnections of price action and volume change in absolute values, whereas WPR (Williams Percent Range) offers a convenient approach of price moves normalization into the fixed percentage metric: 0 - 100%. Hence overbough and oversold states are easily spotted. N
The   Supply and Demand Zones indicator   is one of the best tools we have ever made. This great tool automatically draws supply and demand zones, the best places for opening and closing positions. It has many advanced features such as multi timeframe zones support, displaying the width of zones, alert notifications for retouched zones, and much more. Because of market fractality, this indicator can be used for any kind of trading. Whether you are a positional, swing, or intraday trader does no
Mr Big MT5
Pavel Verveyko
The indicator shows and highlights the chart candles, which are formed as a result of large players entering the market in large volumes. Such candles can also be formed after achieving a certainty on the market, when most of the participants hold positions in the same direction. The movement is likely to continue in that direction after such candles. The indicator highlights the significant candles from the existing ones on the chart; The indicator allows identifying the trends based on candles
Normalized OBV
Jose Miguel Soriano
When looking at the information of On Balance Volume indicator, a question arises: is it a strong or weak movement? Should it be compared with previous days? These data should be normalized to always have a reference. This indicator presents the followings parameters: Normalization period (Max-Mins absolute) Smoothing period (-1 off) Tick/Real Volume Maximum number of bars to calculate (-1 off) Upper value normalization Lower value normalization Calculation: normOBV = (value - absMin) * (relMa
Market Marker MT5
Evgeny Shevtsov
3.8 (5)
The indicator displays peak levels of activity formed by the maximum volume, tracks the correlation of the candles on all timeframes (from the highest to the lowest one). Each volume level is a kind of key trading activity. The most important cluster is inside a month, week, day, hour, etc. Indicator operation features A volume level receives Demand status if the nearest volume level located to the left and above has been broken upwards. A volume level receives Supply status if the nearest vol
True Weis Wave
Atila Goncalves Firmino
A version based on David Waves' description in his book 'Trade About to Happen' of his adaptation of the Wyckoff wave chart. The indicator directionally accumulates volume, adding to each brick or candle close, with color indication for up and down. it can be used it with tick or real volume, it also changes color when the accumulated value of the previous wave is exceeded, being the trade signal. Yellow color is used for doji candlestick, it will continue with accumulation without zero the sum
One of the Best Volume Indicators, with the addition of a Moving Average for weighting volume over time average. If the "Current Candle" Volume is X% greater than the Moving Average value, we will have a sign of increasing volume. It can be a sign of Beginning, Continuity, Reversal or Exhaustion of the Movement. Fully configurable and all options open, you can color and set ALL values as you see fit. The 'Volume Break' shows volume bars in the same color as the candlestick, in addition
Precision trading: leverage wolfe waves for accurate signals Special Offer: Purchase now to receive free bonuses worth $129! (Read more for details) Wolfe Waves are naturally occurring trading patterns present in all financial markets and represent a fight towards an equilibrium price. These patterns can develop over short and long-term time frames and are one of the most reliable predictive reversal patterns in existence, normally preceding strong and long price movements. [ Installation Guide
Weis Wave Result MT5
Sant Clear Ali Costa
Features 3 types of waves: bullish, bearish and unknown. The unknown tower comes when prices move in opposite the direction of the current tower. Label that shows the percentage remaining for the next tower. Allows you set the type of volume that will be accumulated in the towers, either real or tick volumes. Thus, the indicator works in any market, for example: stocks, futures, forex, commodities, etc. Allows you to set the required score for the tower exchange. Allows you to set the font size
DBS Delta
Dmitriy Burlachenko
The delta indicator is used to display the difference between the volume that passed on the exchange at the Ask price and above (market buys) and the volume that passed at the Bid price and below (market sales). This indicator shows the delta of each candle on the timeframe of your choice. The data is displayed as a colored histogram in a separate indicator window. The indicator is calculated from the tick history, therefore, to speed up the calculations and reduce the load on the system, the n
Forex Volume MT5
KEENBASE SOFTWARE SOLUTIONS
KT Forex Volume shows the buying and selling volume of a currency pair in the form of a colored histogram. The volume is made of buying and selling transactions in an asset. In FX market: If the buying volume gets bigger than the selling volume, the price of a currency pair would go up. If the selling volume gets bigger than the buying volume, the price of a currency pair would go down. Features Avoid the bad trades by confirming them using the tick volume data. It helps you to stay on the si
A "Volume Profile" is an advanced charting indicator that displays total volume traded at every price level over a user specified time period. The main components of the volume profile are POC ( Point Of Control - the price level, at which the maximum number of contracts were executed during a selected period), VAH ( Value Area High - the highest price in the Value Area) and VAL ( Value Area Low - the lowest price in the Value Area). When we settled on the original indicator, we spent a lot o
1. What is this         Rising volatility and falling volatility are not the same, whether it is academic research or actual testing has shown this point.         The original ATR indicator is calculated by putting up and down fluctuations together. This indicator is to calculate separately the upward volatility and the downward volatility, which can better help you study the market. 2. Indicator description          There are two modes for the calculation of this indicator, as shown in the f
Les acheteurs de ce produit ont également acheté
Atomic Analyst MT5
Issam Kassas
4.79 (19)
Tout d'abord, il convient de souligner que cet indicateur de trading n'est ni repainting, ni redrawing et ne présente aucun délai, ce qui le rend idéal à la fois pour le trading manuel et automatisé. Manuel de l'utilisateur : réglages, entrées et stratégie. L'Analyste Atomique est un indicateur d'action sur les prix PA qui utilise la force et le momentum du prix pour trouver un meilleur avantage sur le marché. Équipé de filtres avancés qui aident à éliminer les bruits et les faux signaux, et à
Tout d'abord, il convient de souligner que ce système de trading est un indicateur non repeint, non redessiné et non retardé, ce qui le rend idéal pour le trading manuel et automatisé. Cours en ligne, manuel et téléchargement de préréglages. Le "Système de Trading Smart Trend MT5" est une solution de trading complète conçue pour les traders débutants et expérimentés. Il combine plus de 10 indicateurs premium et propose plus de 7 stratégies de trading robustes, ce qui en fait un choix polyvalent
Quantum Trend Sniper
Bogdan Ion Puscasu
4.92 (48)
Présentation       Quantum Trend Sniper Indicator   , l'indicateur révolutionnaire MQL5 qui transforme la façon dont vous identifiez et négociez les inversions de tendance ! Développé par une équipe de traders expérimentés avec une expérience commerciale de plus de 13 ans,       Indicateur Quantum Trend Sniper       est conçu pour propulser votre parcours de trading vers de nouveaux sommets grâce à sa manière innovante d'identifier les inversions de tendance avec une précision extrêmement élevée
TPSproTREND PrO MT5
Roman Podpora
4.89 (9)
TPSpro TREND PRO  - is a trend indicator that automatically analyzes the market and provides information about the trend and each of its changes, as well as giving signals for entering trades without redrawing! The indicator uses each candle, analyzing them separately. referring to different impulses - up or down impulse. Exact entry points into transactions for currencies, crypto, metals, stocks, indices!  Version MT4               DETAILED DESCRIPTION               R ecommended to use with an
TPSpro RFI Levels MT5
Roman Podpora
4.67 (9)
Reversal First Impulse levels (RFI)      INSTRUCTIONS        RUS       -       ENG              R ecommended to use with an indicator   -   TPSpro  TREND PRO -  Version MT4                 A key element in trading is zones or levels from which decisions to buy or sell a trading instrument are made. Despite attempts by major players to conceal their presence in the market, they inevitably leave traces. Our task was to learn how to identify these traces and interpret them correctly. Main functi
FX Power MT5 NG
Daniel Stein
5 (6)
Obtenez votre mise à jour quotidienne du marché avec des détails et des captures d'écran via notre Morning Briefing ici sur mql5 et sur Telegram ! FX Power MT5 NG est la nouvelle génération de notre très populaire indicateur de force des devises, FX Power. Et qu'est-ce que ce compteur de force de nouvelle génération offre ? Tout ce que vous avez aimé de l'original FX Power PLUS Analyse de la force de l'OR/XAU Des résultats de calcul encore plus précis Périodes d'analyse configurables individuel
Automated Trendlines MT5
Georgios Kalomoiropoulos
Les lignes de tendance sont l'outil d'analyse technique le plus essentiel dans le trading forex. Malheureusement, la plupart des commerçants ne les dessinent pas correctement. L'indicateur Automated Trendlines est un outil professionnel pour les traders sérieux qui vous aide à visualiser le mouvement de tendance des marchés. Il existe deux types de lignes de tendance, les lignes de tendance haussières et les lignes de tendance baissières. Dans la tendance haussière, la ligne de tendance
Gartley Hunter Multi
Siarhei Vashchylka
5 (8)
Gartley Hunter Multi - An indicator for searching for harmonic patterns simultaneously on dozens of trading instruments and on all possible timeframes. Manual (Be sure to read before purchasing) | Version for MT4 Advantages 1. Patterns: Gartley, Butterfly, Shark, Crab. Bat, Alternate Bat, Deep Crab, Cypher 2. Simultaneous search for patterns on dozens of trading instruments and on all possible timeframes 3. Search for patterns of all possible sizes. From the smallest to the largest 4. A
Maintenant 147 $ (augmentant à 499 $ après quelques mises à jour) - Comptes illimités (PCS ou Mac) Manuel d'utilisation RelicusRoad + Vidéos de formation + Accès au groupe Discord privé + Statut VIP UNE NOUVELLE FAÇON DE REGARDER LE MARCHÉ RelicusRoad est l'indicateur de trading le plus puissant au monde pour le forex, les contrats à terme, les crypto-monnaies, les actions et les indices, offrant aux traders toutes les informations et tous les outils dont ils ont besoin pour rester renta
Advanced Supply Demand MT5
Bernhard Schweigert
4.53 (15)
La meilleure solution pour tout commerçant débutant ou expert ! Cet indicateur est un outil de trading unique, de haute qualité et abordable car nous avons intégré un certain nombre de fonctionnalités propriétaires et une nouvelle formule. Avec cette mise à jour, vous pourrez afficher des zones à double horaire. Vous pourrez non seulement afficher un TF plus élevé, mais afficher les deux, le graphique TF, PLUS le TF supérieur : AFFICHAGE DES ZONES NICHÉES. Tous les traders Supply Demand vont ado
XQ Indicator MetaTrader 5
Marzena Maria Szmit
5 (1)
Step into the realm of Forex trading with confidence and precision using XQ, a cutting-edge Forex indicator designed to elevate your trading game to unprecedented heights. Whether you're a seasoned trader or just stepping into the world of currency exchange, XQ Forex Indicator empowers you with the insights and signals needed to make informed trading decisions. The signal conditions are a combination of three indicators, and XQ Forex Indicator only display  medium and long-term trends . The ind
Blahtech Supply Demand MT5
Blahtech Limited
4.54 (13)
Was: $299  Now: $99   Supply Demand uses previous price action to identify potential imbalances between buyers and sellers. The key is to identify the better odds zones, not just the untouched ones. Blahtech Supply Demand indicator delivers functionality previously unavailable on any trading platform. This 4-in-1 indicator not only highlights the higher probability zones using a multi-criteria strength engine, but also combines it with multi-timeframe trend analysis, previously confirmed swings
Introduction to X3 Chart Pattern Scanner X3 Cherart Pattern Scanner is the non-repainting and non-lagging indicator detecting X3 chart patterns including Harmonic pattern, Elliott Wave pattern, X3 patterns, and Japanese Candlestick patterns. Historical patterns match with signal patterns. Hence, you can readily develop the solid trading strategy in your chart. More importantly, this superb pattern scanner can detect the optimal pattern of its kind. In addition, you can switch on and off individu
Ce tableau de bord affiche les derniers   modèles harmoniques   disponibles pour les symboles sélectionnés, ce qui vous permettra de gagner du temps et d'être plus efficace /   version MT4 . Indicateur gratuit:   Basic Harmonic Pattern Colonnes de l'indicateur Symbol :   les symboles sélectionnés apparaissent Trend   :   haussière ou baissière Pattern :   type de motif (gartley, papillon, chauve-souris, crabe, requin, cypher ou ABCD) Entry:   prix d'entrée SL:   prix du stop loss TP1:   1
Order Block Hunter MT5
Noha Mohamed Fathy Younes Badr
5 (1)
Order block hunter indicator is the best indicator for  hunt the order blocks that area where there has been a large concentration of limit orders waiting to be executed Order blocks are identified on a chart by observing previous price action and looking for areas where the price experienced significant movement or sudden changes in direction .This indicator does that for you by using very complicated codes and helps you to take the best areas To buy and sell because it make marks at the best a
AT Forex Indicator MT5
Marzena Maria Szmit
5 (4)
The AT Forex Indicator MT5 is a sophisticated trading tool designed to provide traders with a comprehensive analysis of multiple currency pairs. This powerful indicator simplifies the complex nature of the forex market, making it accessible for both novice and experienced traders. AT Forex Indicator uses advanced algorithms to detect trends, patterns and is an essential tool for traders aiming to enhance their forex trading performance. With its robust features, ease of use, and reliable signal
Top indicator for MT5   providing accurate signals to enter a trade without repainting! It can be applied to any financial assets:   forex, cryptocurrencies, metals, stocks, indices .  Watch  the video  (6:22) with an example of processing only one signal that paid off the indicator! MT4 version is here It will provide pretty accurate trading signals and tell you when it's best to open a trade and close it. Most traders improve their trading results during the first trading week with the help of
FX Volume MT5
Daniel Stein
4.94 (17)
Obtenez votre mise à jour quotidienne du marché avec des détails et des captures d'écran via notre Morning Briefing ici sur mql5 et sur Telegram ! FX Volume est le PREMIER et SEUL indicateur de volume qui fournit un VRAI aperçu du sentiment du marché du point de vue d'un courtier. Il fournit des informations impressionnantes sur la façon dont les acteurs institutionnels du marché, comme les courtiers, sont positionnés sur le marché des changes, bien plus rapidement que les rapports COT. Voir c
Présentation       Quantum Breakout PRO   , l'indicateur révolutionnaire MQL5 qui transforme la façon dont vous négociez les zones d'évasion ! Développé par une équipe de traders expérimentés avec une expérience commerciale de plus de 13 ans,       Évasion quantique PRO       est conçu pour propulser votre parcours commercial vers de nouveaux sommets grâce à sa stratégie de zone de discussion innovante et dynamique. Quantum Breakout Indicator vous donnera des flèches de signalisation sur le
Trend Forecaster
Alexey Minkov
5 (6)
The Trend Forecaster indicator utilizes a unique proprietary algorithm to determine entry points for a breakout trading strategy. The indicator identifies price clusters, analyzes price movement near levels, and provides a signal when the price breaks through a level. The Trend Forecaster indicator is suitable for all financial assets, including currencies (Forex), metals, stocks, indices, and cryptocurrencies. You can also adjust the indicator to work on any time frames, although it is recommen
Elliott Wave Trend was designed for the scientific wave counting. This tool focuses to get rid of the vagueness of the classic Elliott Wave Counting using the guideline from the template and pattern approach. In doing so, firstly Elliott Wave Trend offers the template for your wave counting. Secondly, it offers Wave Structural Score to assist to identify accurate wave formation. It offers both impulse wave Structural Score and corrective wave Structure Score. Structural Score is the rating to sh
IVISTscalp5
Vadym Zhukovskyi
5 (5)
Nous vous présentons l'indicateur iVISTscalp5, qui est non seulement unique, mais également efficace dans les opérations de trading. Cet indicateur est basé sur des données temporelles et est le résultat de nombreuses années d'expérience et d'analyse approfondie des marchés financiers. L'indicateur iVISTscalp5 est un excellent outil pour le trading manuel. La commodité, la simplicité et la visualisation - toute la complexité est cachée à l'intérieur. Nous avons simplifié au maximum les paramètre
If you want to find good trading opportunities, then you must trade near the Trend Line. This allows you to have a tighter         stop loss   on your trades — which improves your       risk to reward . But that’s not all… Because if you combine Trend Line with Support and Resistance, that’s where you find the best trading opportunities. Now you might wonder: “So when do I enter a trade?” Well, you can use reversal     candlestick patterns   (like the   Hammer, Bullish Engulfing, etc.) as your e
Market Overview MT5
Mehran Sepah Mansoor
Optimisez vos décisions de trading avec notre indicateur de force et de sentiment du marché et ne tradez plus à contre-courant! Méticuleusement conçu pour les traders sérieux qui apprécient les informations précises et opportunes, notre indicateur fournit une vue d'ensemble des 28 paires principales d'une manière très simple. Cet outil est capable de classer les paires de devises en fonction de leur popularité, de la force de la tendance haussière ou baissière et du pourcentage d'acheteurs et
Trade smarter, not harder: Empower your trading with Harmonacci Patterns Special Offer: Purchase now to receive free bonuses worth $165! (Read more for details) This is arguably the most complete harmonic price formation auto-recognition indicator you can find for the MetaTrader Platform. It detects 19 different patterns, takes fibonacci projections as seriously as you do, displays the Potential Reversal Zone (PRZ) and finds suitable stop-loss and take-profit levels. [ Installation Guide | Up
Royal Scalping Indicator M5
Vahidreza Heidar Gholami
5 (8)
Royal Scalping Indicator is an advanced price adaptive indicator designed to generate high-quality trading signals. Built-in multi-timeframe and multi-currency capabilities make it even more powerful to have configurations based on different symbols and timeframes. This indicator is perfect for scalp trades as well as swing trades. Royal Scalping is not just an indicator, but a trading strategy itself. Features Price Adaptive Trend Detector Algorithm Multi-Timeframe and Multi-Currency Trend Low
Notre tableau de bord innovant " Basic Candlestick Patterns " est spécialement conçu pour identifier automatiquement les modèles de chandeliers rentables sur le graphique. Ce tableau de bord utilise des algorithmes avancés pour analyser les graphiques de prix en temps réel et détecter un large éventail de configurations de chandeliers, des plus classiques aux plus complexes. En outre, il dispose d'une interface facile à utiliser qui vous permet de visualiser les configurations détectées sur dif
Volume by Price MT5
Brian Collard
3.6 (5)
The Volumebyprice.com Indicator for MetaTrader 5 features Volume Profile and Market Profile TPO (Time Price Opportunity). Volume and TPO histogram bar and line charts. Volume Footprint charts. TPO letter and block marker collapsed and split structure charts. Static, dynamic and flexible range segmentation and compositing methods with relative and absolute visualizations. Session hours filtering and segment concatenation with Market Watch and custom user specifications. Graphical layering, posit
L'indicateur indique les points d'entrée et de sortie les plus appropriés. Il affiche également des données statistiques sur tous les signaux pour une meilleure analyse du trading. Grâce à cet indicateur, vous pourrez mieux comprendre le marché. Dès que la puissance de la tendance commence à s'affaiblir (ce qui sera indiqué sur le panneau), la ligne de tendance gravitera vers la position horizontale - c'est le signal pour sortir du trade. Vous pouvez également sortir lorsque le niveau de pro
Quantum Heiken Ashi PRO MT5
Bogdan Ion Puscasu
4.5 (8)
Présentation du   Quantum Heiken Ashi PRO Conçues pour fournir des informations claires sur les tendances du marché, les bougies Heiken Ashi sont réputées pour leur capacité à filtrer le bruit et à éliminer les faux signaux. Dites adieu aux fluctuations de prix déroutantes et bonjour à une représentation graphique plus fluide et plus fiable. Ce qui rend le Quantum Heiken Ashi PRO vraiment unique, c'est sa formule innovante, qui transforme les données traditionnelles des chandeliers en barres col
Plus de l'auteur
AI Channel
Thalles Nascimento De Carvalho
4 (4)
Welcome to the presentation of the AI Channel indicator, a powerful tool that uses artificial intelligence for price channel analysis in the financial market. In this session, we will explore how this revolutionary indicator can assist investors and traders in making more informed and strategic decisions. Let's get started! I. What is the AI Channel indicator? AI Channel is an indicator developed based on advanced artificial intelligence algorithms. It utilizes historical price data of financial
FREE
Master OBV FX
Thalles Nascimento De Carvalho
5 (1)
The MasterOBV indicator is a powerful technical analysis tool that utilizes volume, positive correlation, and a Moving Average (MA) to enhance trend identification in financial markets. By incorporating assets with positive correlation through the indicator menu, MasterOBV provides a refined approach to assessing the strength and direction of trends. The inclusion of the Moving Average adds additional smoothing to price movements, aiding in a more accurate tracking of the underlying trend over
FREE
Long Short
Thalles Nascimento De Carvalho
4.67 (3)
Long & Short Indicator, tracks the movements of assets that have positive or negative correlation allowing to explore displacement in advance. - High Hit Rate With Real Time Information. - More Safe Entries in Operations. - Facilitates Short and Long Term Reading. - Option to trigger alert for the Levels. Information for Ea Buffer Symbol 1ª = 0 ;  Buffer Symbol 2ª = 2 ; * Free version only EURUSD! 
FREE
Swing Point Volume
Thalles Nascimento De Carvalho
Swing Point Volume, the indicator that signals weakness and strength at the tops and bottoms. This indicador can be for used the Wyckoff Method. Information provided; - Swing on customized ticks. - Volume and points in each balance sheet. - Percentage of Displacement. - Sound alert option on top and bottom breaks. - Volume in ticks and Real Volume. - Volume HL (extreme) or (opening and closing) - Customized volume shapes.
Atr Projection
Thalles Nascimento De Carvalho
L'indicateur ATR Projeção se distingue comme un outil robuste dans l'analyse technique, conçu pour fournir des informations précises sur les limites potentielles des mouvements de prix sur les marchés financiers. Son approche flexible permet aux utilisateurs de personnaliser de manière intuitive les métriques d'analyse, en s'adaptant aux besoins spécifiques de chaque actif négocié. Fonctionnement personnalisable : Par défaut, l'ATR Projeção fonctionne en considérant 30 % de la moyenne des
Box Weis Wave
Thalles Nascimento De Carvalho
5 (1)
Si vous êtes un trader actif et que vous recherchez un moyen efficace d'interpréter les mouvements sur les marchés financiers, vous allez adorer découvrir Weis Wave Box. Cet incroyable indicateur a été conçu pour offrir une analyse visuelle claire et précise des vagues de volume, ainsi que la représentation des points de retournement correspondants. Avec ses cinq formes de retournement personnalisables et autres fonctionnalités uniques, Weis Wave Box se distingue comme un outil indispensable pou
Long Short Pro
Thalles Nascimento De Carvalho
Pour utiliser efficacement les indicateurs Long et Short et tirer parti des corrélations entre différents actifs, il est important de suivre quelques étapes fondamentales. Comprendre les bases de l'indicateur : Familiarisez-vous avec les métriques et les calculs sous-jacents de l'indicateur Long et Short. Comprenez comment il corrèle les paires de devises, les indices ou les cryptomonnaies et identifie les corrélations positives ou négatives entre ces actifs. Analyser les corrélations entre les
Reversal Vol Propagation
Thalles Nascimento De Carvalho
Are you tired of missing out on trading opportunities by not being able to identify price reversals in time? Do you want to maximize your profits and make informed trading decisions? Introducing the Reversal Vol Propagation Indicator, the revolutionary tool that uses neural networks and volume data to predict potential price reversals. Based on a powerful combination of advanced algorithms and cutting-edge technology, the Reversal Vol Propagation meticulously analyzes volume patterns and past pr
Didi Index Volume
Thalles Nascimento De Carvalho
Nous vous présentons le Didi Index Volume, un indicateur d'analyse technique développé par le trader brésilien Odir Aguiar, qui se distingue par son approche avancée et puissante dans l'identification des opportunités sur les marchés financiers. Disponible sur différentes plateformes, le Didi Index Volume est devenu un outil essentiel pour les traders à la recherche d'informations précises et précieuses pour leurs stratégies de trading. Cet indicateur combine le célèbre Didi Index, créé par O
Smart Binary Volume
Thalles Nascimento De Carvalho
L'indicateur Smart Binary Volume est un outil polyvalent qui combine l'analyse du volume de trading avec l'apprentissage automatique. Il peut être appliqué sur différents marchés et stratégies, y compris le scalping et d'autres types de transactions à court terme. En utilisant des algorithmes d'apprentissage automatique avancés, l'indicateur identifie des schémas complexes, générant ainsi des signaux d'achat et de vente plus précis. Buffer to Create EA. Buffer Line Gold = 0. Buffer Line Red =
TimeChannel
Thalles Nascimento De Carvalho
The "Timechannel" is a powerful technical analysis tool designed specifically for traders who want to gain deeper and more accurate insights into price movements across multiple timeframes (multi-timeframe). This indicator is an essential addition to the toolbox of any serious trader seeking to make informed and data-driven trading decisions. Key Features: Advanced Multi-Timeframe Analysis : Timechannel allows traders to analyze price movements on different timeframes simultaneously. This is cr
DeltaBook
Thalles Nascimento De Carvalho
L'indicateur Delta Book est un puissant outil d'analyse de marché qui combine l'utilisation du delta de volume avec des informations issues du carnet d'ordres pour détecter le flux des prix sur les marchés financiers tels que les actions, les contrats à terme et les cryptomonnaies. Il est important de noter que le Delta Book nécessite un accès aux données de volume en temps réel et aux informations du carnet d'ordres pour exploiter pleinement son potentiel. La caractéristique principale du Delta
Big Player Range
Thalles Nascimento De Carvalho
5 (2)
Bienvenue sur l'indicateur "BigPlayerRange", un outil d'analyse technique développé pour identifier les zones d'intérêt significatives des institutions financières sur les marchés. Cet indicateur offre une analyse précise des plages de prix où les principaux acteurs du marché démontrent une activité et un intérêt considérables. Principales caractéristiques : 1. Cartographie des zones d'intérêt institutionnel : "BigPlayerRange" met en évidence avec précision les zones du graphique où les in
Master OBV
Thalles Nascimento De Carvalho
The MasterOBV indicator is a powerful technical analysis tool that utilizes volume, positive correlation, and a Moving Average (MA) to enhance trend identification in financial markets. By incorporating assets with positive correlation through the indicator menu, MasterOBV provides a refined approach to assessing the strength and direction of trends. The inclusion of the Moving Average adds additional smoothing to price movements, aiding in a more accurate tracking of the underlying trend over
Smart Delta Volume
Thalles Nascimento De Carvalho
Le Smart Delta Volume utilise des niveaux dynamiques qui s'ajustent automatiquement en fonction de la volatilité du marché. Cette caractéristique garantit une analyse plus précise et adaptable aux changements des conditions du marché en temps réel. Avec sa capacité à s'ajuster dynamiquement, l'indicateur offre une vision plus complète et fiable du flux de volume et de l'action des prix. De plus, le Smart Delta Volume présente un validateur de pullback, qui est déclenché lorsque le prix dépasse
SwingVolumePro
Thalles Nascimento De Carvalho
Vue d'ensemble SwingVolumePro est un indicateur avancé et polyvalent, conçu pour être utilisé sur une large gamme d'actifs financiers et pour supporter différents styles de trading. Basé sur une analyse rigoureuse du volume et du prix, il fournit des signaux clairs et précis permettant aux traders de tous niveaux de prendre des décisions éclairées basées sur des données de haute qualité. Principales caractéristiques Polyvalence: SwingVolumePro peut être appliqué à divers actifs, y compr
Filtrer:
Aucun avis
Répondre à l'avis