• Aperçu
  • Avis
  • Commentaires

Fractal Levels based on Higher Timeframe

Fractal Levels based on Higher Timeframe est un outil puissant conçu pour construire des niveaux de support et de résistance précis basés sur les fractales de l'échelle de temps supérieure, vous fournissant des signaux d'achat et de vente avec des alertes pratiques.

Fonctionnement : L'indicateur analyse les niveaux de fractales sur l'échelle de temps supérieure et les affiche sur votre graphique actuel. Vous pouvez facilement ajuster l'échelle de temps supérieure dans les propriétés de l'indicateur afin d'obtenir une précision et une pertinence maximales pour vos stratégies.

Avantages de l'utilisation des niveaux fractals basés sur l'échelle de temps supérieure :

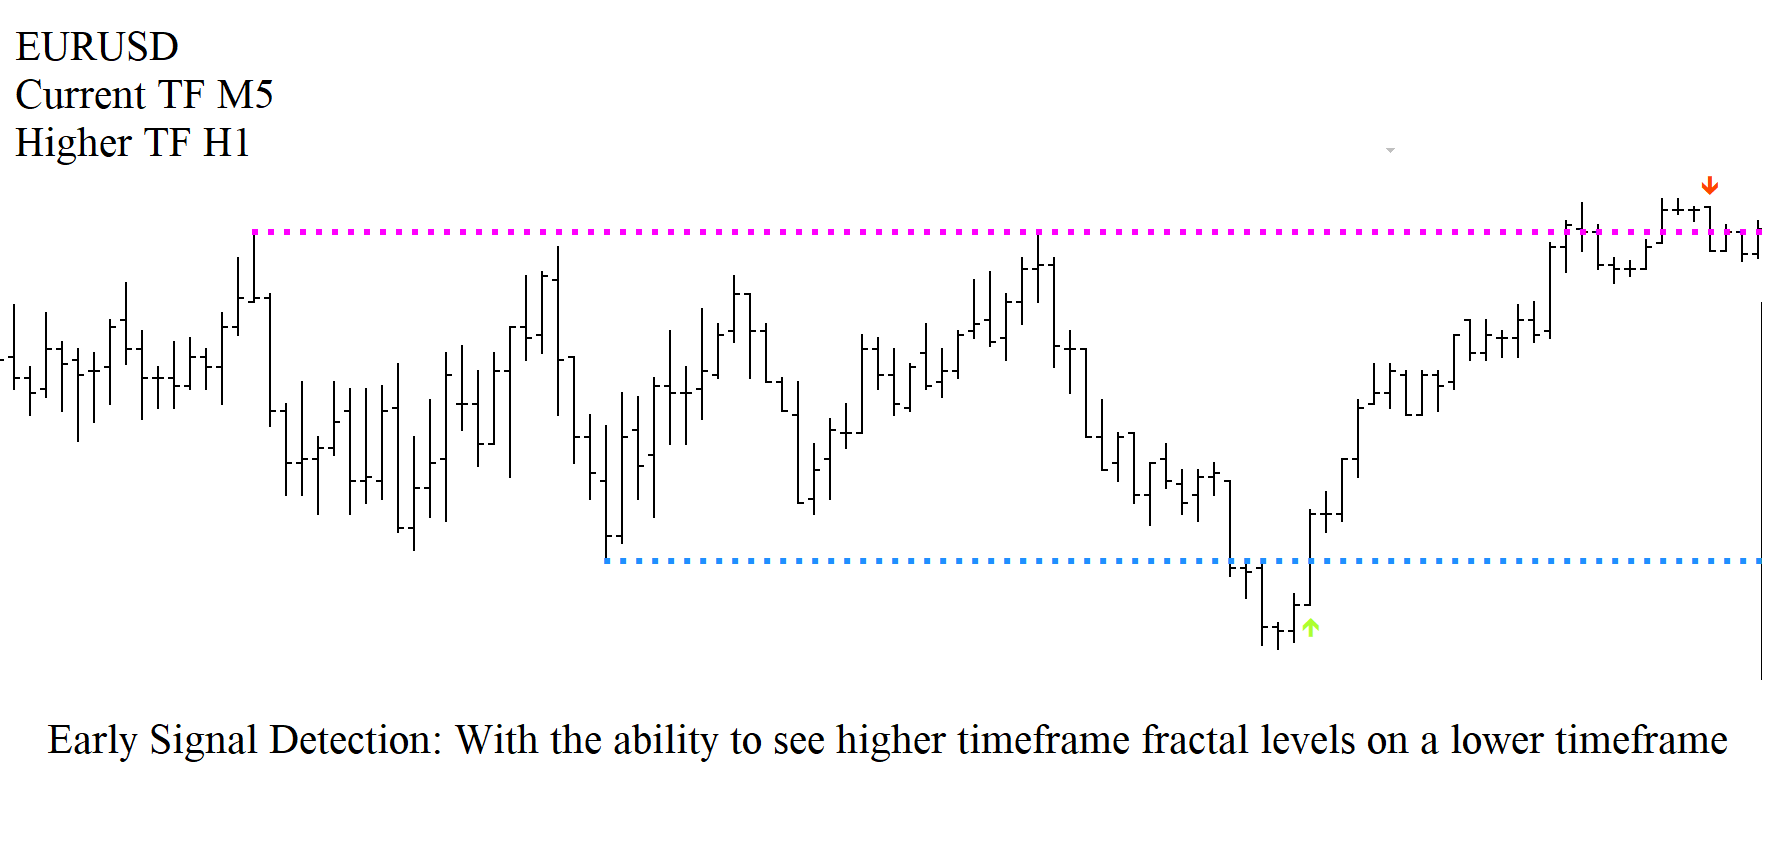
Détection précoce des signaux : grâce à la possibilité de voir les niveaux fractals d'un horizon temporel supérieur sur un horizon temporel inférieur, vous pouvez identifier les signaux d'achat et de vente potentiels dès leur apparition.

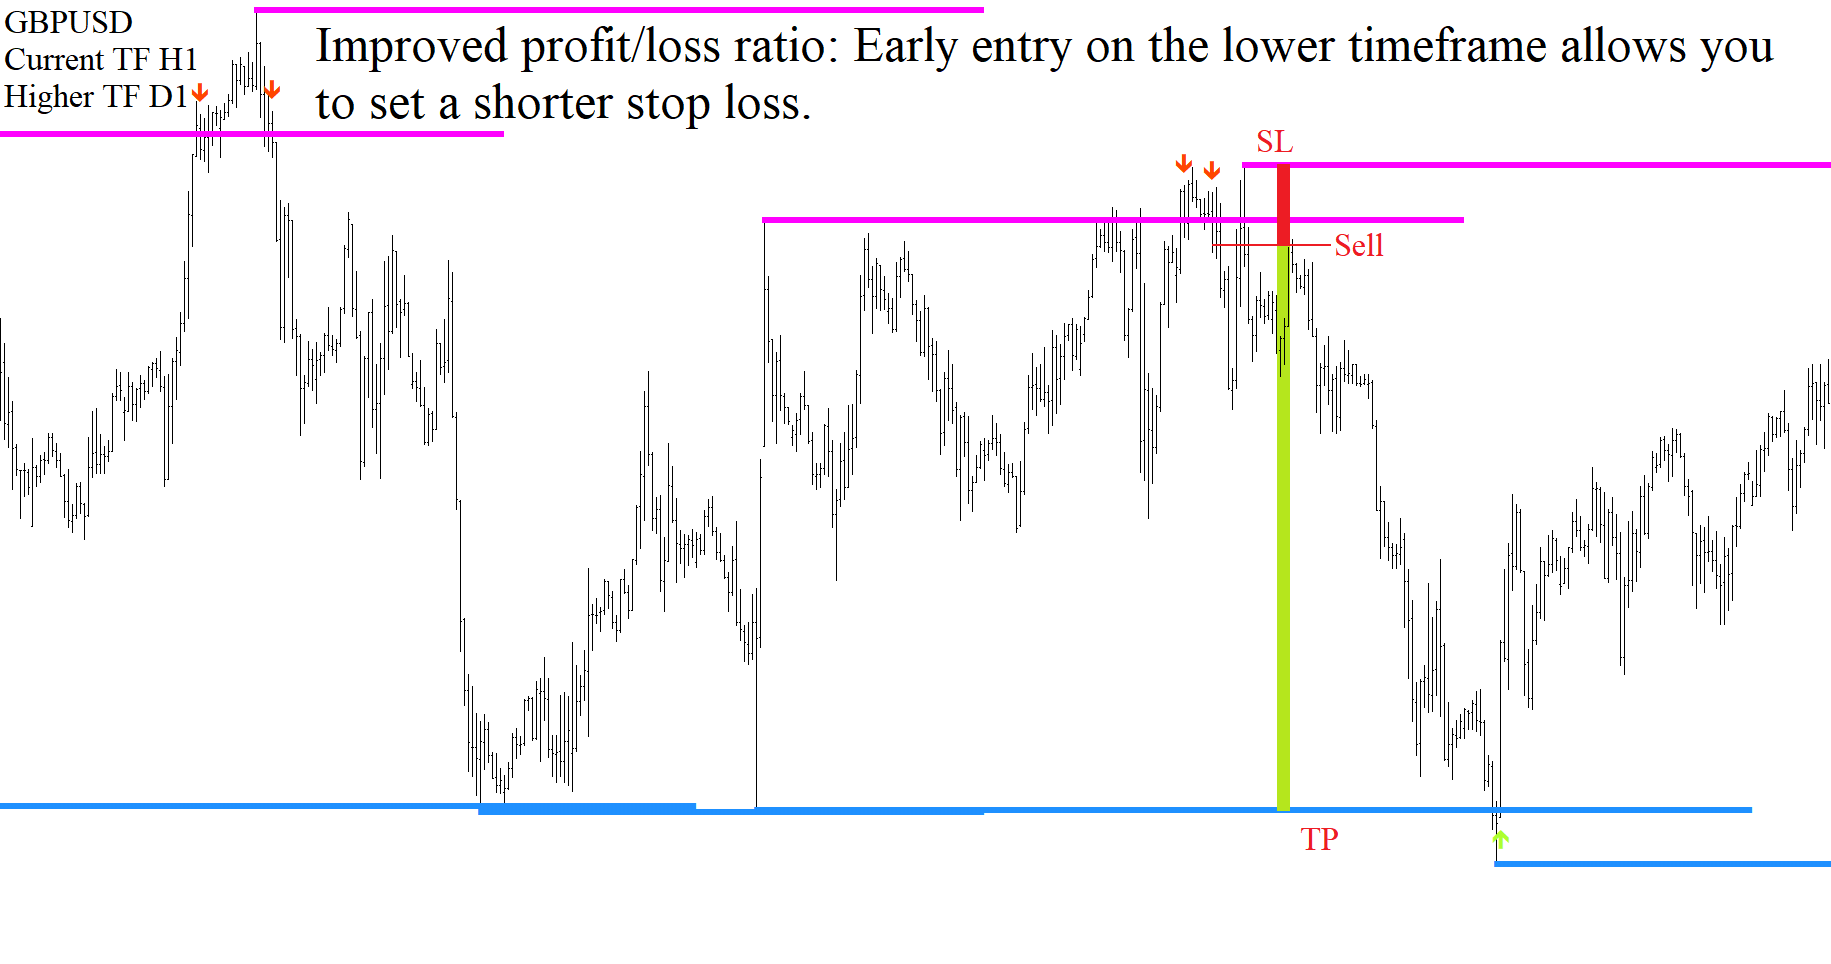
Amélioration du ratio profits/pertes : une entrée précoce sur l'échelle de temps inférieure vous permet de fixer un stop loss plus court, ce qui améliore considérablement l'efficacité de vos transactions.

Alertes pratiques : Ne manquez jamais un signal important - recevez des notifications instantanées sur les opportunités d'entrée et de sortie.

Précision accrue de l'analyse : concentrez-vous sur les niveaux clés qui comptent vraiment et ignorez les bruits inutiles du marché.

L'utilisation de l'indicateur Fractal Levels basé sur le Higher Timeframe vous permettra de voir le marché d'une nouvelle manière et d'améliorer vos résultats de trading. Découvrez de nouvelles opportunités de trading et atteignez vos objectifs avec une précision et une efficacité inégalées.

Produits recommandés
Pivot Points MT5 is a universal color multicurrency/multisymbol indicator of the Pivot Points levels systems. You can select one of its three versions: Standard Old, Standard New and Fibo . It plots pivot levels for financial instruments in a separate window . The system will automatically calculate the Pivot Point on the basis of market data for the previous day ( PERIOD_D1 ) and the system of support and resistance levels, three in each. A user can choose colors for the indicator lines. The on
Support and Resistance Malaysian   est un indicateur personnalisé conçu pour afficher les niveaux de support et de résistance sur un graphique MetaTrader 5. Il utilise une méthode de détermination des niveaux de support et de résistance basée sur les pics (A-Levels), les creux (V-Levels) et les écarts de prix (Gap-Levels). Fonctionnement L'indicateur MSnR Lines identifie trois types de niveaux horizontaux : A-Level (Niveau A)   : Il est situé au sommet du graphique linéaire et prend la forme de
Custom Pivots MT5
Tsvetan Tsvetanov
5 (1)
Pivots Points are significant levels traders can use to determine directional movement, support and resistance. Pivot Points use the prior period's high, low and close to formulate future support and resistance. In this regard, Pivot Points are predictive and leading indicators. Pivot Points were originally used by floor traders to set key levels. Floor traders are the original day traders. They deal in a very fast moving environment with a short-term focus. At the beginning of the trading day,
KT Auto Trendline MT5
KEENBASE SOFTWARE SOLUTIONS
KT Auto Trendline draws the upper and lower trendlines automatically using the last two significant swing highs/lows. Trendline anchor points are found by plotting the ZigZag over X number of bars. Features No guesswork requires. It instantly draws the notable trendlines without any uncertainty. Each trendline is extended with its corresponding rays, which helps determine the area of breakout/reversal. It can draw two separate upper and lower trendlines simultaneously. It works on all timefr
Pivot Prof
Paul Anscombe
4.94 (51)
Ulimate MTF Support & Resistance - 5 Star Best Seller Beginner or Professional our best selling multi-timeframe Pivot Prof will enhance your trading and bring you great trade opportunities with the Support and Resistance levels that professionals use. Pivot trading is a simple effective method for entering and exiting the market at key levels and has been used by professionals for decades and works on all symbols: Forex, Crypto, Stocks, Indicies etc. Pivot Prof brings premium levels to the trade
MetaTrend M5
Vahidreza Heidar Gholami
5 (2)
Meta Trend Indicator is an efficient way to forecast and detect the trend in any market. It reveals the trend, support and resistance levels, volatility and the maximum potential target, all in one indicator. To adapt to the price and to decrease consecutive trend failures, the internal trend detector algorithm studies the market and dynamically chooses the right values for the internal parameters. This indicator is a perfect trend filter for any strategy or expert advisor. Features Super Adapti
Created by imjesstwoone and mickey1984, this trade model attempts to capture the expansion from the 10:00-14:00 EST 4h candle using just 3 simple steps. All of the information presented in this description has been outlined by its creators, all I did was translate it to MQL5. All core settings of the trade model may be edited so that users can test several variations, however this description will cover its default, intended behavior using NQ 5m as an example. Step 1 is to identify our Price Ra
This is a multi-timeframe indicator that detects and displays support and resistance (S&R) lines using the ZigZag indicator. Features The support and resistance lines are not redrawing. The indicator is capable of adding new support and resistance levels as they appear. Each S&R line has a tooltip that displays the price level and start time. Shows the start time, price level and number of touches of all S&R lines when pressing the shortcut Shift+I Save time for multi-timeframe analysis on
Automatic Fibonacci Tool Fibonacci retracements is a popular instrument used by technical analysts to determine potential Support and Resistance areas. In technical analysis, this tool is created by taking two extreme points (usually a peak and a minimum) on the chart and dividing the vertical distance by the key Fibonacci coefficients equal to 23.6%, 38.2%, 50%, 61.8%, and 100%. Our Automatic Fibonacci Tool is programmed to make thigs easier. Using this tool, there is no need to explicitly set
Daily Pivots Multi Indicator Daily Pivots Multi is an exclusive indicator to draw your pivots levels and much more. Most indicators draw daily pivots for the day. Daily Pivots Multi is able to draw levels for different days. The indicator can do the calculation for unlimited number of days backward. It means that you can draw the levels for today but also for the past days. This is very useful if you want to study a strategy with Pivots levels over a period of time. Another problem is th
All Harmonics 26
Alexey Isavnin
3.8 (5)
Harmonic patterns are characteristic series of price movements with respect to Fibonacci levels, which statistically precede price reversals. This indicator searches for harmonic patterns. It is capable of recognising 26 classical and non-classical harmonic patterns : Classical Gartley Butterfly Alternate Butterfly Bat Alternate Bat Crab Deep Crab Three Drives Non-classical Shark Alternate Shark Cypher 5-0 Anti Gartley Anti Butterfly Anti Alternate Butterfly Anti Bat Anti Alternate Bat Anti Crab
An extended version of the indicator for visualizing the time ranges of key trading sessions: Asian, European and American. The main advantage of this indicator is the automatic construction of a price profile for a trading session. The indicator has the functionality to set the start and end time of each trading session, as well as automatically determine the time zone of the trading server. The indicators include the ability to work with minimal CPU usage and save RAM. In addition, the option
This is a multi-timeframe indicator that detects and displays support and resistance (S&R) lines using the ZigZag indicator. Features The support and resistance lines are not redrawing. The indicator is capable of adding new support and resistance levels as they appear. Each S&R line has a tooltip that displays the price level and start time. Save time for multi-timeframe analysis on trades. All types of alerts (sound, pop-up, email, mobile push notification) are available. Working with al
Mine Farm
Maryna Kauzova
5 (1)
Mine Farm is one of the most classic and time-tested scalping strategies based on the breakdown of strong price levels. Mine Farm is the author's modification of the system for determining entry and exit points into the market... Mine Farm - is the combination of great potential with reliability and safety. Why Mine Farm?! - each order has a short dynamic Stop Loss - the advisor does not use any risky methods (averaging, martingale, grid, locking, etc.) - the advisor tries to get
Véritable indicateur de l'offre et de la demande       - vous permettra de déterminer rapidement l'emplacement des niveaux de résistance et de support sur toutes les périodes. L'indicateur sera utile pour ceux qui utilisent l'analyse technique dans leur trading. L'indicateur est facile à utiliser, il suffit de glisser-déposer sur le graphique et l'indicateur vous montrera les niveaux de support et de résistance les plus probables. Lorsque vous changez de période, vous verrez les niveaux de la n
A pivot point is   an intraday technical indicator used to identify trends and reversals mainly in equities, commodities, and forex markets . Pivot points are calculated to determine levels in which the sentiment of the market could change from bullish to bearish, and vice-versa. the swing daily is an advanced pivot points indicator that grants the user control over many aspects of the trading levels that you'll get familiar with in the controls section  it's used mainly to locate intraday
My Pivot
Ashok Kumar Singha
My Pivot is an Indicator based on Pivot Lines and Support-Resistance zones. This Indicator will Plot 11 SR zones including Pivot Line which will definitely help you to understand the exact SR zones of the Market. Steps to Setup the Indicator: Install the Custom Indicator; Set all the Lines Color, Width and Styles; Set visualization to All Timeframe; and DONE It can be used for: All Pairs: Forex, Cryptocurrencies, Metals, Stocks, Indices.  All Timeframe All Brokers All type of Trading
The Camarilla Pivots indicator is fully configurable and can be adjusted to work in different ways. If you are a manual trader and prefer a clean chart, you can configure the indicator so that it only draws camarilla pivot points for the current session. Otherwise if you are developing an expert advisor that uses pivot points, you can configure the indicator to show historical camarilla pivots as well. Another unique feature of this indicator is that, when calculating daily camarilla pivots, it
VR Pivot MT5
Vladimir Pastushak
VR Pivot is an indicator of key pivot points. Pivot points are a special type of support and resistance levels that are used to determine the strongest price zones. Professional traders use pivot levels to determine prices at which there is a high probability of a price reversal. The levels are calculated using special mathematical formulas, which include the closing, opening, high, and low prices of the previous time period. The most effective is the daily period. It is important to note that a
The Choppiness Index was created by Australian commodity trader E.W. Dreiss. It is  designed to determine if the market is choppy (trading sideways) or not choppy (trading within a trend in either direction). A basic understanding of the indicator would be; higher values equal more choppiness, while lower values indicate directional trending. The  values operate between 0 and 100.  The closer the value is to 100, the higher the choppiness (sideways movement) levels. The closer the value is to 0,
Awesome Oscillator by Bill Williams with the ability to fine-tune and replace the averaging algorithms of the indicator, which significantly expands the possibilities of using this oscillator in algorithmic trading and brings it closer in its properties to such an indicator as the MACD. To reduce price noise, the final indicator is processed with an additional Smooth averaging. The indicator has the ability to give alerts, send mail messages and push signals when the direction of movement of th
Unlock key market insights with automated support and resistance lines Special Offer: Purchase now to receive free bonuses worth $89! (Read more for details) Tired of plotting support and resistance lines? This is a multi-timeframe indicator that detects and plots supports and resistance lines in the chart with the same precision as a human eye would. As price levels are tested over time and its importance increases, the lines become thicker and darker, making price leves easy to glance and ev
FFx Pivot SR Suite Pro MT5
Eric Venturi-Bloxs
4.67 (3)
MetaTrader 4 version available here: https://www.mql5.com/en/market/product/25793 FFx Pivot SR Suite PRO is a complete suite for support and resistance levels. Support and Resistance are the most used levels in all kinds of trading. Can be used to find reversal trend, to set targets and stop, etc. The indicator is fully flexible directly from the chart 4 periods to choose for the calculation: 4Hours, Daily, Weekly and Monthly 4 formulas to choose for the calculation: Classic, Camarilla, Fibona
----< High Accuracy Entry Signals and Trend Indicator >---- TrendEntry could tell you the trend direction, resistance and support, when to open orders and where to set stoploss & takeprofit. this is a multifunctional indicator, can work well on all symbols and timeframes. Features: real-time analysis of trend direction filter out all the minor waves show resistance and support along as price goes give highly accurate entry signals frequently send alert in popup, email, notification way a
Unlock the power of Fibonacci with our advanced indicator! This tool precisely plots Fibonacci levels based on the previous day's high and low, identifying the next day's key support and resistance levels. Perfect for day trading and swing trading, it has consistently generated weekly profits for me. Elevate your trading strategy and seize profitable opportunities with ease. NOTE: In the Input section make sure the draw labels are set to "True" so you can see each levels.
AliPivot Points is a Meta Trader 5 Indicator that draws you the latest pivot points. You can choose from timeframes ranging from 1 Minute to 1 Month. Calculation methods for pivot points includes: Classic Pivot Points Camarilla Pivot Points Fibonacci Pivot Points Woodie Pivot Points You can personalize the line colors, style, and width to suit your preference. The indicator displays values on the right side of the chart. AliPivot Points values can also be utilized by developers for creating Expe
FREE
The PUA MultiType Pivot indicator is built on the daily chart of the previous day. The PUA MultiType Pivot indicator is one of the most popular tools in technical analysis, used by traders to identify potential reversal points in financial markets. This indicator constructs three types of Pivot points: Classic, Fibonacci, and Camarilla, each offering its unique approach to market analysis. The advantages of this indicator include: Simplicity and Clarity PUA MultiType Pivot provides clearly defi
Le niveau Premium est un indicateur unique avec une précision de plus de 80 % des prédictions correctes ! Cet indicateur a été testé par les meilleurs Trading Specialists depuis plus de deux mois ! L'indicateur de l'auteur que vous ne trouverez nulle part ailleurs ! À partir des captures d'écran, vous pouvez constater par vous-même la précision de cet outil ! 1 est idéal pour le trading d'options binaires avec un délai d'expiration de 1 bougie. 2 fonctionne sur toutes les paires de de
Introduction to Support Resistance Indicator Support and Resistance are the important price levels to watch out during intraday market. These price levels are often tested before development of new trend or often stop the existing trend causing trend reversal at this point. Highly precise support and resistance are indispensable for experienced traders. Many typical trading strategies like breakout or trend reversal can be played well around these support and resistance levels. The Precision Sup
Ultimate Supply Demand MT5
Ramon Sobrevals Arce
5 (4)
After working during many months, with the help of Neural Networks, we have perfected the ultimate tool you are going to need for identifying key price levels (Supports and Resistances) and Supply and Demand zones. Perfectly suitable to trigger your trades, set up your future actions, decide your Take Profit and Stop Loss levels, and confirm the market direction. Price will always move between those levels, bouncing or breaking; from one zone to another, all the remaining movements are just mark
Les acheteurs de ce produit ont également acheté
Atomic Analyst MT5
Issam Kassas
4.79 (19)
Tout d'abord, il convient de souligner que cet indicateur de trading n'est ni repainting, ni redrawing et ne présente aucun délai, ce qui le rend idéal à la fois pour le trading manuel et automatisé. Manuel de l'utilisateur : réglages, entrées et stratégie. L'Analyste Atomique est un indicateur d'action sur les prix PA qui utilise la force et le momentum du prix pour trouver un meilleur avantage sur le marché. Équipé de filtres avancés qui aident à éliminer les bruits et les faux signaux, et à
Tout d'abord, il convient de souligner que ce système de trading est un indicateur non repeint, non redessiné et non retardé, ce qui le rend idéal pour le trading manuel et automatisé. Cours en ligne, manuel et téléchargement de préréglages. Le "Système de Trading Smart Trend MT5" est une solution de trading complète conçue pour les traders débutants et expérimentés. Il combine plus de 10 indicateurs premium et propose plus de 7 stratégies de trading robustes, ce qui en fait un choix polyvalent
Gold Stuff mt5
Vasiliy Strukov
4.9 (182)
Gold Stuff mt5 est un indicateur de tendance conçu spécifiquement pour l'or et peut également être utilisé sur n'importe quel instrument financier. L'indicateur ne se redessine pas et ne traîne pas. Délai recommandé H1. Contactez-moi immédiatement après l'achat pour obtenir les réglages et un bonus personnel !   Vous pouvez obtenir une copie gratuite de notre indicateur Strong Support et Trend Scanner, veuillez envoyer un message privé. moi!   RÉGLAGES Dessiner la flèche - on off. dessine
TPSpro RFI Levels MT5
Roman Podpora
4.67 (9)
Reversal First Impulse levels (RFI)      INSTRUCTIONS        RUS       -       ENG              R ecommended to use with an indicator   -   TPSpro  TREND PRO -  Version MT4                 A key element in trading is zones or levels from which decisions to buy or sell a trading instrument are made. Despite attempts by major players to conceal their presence in the market, they inevitably leave traces. Our task was to learn how to identify these traces and interpret them correctly. Main functi
TPSproTREND PrO MT5
Roman Podpora
4.89 (9)
TPSpro TREND PRO  - is a trend indicator that automatically analyzes the market and provides information about the trend and each of its changes, as well as giving signals for entering trades without redrawing! The indicator uses each candle, analyzing them separately. referring to different impulses - up or down impulse. Exact entry points into transactions for currencies, crypto, metals, stocks, indices!  Version MT4               DETAILED DESCRIPTION               R ecommended to use with an
Trend Screener Pro MT5
STE S.S.COMPANY
4.88 (67)
Indicateur de tendance, solution unique révolutionnaire pour le trading et le filtrage des tendances avec toutes les fonctionnalités de tendance importantes intégrées dans un seul outil ! Il s'agit d'un indicateur multi-période et multi-devises 100 % non repeint qui peut être utilisé sur tous les symboles/instruments : forex, matières premières, crypto-monnaies, indices et actions. Trend Screener est un indicateur de suivi de tendance efficace qui fournit des signaux de tendance fléchés avec des
Quantum Trend Sniper
Bogdan Ion Puscasu
4.92 (48)
Présentation       Quantum Trend Sniper Indicator   , l'indicateur révolutionnaire MQL5 qui transforme la façon dont vous identifiez et négociez les inversions de tendance ! Développé par une équipe de traders expérimentés avec une expérience commerciale de plus de 13 ans,       Indicateur Quantum Trend Sniper       est conçu pour propulser votre parcours de trading vers de nouveaux sommets grâce à sa manière innovante d'identifier les inversions de tendance avec une précision extrêmement élevée
FX Power MT5 NG
Daniel Stein
5 (6)
Obtenez votre mise à jour quotidienne du marché avec des détails et des captures d'écran via notre Morning Briefing ici sur mql5 et sur Telegram ! FX Power MT5 NG est la nouvelle génération de notre très populaire indicateur de force des devises, FX Power. Et qu'est-ce que ce compteur de force de nouvelle génération offre ? Tout ce que vous avez aimé de l'original FX Power PLUS Analyse de la force de l'OR/XAU Des résultats de calcul encore plus précis Périodes d'analyse configurables individuel
Tout d'abord, il convient de souligner que cet outil de trading est un indicateur non repeint, non redessiné et non retardé, ce qui le rend idéal pour le trading professionnel. Cours en ligne, manuel utilisateur et démonstration. L'indicateur Smart Price Action Concepts est un outil très puissant à la fois pour les nouveaux et les traders expérimentés. Il regroupe plus de 20 indicateurs utiles en un seul, combinant des idées de trading avancées telles que l'analyse du trader Inner Circle et
IX Power MT5
Daniel Stein
4.17 (6)
IX Power   apporte enfin la précision imbattable de FX Power aux symboles non-Forex. Il détermine avec précision l'intensité des tendances à court, moyen et long terme de vos indices, actions, matières premières, ETF et même crypto-monnaies préférés. Vous pouvez   analyser tout ce que   votre terminal a à offrir. Essayez-le et découvrez comment   votre timing s'améliore considérablement   lors de vos transactions. Caractéristiques principales d'IX Power Résultats de calcul précis à 100 %,
Ce tableau de bord affiche les derniers   modèles harmoniques   disponibles pour les symboles sélectionnés, ce qui vous permettra de gagner du temps et d'être plus efficace /   version MT4 . Indicateur gratuit:   Basic Harmonic Pattern Colonnes de l'indicateur Symbol :   les symboles sélectionnés apparaissent Trend   :   haussière ou baissière Pattern :   type de motif (gartley, papillon, chauve-souris, crabe, requin, cypher ou ABCD) Entry:   prix d'entrée SL:   prix du stop loss TP1:   1
Top indicator for MT5   providing accurate signals to enter a trade without repainting! It can be applied to any financial assets:   forex, cryptocurrencies, metals, stocks, indices .  Watch  the video  (6:22) with an example of processing only one signal that paid off the indicator! MT4 version is here It will provide pretty accurate trading signals and tell you when it's best to open a trade and close it. Most traders improve their trading results during the first trading week with the help of
Maintenant 147 $ (augmentant à 499 $ après quelques mises à jour) - Comptes illimités (PCS ou Mac) Manuel d'utilisation RelicusRoad + Vidéos de formation + Accès au groupe Discord privé + Statut VIP UNE NOUVELLE FAÇON DE REGARDER LE MARCHÉ RelicusRoad est l'indicateur de trading le plus puissant au monde pour le forex, les contrats à terme, les crypto-monnaies, les actions et les indices, offrant aux traders toutes les informations et tous les outils dont ils ont besoin pour rester renta
ICT, SMC, SMART MONEY CONCEPTS, SMART MONEY, Smart Money Concept, Support and Resistance, Trend Analysis, Price Action, Market Structure, Order Blocks, BOS/CHoCH,   Breaker Blocks ,  Momentum Shift,   Supply&Demand Zone/Order Blocks , Strong Imbalance,   HH/LL/HL/LH,    Fair Value Gap, FVG,  Premium  &   Discount   Zones, Fibonacci Retracement, OTE, Buy Side Liquidity, Sell Side Liquidity, BSL/SSL Taken, Equal Highs & Lows, MTF Dashboard, Multiple Time Frame, BigBar, HTF OB, HTF Market Structure
Easy By Sell is a market indicator for opening and closing positions. It becomes easy to track market entries with alerts. It indicates trend reversal points when a price reaches extreme values ​​and the most favorable time to enter the market. it is as effective as a Fibonacci to find a level but it uses different tools such as an algorithm based on ATR indicators and Stochastic Oscillator. You can modify these two parameters as you wish to adapt the settings to the desired period. My othe
Blahtech Supply Demand MT5
Blahtech Limited
4.54 (13)
Was: $299  Now: $99   Supply Demand uses previous price action to identify potential imbalances between buyers and sellers. The key is to identify the better odds zones, not just the untouched ones. Blahtech Supply Demand indicator delivers functionality previously unavailable on any trading platform. This 4-in-1 indicator not only highlights the higher probability zones using a multi-criteria strength engine, but also combines it with multi-timeframe trend analysis, previously confirmed swings
Advanced Supply Demand MT5
Bernhard Schweigert
4.53 (15)
La meilleure solution pour tout commerçant débutant ou expert ! Cet indicateur est un outil de trading unique, de haute qualité et abordable car nous avons intégré un certain nombre de fonctionnalités propriétaires et une nouvelle formule. Avec cette mise à jour, vous pourrez afficher des zones à double horaire. Vous pourrez non seulement afficher un TF plus élevé, mais afficher les deux, le graphique TF, PLUS le TF supérieur : AFFICHAGE DES ZONES NICHÉES. Tous les traders Supply Demand vont ado
Introduction to X3 Chart Pattern Scanner X3 Cherart Pattern Scanner is the non-repainting and non-lagging indicator detecting X3 chart patterns including Harmonic pattern, Elliott Wave pattern, X3 patterns, and Japanese Candlestick patterns. Historical patterns match with signal patterns. Hence, you can readily develop the solid trading strategy in your chart. More importantly, this superb pattern scanner can detect the optimal pattern of its kind. In addition, you can switch on and off individu
AW Trend Predictor MT5
AW Trading Software Limited
4.78 (58)
La combinaison des niveaux de tendance et de panne dans un seul système. Un algorithme d'indicateur avancé filtre le bruit du marché, détermine la tendance, les points d'entrée, ainsi que les niveaux de sortie possibles. Les signaux indicateurs sont enregistrés dans un module statistique, qui vous permet de sélectionner les outils les plus appropriés, montrant l'efficacité de l'historique des signaux. L'indicateur calcule les marques Take Profit et Stop Loss. Manuel et instruction ->   ICI   / v
FX Trend MT5
Daniel Stein
4.68 (37)
Vous voulez devenir un trader forex 5 étoiles constamment rentable ? 1.   Lisez la description de base de notre   système de   trading simple et   la mise à jour majeure de sa stratégie en 2020 2.   Envoyez une capture d'écran de votre achat pour recevoir votre invitation personnelle à notre chat de trading exclusif FX Trend   affiche la direction de la tendance, sa durée, son intensité et l'évaluation de la tendance qui en résulte pour tous les cadres temporels en temps réel. Vous verrez d'u
Présentation       Quantum Breakout PRO   , l'indicateur révolutionnaire MQL5 qui transforme la façon dont vous négociez les zones d'évasion ! Développé par une équipe de traders expérimentés avec une expérience commerciale de plus de 13 ans,       Évasion quantique PRO       est conçu pour propulser votre parcours commercial vers de nouveaux sommets grâce à sa stratégie de zone de discussion innovante et dynamique. Quantum Breakout Indicator vous donnera des flèches de signalisation sur le
Auto Order Block with break of structure based on ICT and Smart Money Concepts (SMC) Futures Break of Structure ( BoS )             Order block ( OB )            Higher time frame Order block / Point of Interest ( POI )    shown on current chart           Fair value Gap ( FVG ) / Imbalance   -  MTF      ( Multi Time Frame )    HH/LL/HL/LH  -  MTF      ( Multi Time Frame )  Choch  MTF      ( Multi Time Frame )  Volume Imbalance     ,  MTF          vIMB Gap’s Power of 3 Equal High
AT Forex Indicator MT5
Marzena Maria Szmit
5 (4)
The AT Forex Indicator MT5 is a sophisticated trading tool designed to provide traders with a comprehensive analysis of multiple currency pairs. This powerful indicator simplifies the complex nature of the forex market, making it accessible for both novice and experienced traders. AT Forex Indicator uses advanced algorithms to detect trends, patterns and is an essential tool for traders aiming to enhance their forex trading performance. With its robust features, ease of use, and reliable signal
Matrix Arrow Indicator MT5
Juvenille Emperor Limited
5 (14)
Matrix Arrow Indicator MT5   est une tendance unique 10 en 1 suivant un indicateur multi-période   100% non repeint   qui peut être utilisé sur tous les symboles/instruments:   forex ,   matières premières ,   crypto-monnaies ,   indices ,  actions .  Matrix Arrow Indicator MT5  déterminera la tendance actuelle à ses débuts, en rassemblant des informations et des données à partir d'un maximum de 10 indicateurs standard, qui sont: Indice de mouvement directionnel moyen (ADX) Indice de canal de m
Gold TMAF MTF - il s'agit d'un meilleur indicateur technique boursier. L'algorithme de l'indicateur analyse le mouvement du prix d'un actif et reflète la volatilité et les zones d'entrée potentielles. Les meilleurs signaux de l'indicateur: - Pour VENDRE = limite supérieure rouge de la TMA2 au-dessus de la limite supérieure rouge de la TMA1 + indicateur fractal rouge au-dessus + flèche jaune du signal SR dans la même direction. - Pour l'ACHAT = limite inférieure bleue de la TMA2 en desso
Automated Trendlines MT5
Georgios Kalomoiropoulos
Les lignes de tendance sont l'outil d'analyse technique le plus essentiel dans le trading forex. Malheureusement, la plupart des commerçants ne les dessinent pas correctement. L'indicateur Automated Trendlines est un outil professionnel pour les traders sérieux qui vous aide à visualiser le mouvement de tendance des marchés. Il existe deux types de lignes de tendance, les lignes de tendance haussières et les lignes de tendance baissières. Dans la tendance haussière, la ligne de tendance
Elliott Wave Trend was designed for the scientific wave counting. This tool focuses to get rid of the vagueness of the classic Elliott Wave Counting using the guideline from the template and pattern approach. In doing so, firstly Elliott Wave Trend offers the template for your wave counting. Secondly, it offers Wave Structural Score to assist to identify accurate wave formation. It offers both impulse wave Structural Score and corrective wave Structure Score. Structural Score is the rating to sh
Gartley Hunter Multi
Siarhei Vashchylka
5 (8)
Gartley Hunter Multi - An indicator for searching for harmonic patterns simultaneously on dozens of trading instruments and on all possible timeframes. Manual (Be sure to read before purchasing) | Version for MT4 Advantages 1. Patterns: Gartley, Butterfly, Shark, Crab. Bat, Alternate Bat, Deep Crab, Cypher 2. Simultaneous search for patterns on dozens of trading instruments and on all possible timeframes 3. Search for patterns of all possible sizes. From the smallest to the largest 4. A
Golden Spikes Premium
Kwaku Bondzie Ghartey
Golden Spikes Detector Overview: The Golden Spikes Premium is a groundbreaking trading indicator meticulously crafted for the Boom and Crash indices on the Deriv market. Tailored to meet the needs of discerning traders, this powerful tool operates exclusively on the one-minute timeframe, providing timely and precise signals to maximize your trading potential. The Golden Spikes Detector stands out in its ability to deliver accurate signals, ensuring that you capitalize on market opportunities wit
FX Volume MT5
Daniel Stein
4.94 (17)
Obtenez votre mise à jour quotidienne du marché avec des détails et des captures d'écran via notre Morning Briefing ici sur mql5 et sur Telegram ! FX Volume est le PREMIER et SEUL indicateur de volume qui fournit un VRAI aperçu du sentiment du marché du point de vue d'un courtier. Il fournit des informations impressionnantes sur la façon dont les acteurs institutionnels du marché, comme les courtiers, sont positionnés sur le marché des changes, bien plus rapidement que les rapports COT. Voir c
Plus de l'auteur
Levels on Fractals with Bands Filter est un outil d'analyse technique qui utilise une combinaison de fractales et de l'indicateur Bollinger Bands pour identifier les niveaux de support et de résistance.  L'outil Levels on Fractals with Bollinger Bands Filter est un outil d'analyse technique qui utilise une combinaison de fractales et de l'indicateur Bollinger Bands pour identifier les niveaux de support et de résistance. Comment l'utiliser. Lorsqu'une fractale se forme derrière la bande d
FREE
Volumes with Moving Average est un indicateur de volume simple et direct complété par une moyenne mobile. Comment l'utiliser ? Il est bien adapté pour filtrer les signaux lors de l'entrée dans une transaction à la fois à partir des niveaux de support/résistance et lors des ruptures de volatilité des canaux de tendance. Il peut également servir de signal pour fermer une position en fonction du volume. Paramètres d'entrée : Volumes - volume réel ou tic-tac. MA_period - période de la moyen
FREE
L'indicateur   Trend based on Extremum Levels and Volatility est un outil pratique conçu pour aider les traders à identifier les points de rupture de tendance et les niveaux potentiels de prise de bénéfices sur différents horizons temporels. L'indicateur peut être utilisé sur les marchés du forex, des futures, des actions, des indices, des matières premières et des crypto-monnaies. Cet indicateur universel construit des tendances basées sur les extrema locaux, la volatilité et la déviation
Filtrer:
Aucun avis
Répondre à l'avis