RSI Divergence Signal
- Indicateurs
- Luiz Felipe De Oliveira Caldas
- Version: 1.0
- Activations: 20
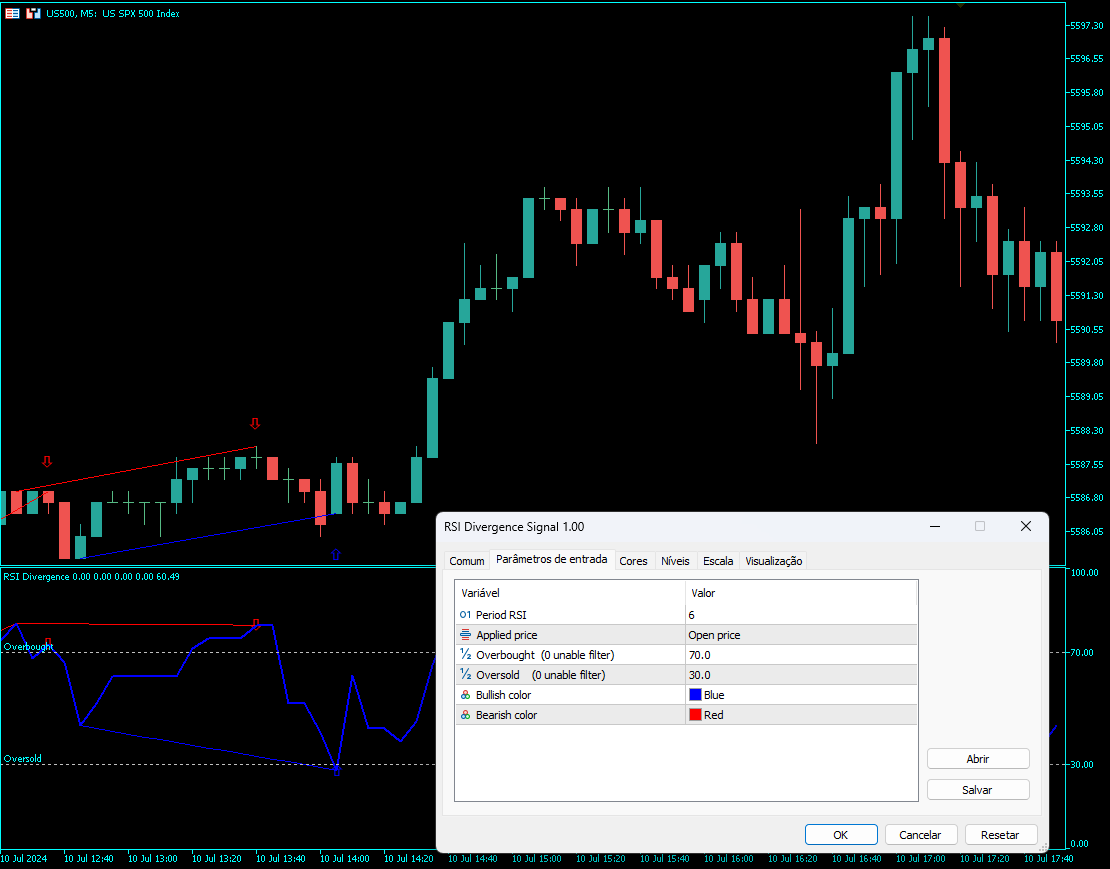
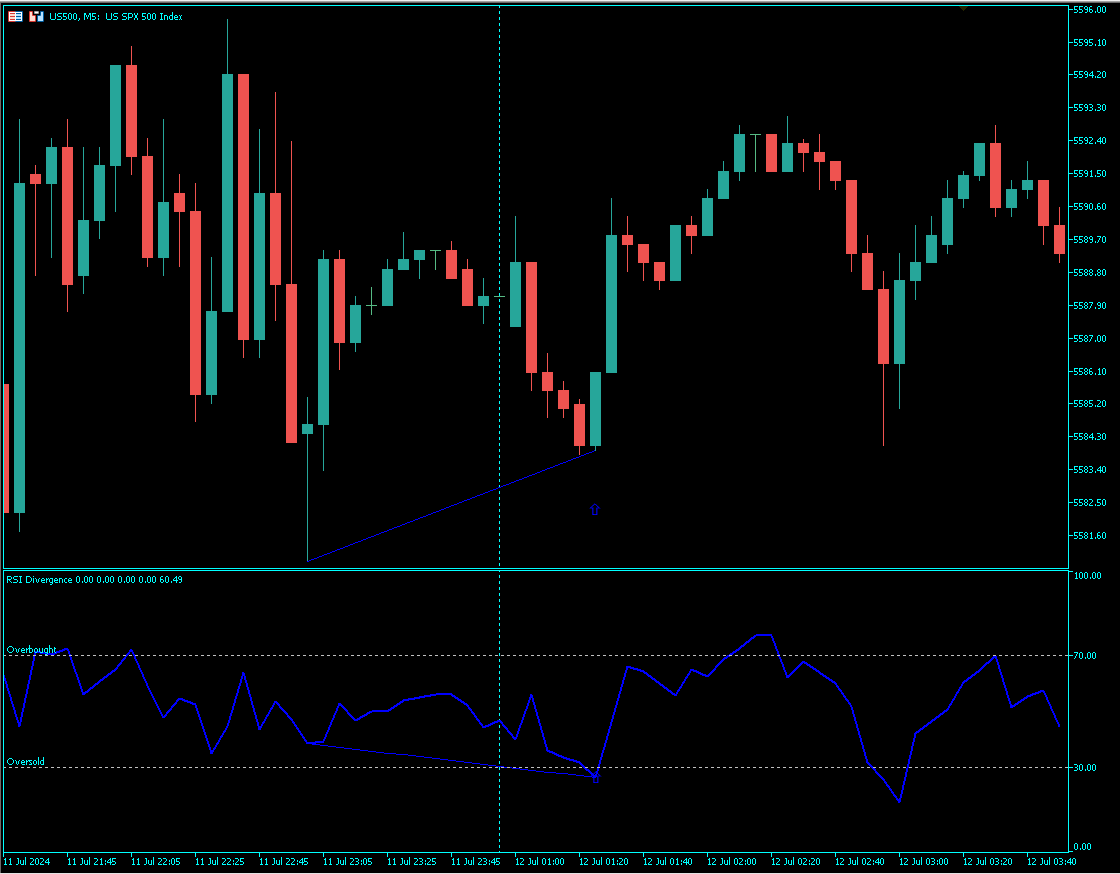
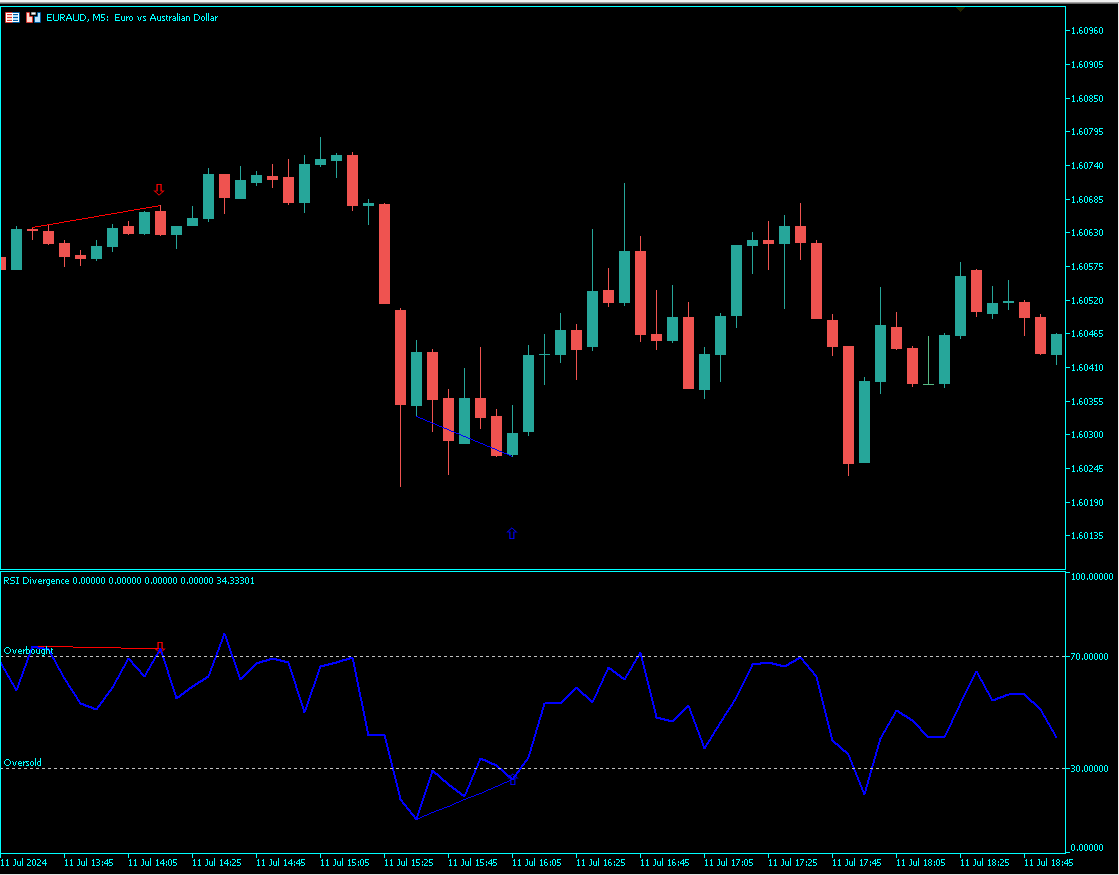
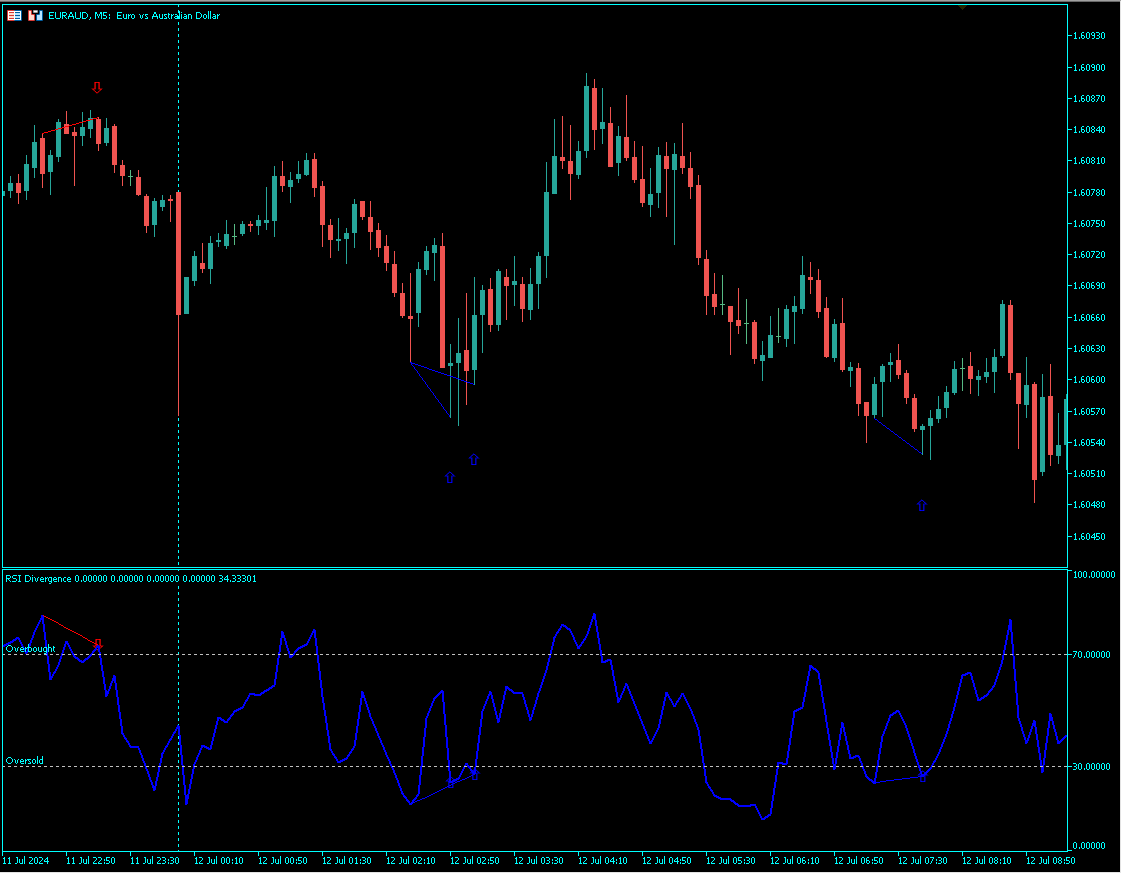
RSI Divergence Signal
The RSI Divergence Signal is a technical analysis tool used in financial markets to identify potential trend reversals. It compares the Relative Strength Index (RSI) with price action to detect divergences. When the RSI moves in the opposite direction of the price, it signals a potential change in momentum, suggesting that the current trend may be weakening. This divergence can indicate a buying opportunity in a downtrend or a selling opportunity in an uptrend. Traders use the RSI Divergence Signal to enhance their strategies and make more informed decisions, aiming for timely market entries and exits.