Volume Break Oscillator
- Indicateurs
- Roberto Bonati
- Version: 1.1
- Mise à jour: 19 juillet 2024
- Activations: 10
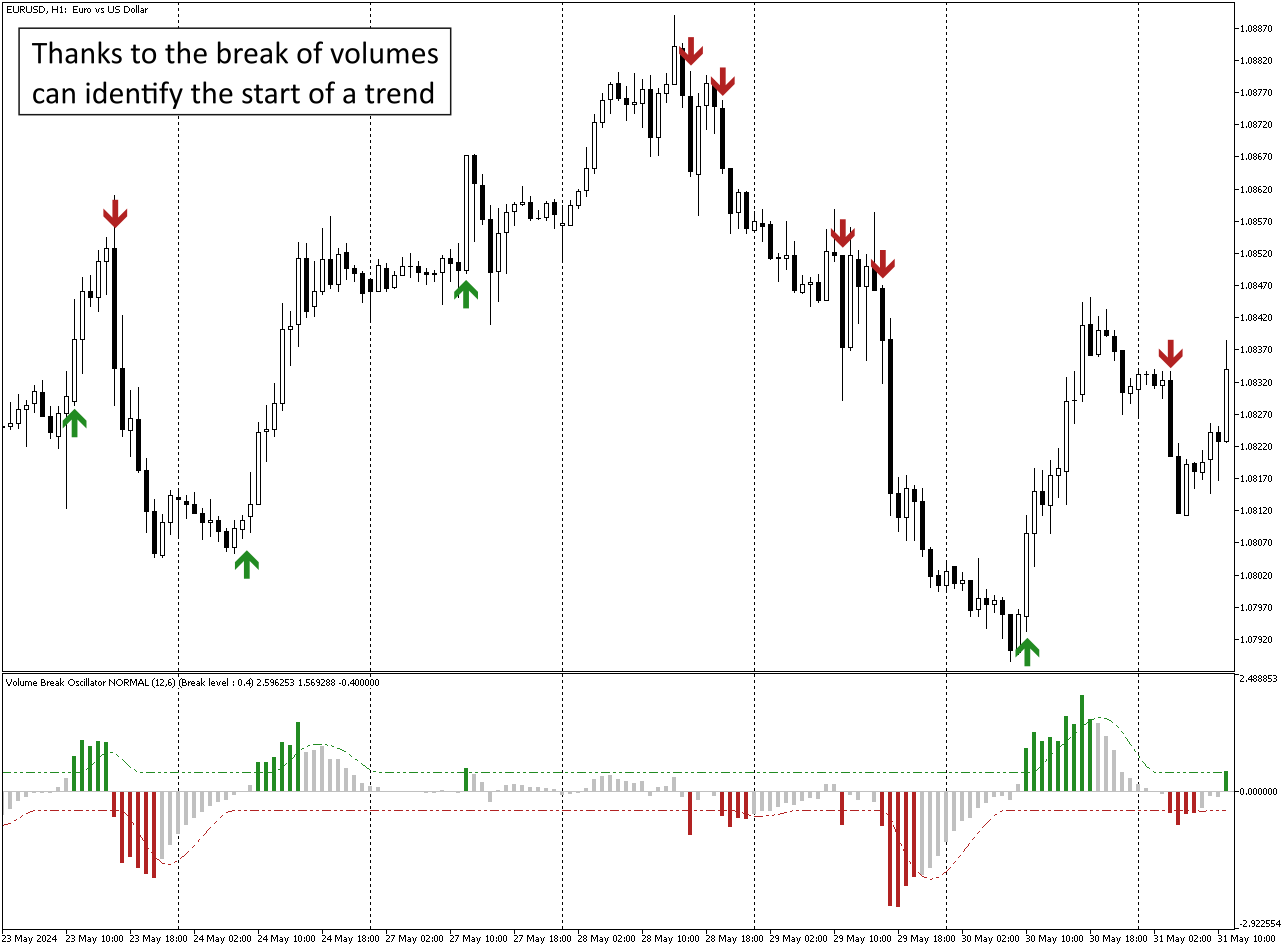
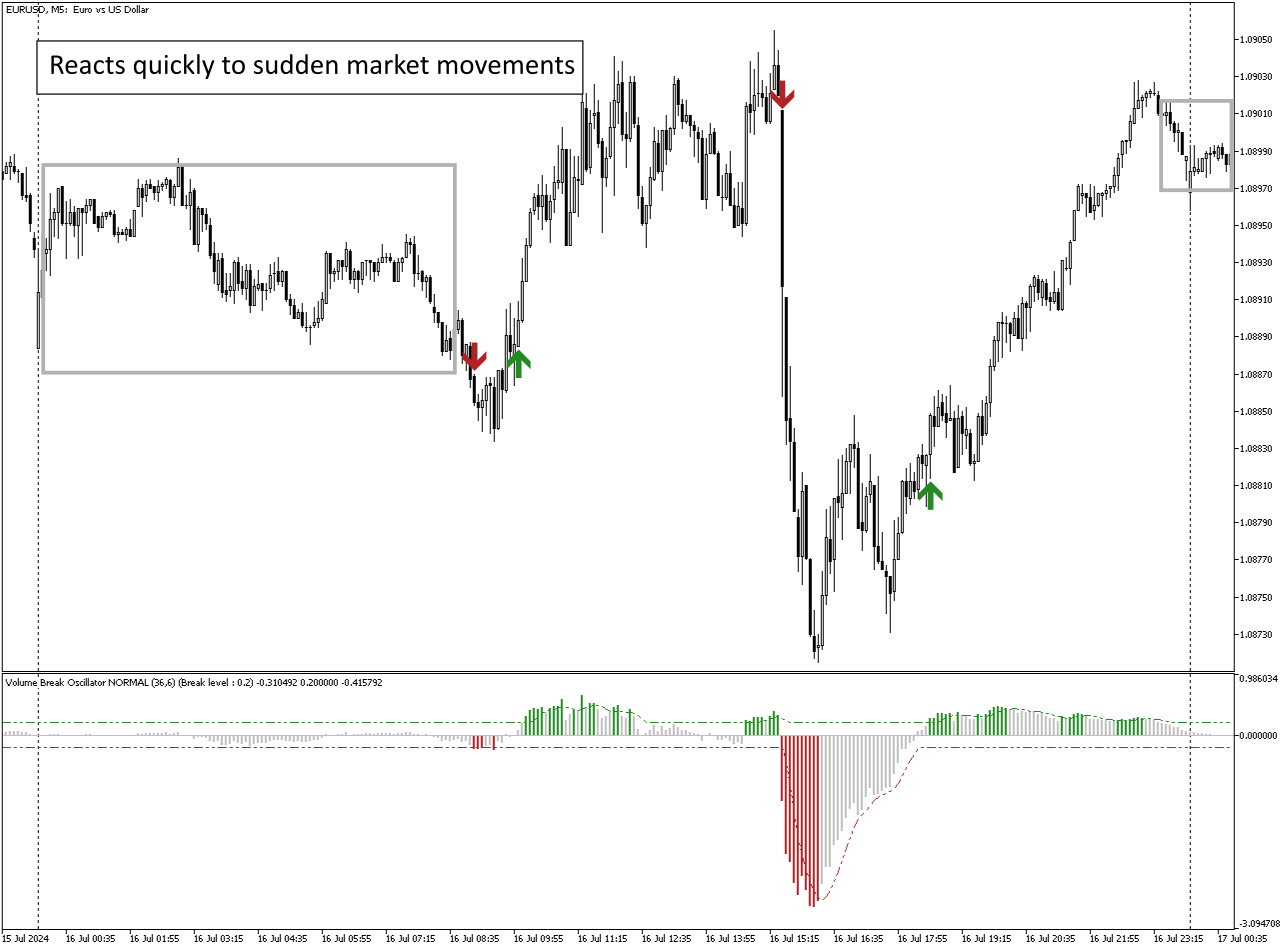
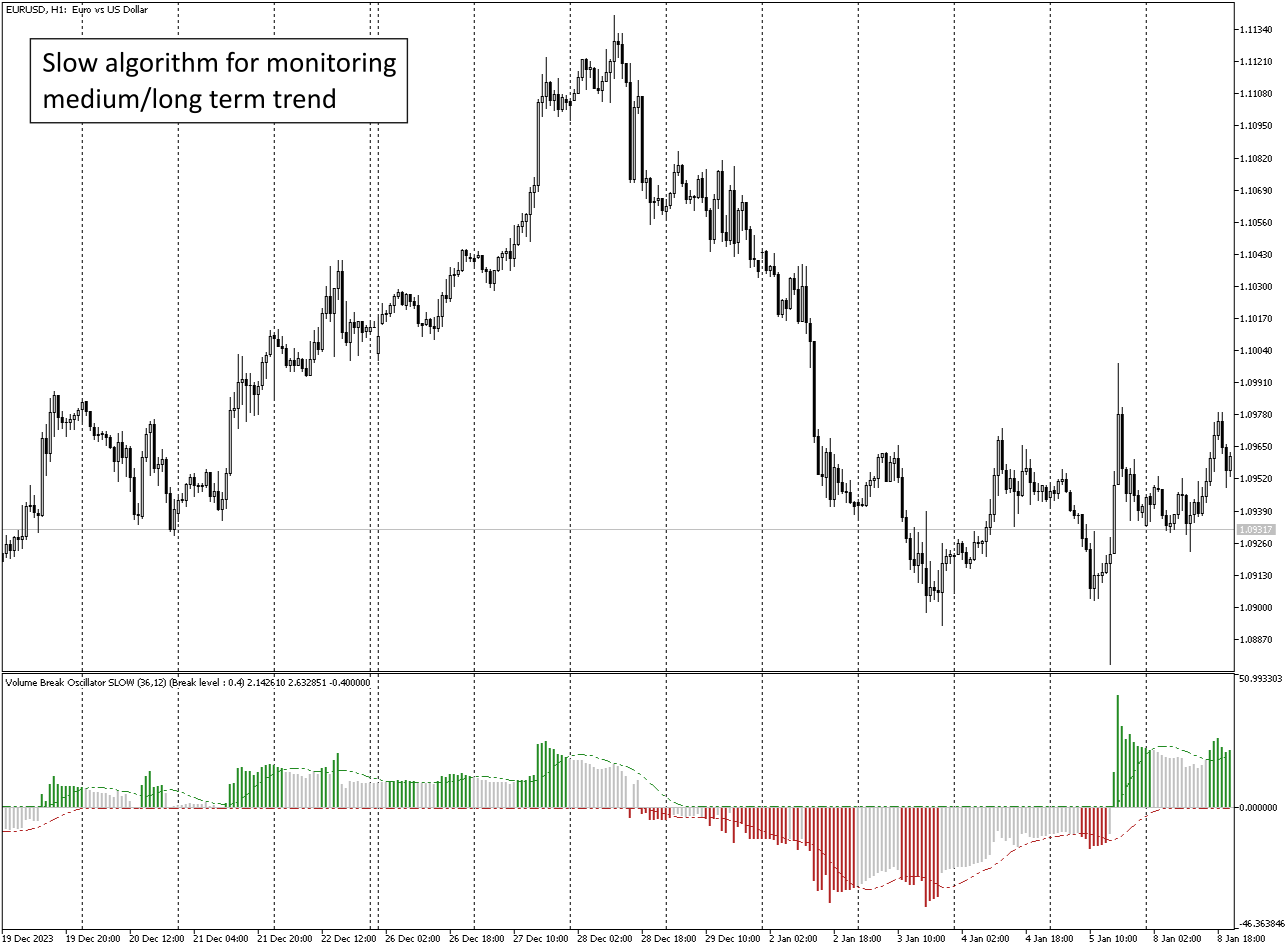
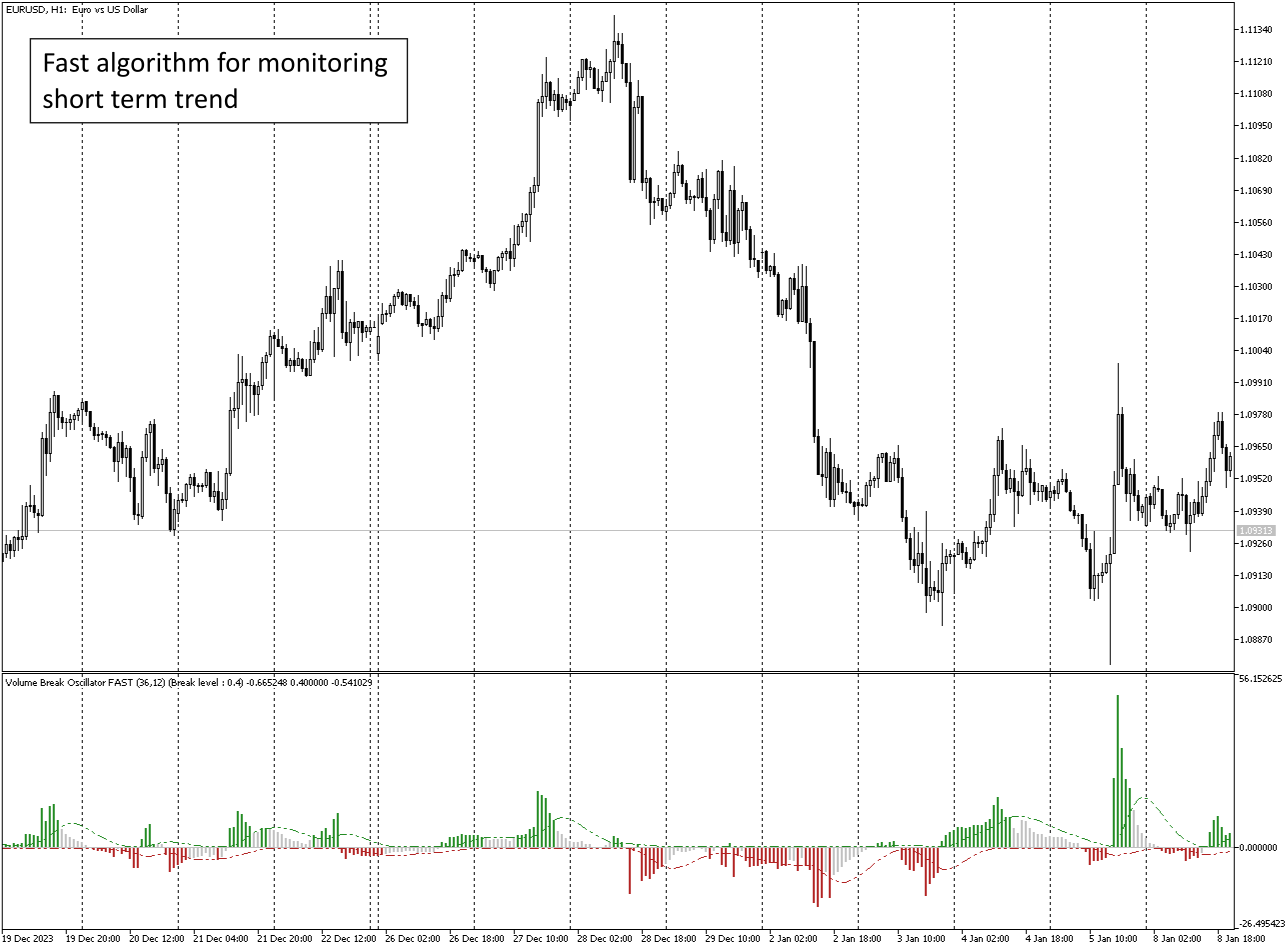
Volume Break Oscillator est un indicateur qui fait correspondre le mouvement des prix aux tendances des volumes sous la forme d'un oscillateur.
Je souhaitais intégrer l'analyse des volumes dans mes stratégies mais j'ai toujours été déçu par la plupart des indicateurs de volume,
tels que l'OBV, le Money Flow Index, l'A/D mais aussi le Volume Weighted Macd et bien d'autres.
J'ai donc écrit cet indicateur pour moi-même, je suis satisfait de son utilité, et j'ai donc décidé de le publier sur le marché.
Caractéristiques principales :
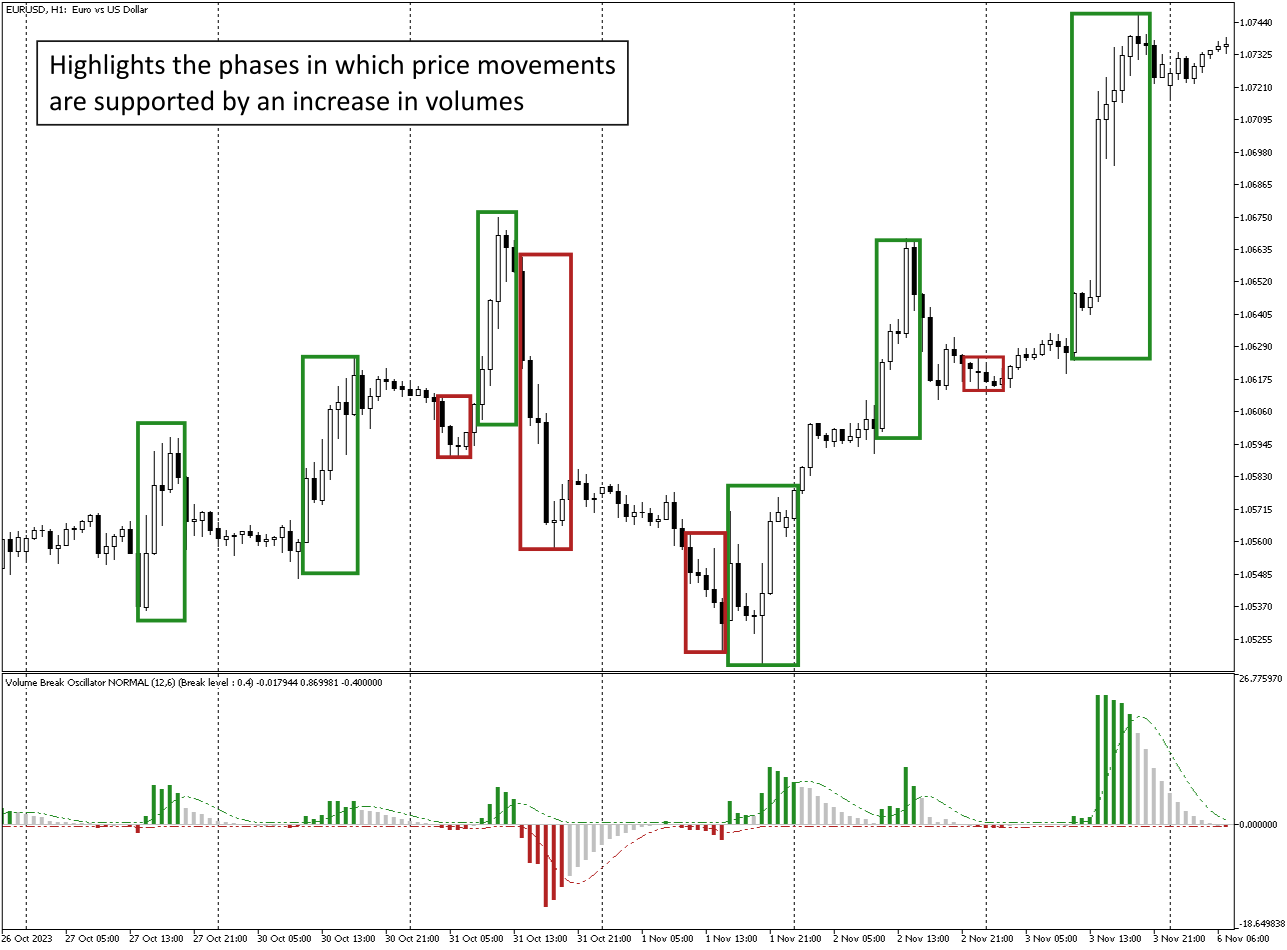
Il met en évidence les phases dans lesquelles le prix évolue dans une direction soutenue par une augmentation (rupture) des volumes.
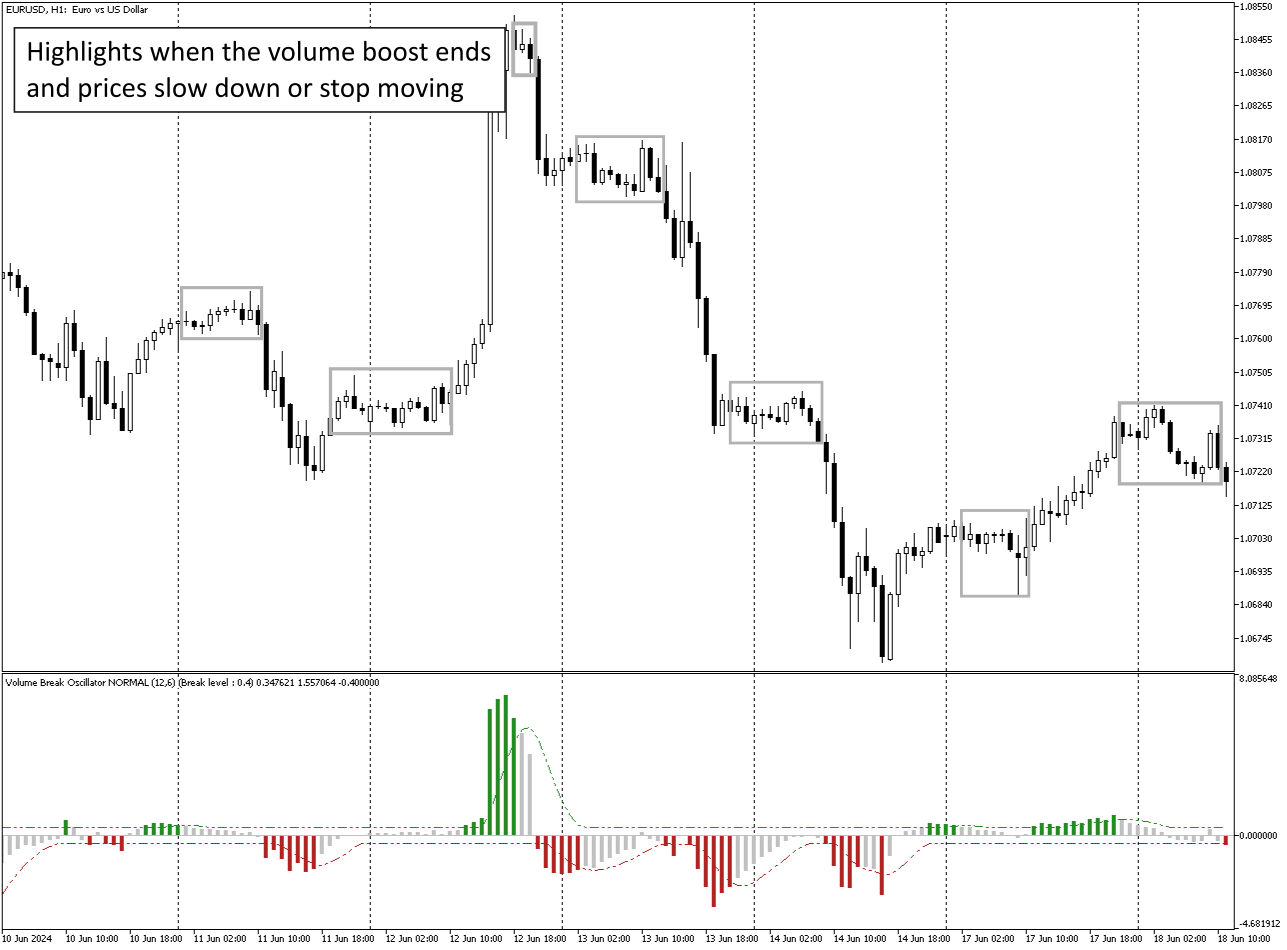
Il met en évidence les phases dans lesquelles l'augmentation du volume s'arrête et donc le marché se contracte.
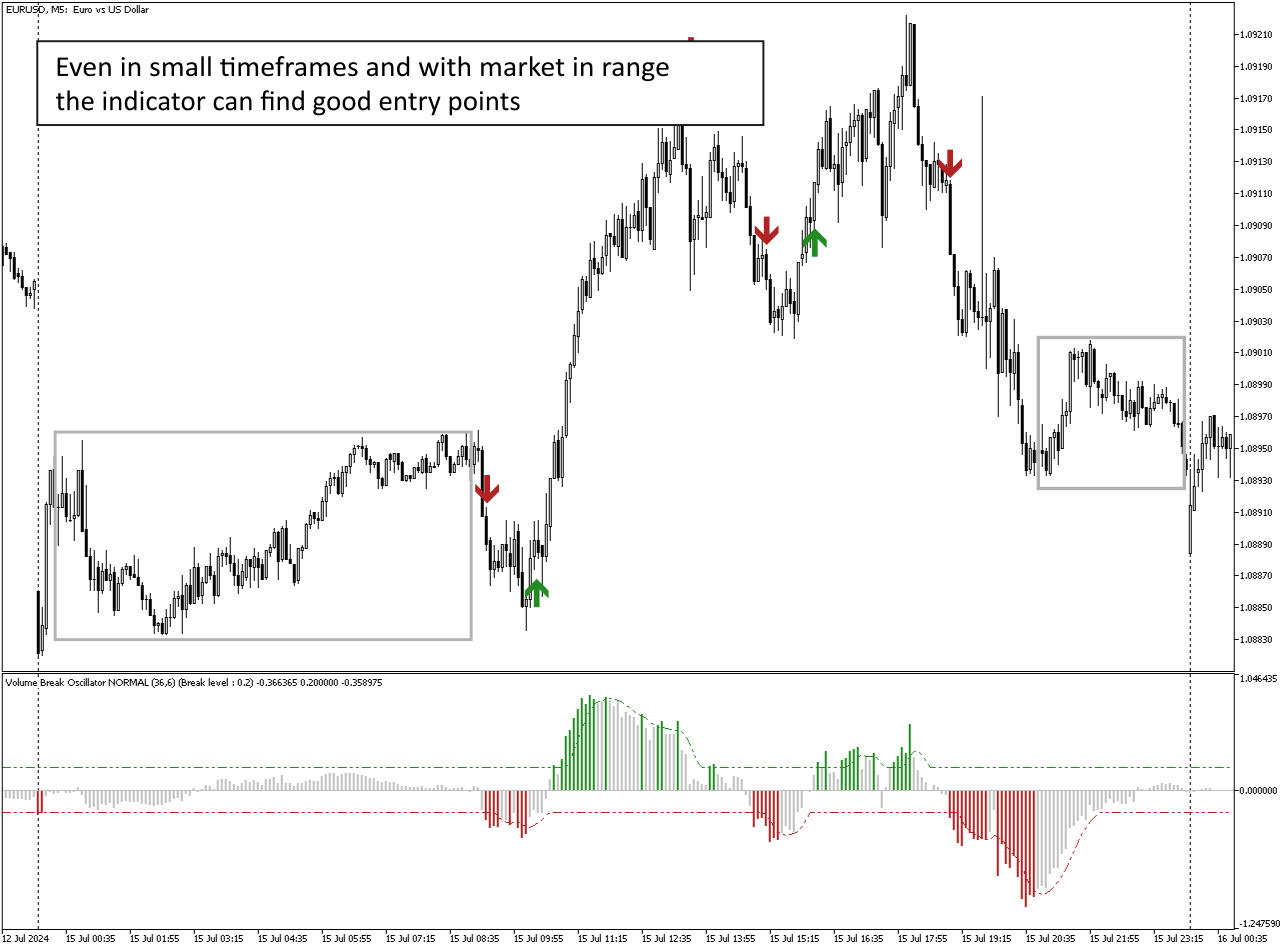
Il met en évidence les phases dans lesquelles, notamment dans le trading intraday avec des délais (<=15 minutes), ni les prix ni les volumes ne bougent, de sorte que le marché est prêt pour une course future.
Filtre les faux signaux provenant d'autres Expert Advisors lorsqu'ils ne sont pas soutenus par une augmentation des volumes.
Il permet de visualiser très facilement les phases de tendance et de range
Paramètres d'entrée :
Paramètres de calcul :
Type de calcul : RAPIDE, NORMAL, LENT, pour surveiller à court, moyen et long terme, en restant dans le même laps de temps.
Période de calcul : Période de calcul
Paramètres de volume :
Type de volume : TickVolume (principalement pour le Forex) et RealVolume (pour le marché boursier)
Paramètres de signal :
Période de signal : Période de ligne de signal
Niveau de rupture : Niveau de seuil pour le signal de rupture
Paramètres d'alerte
Type d'alerte : À la clôture de la barre ou instantanée
Alerte
Mail
Notification
Numéro de tampon à rappeler dans l'EA :
0 - Histogramme
1 - Break Line Up
2 - Break Line Down
Bon trading à tous !