Smart effective support and resistance levels
- Indicateurs
- Yu Fan Zhang
- Version: 1.0
- Activations: 8
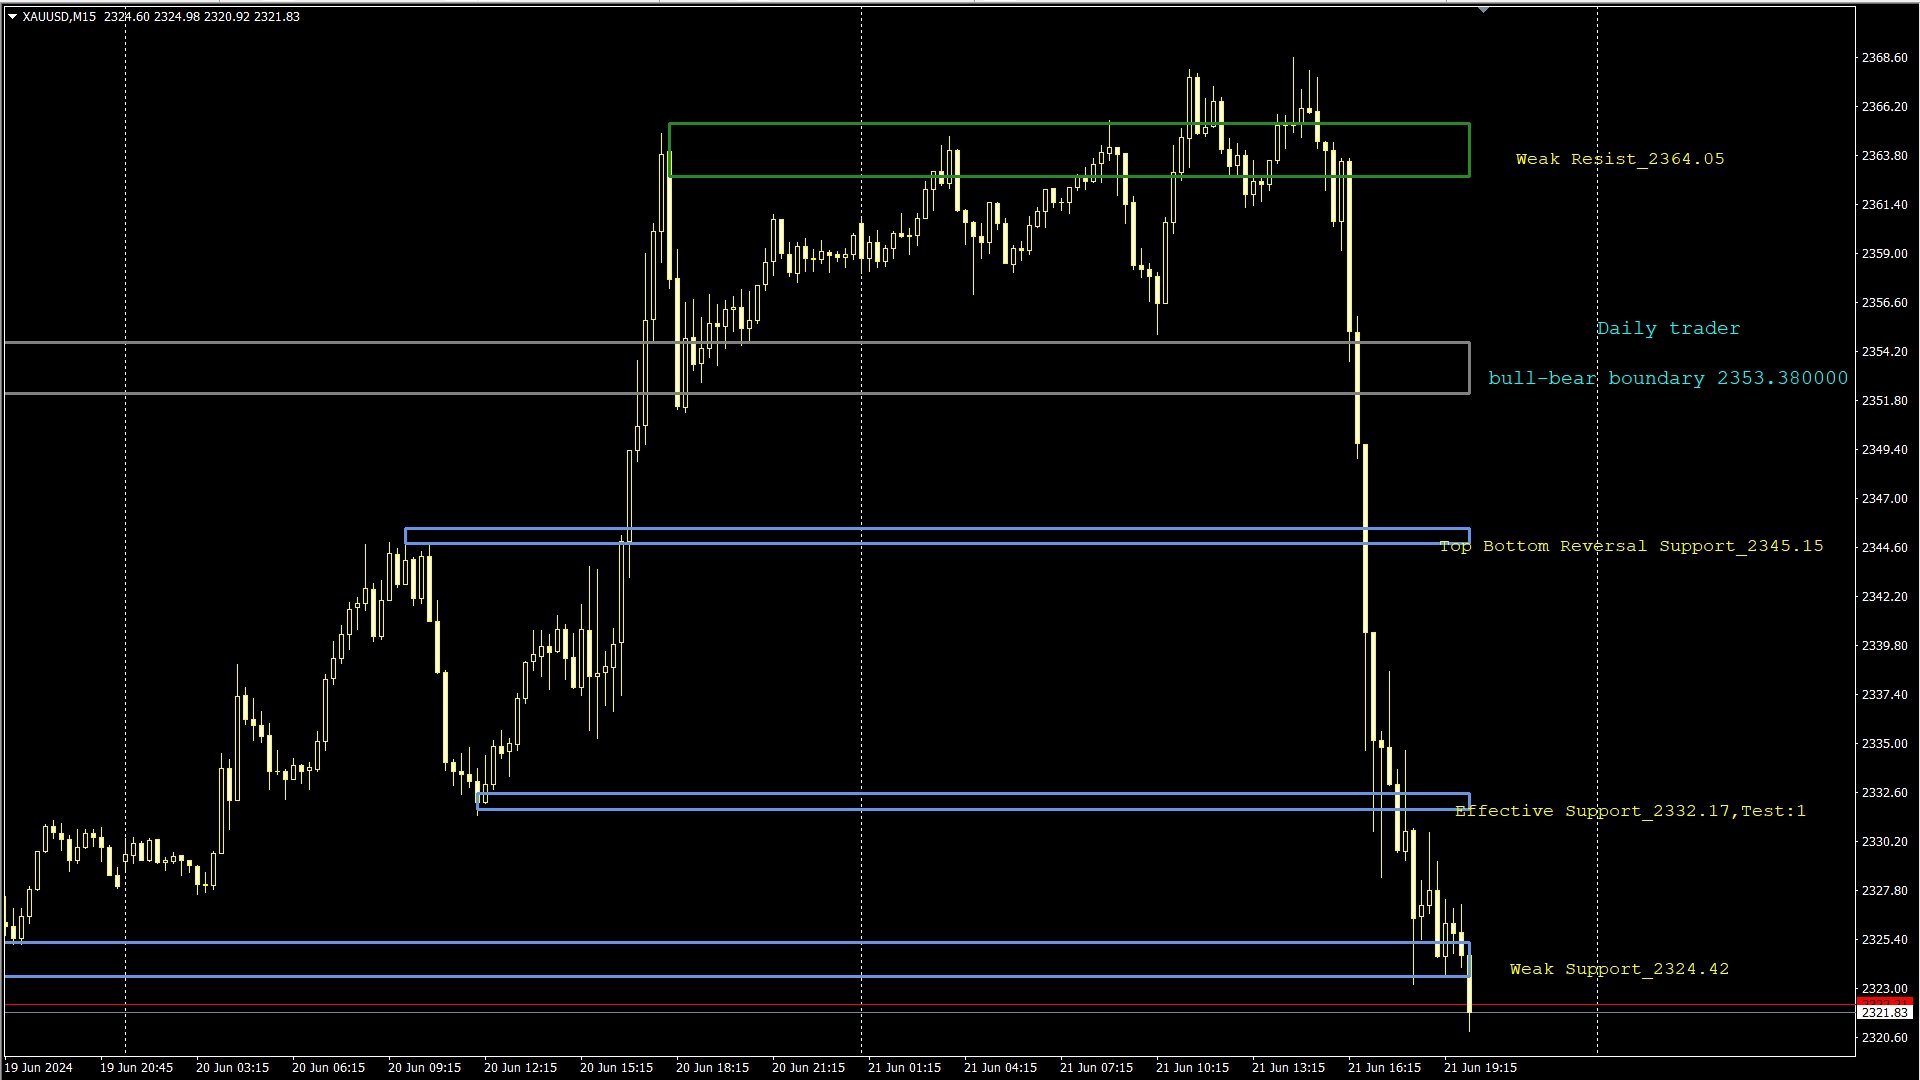
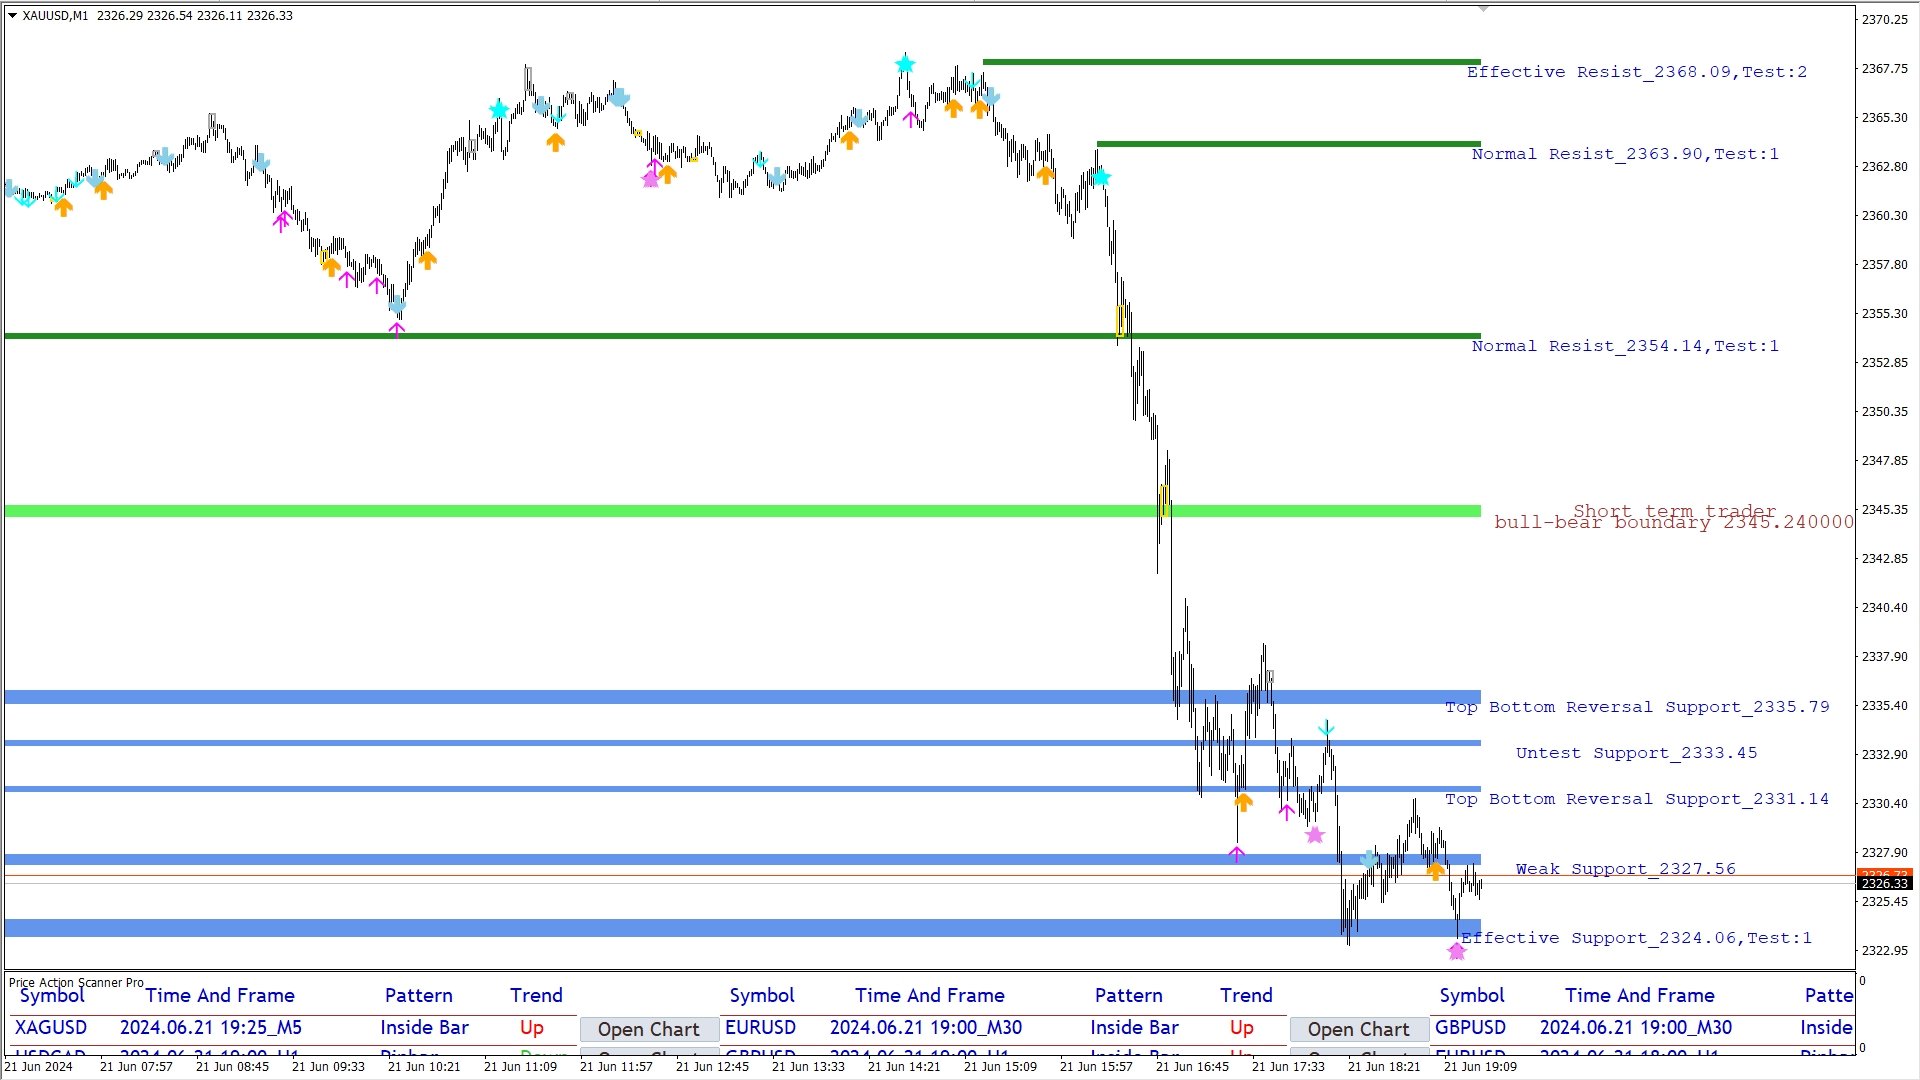
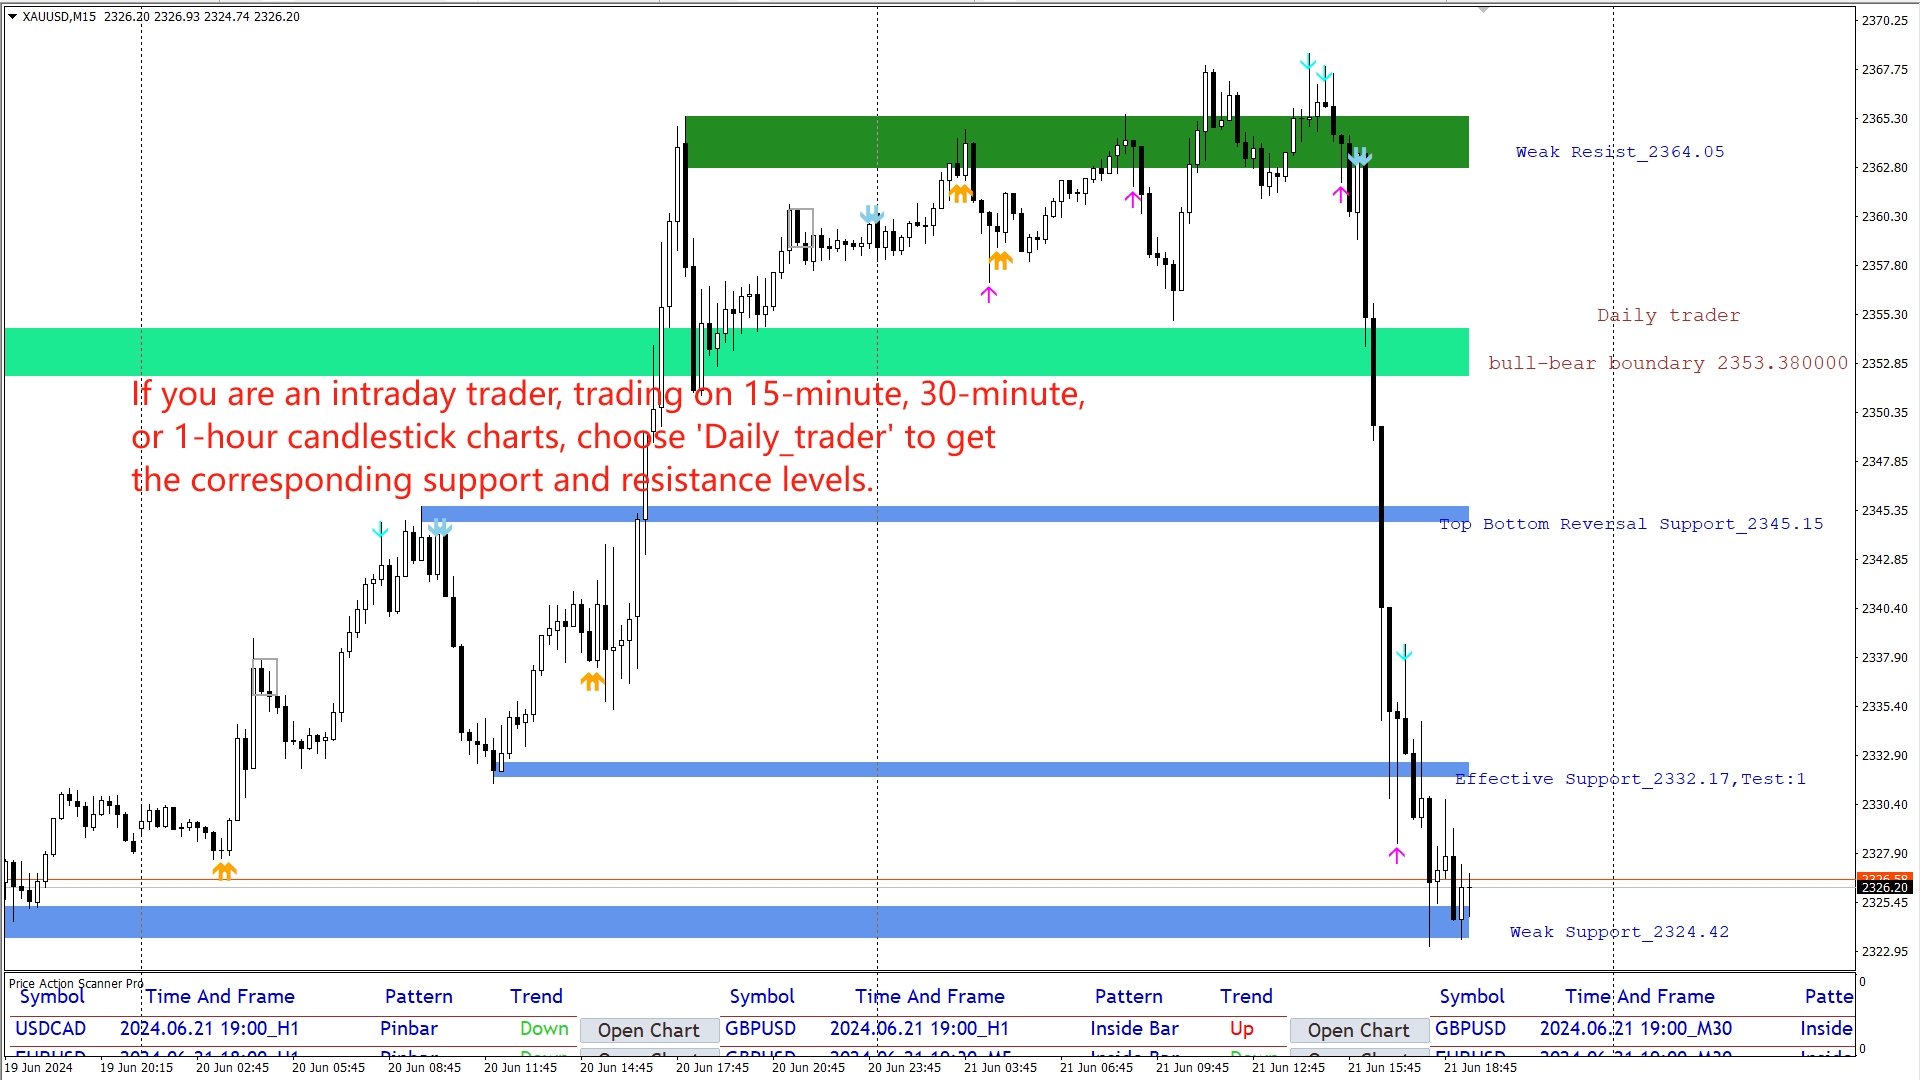
Support and Resistance Levels is an intelligent indicator that displays horizontal support and resistance levels, suitable for traders of different trading frequencies. You can select your preferred trading frequency, and the indicator will automatically calculate the support and resistance levels relevant to that frequency. Among these, the Bull-Bear Line is an interval used to distinguish the strength of bullish and bearish forces, and is an important level.
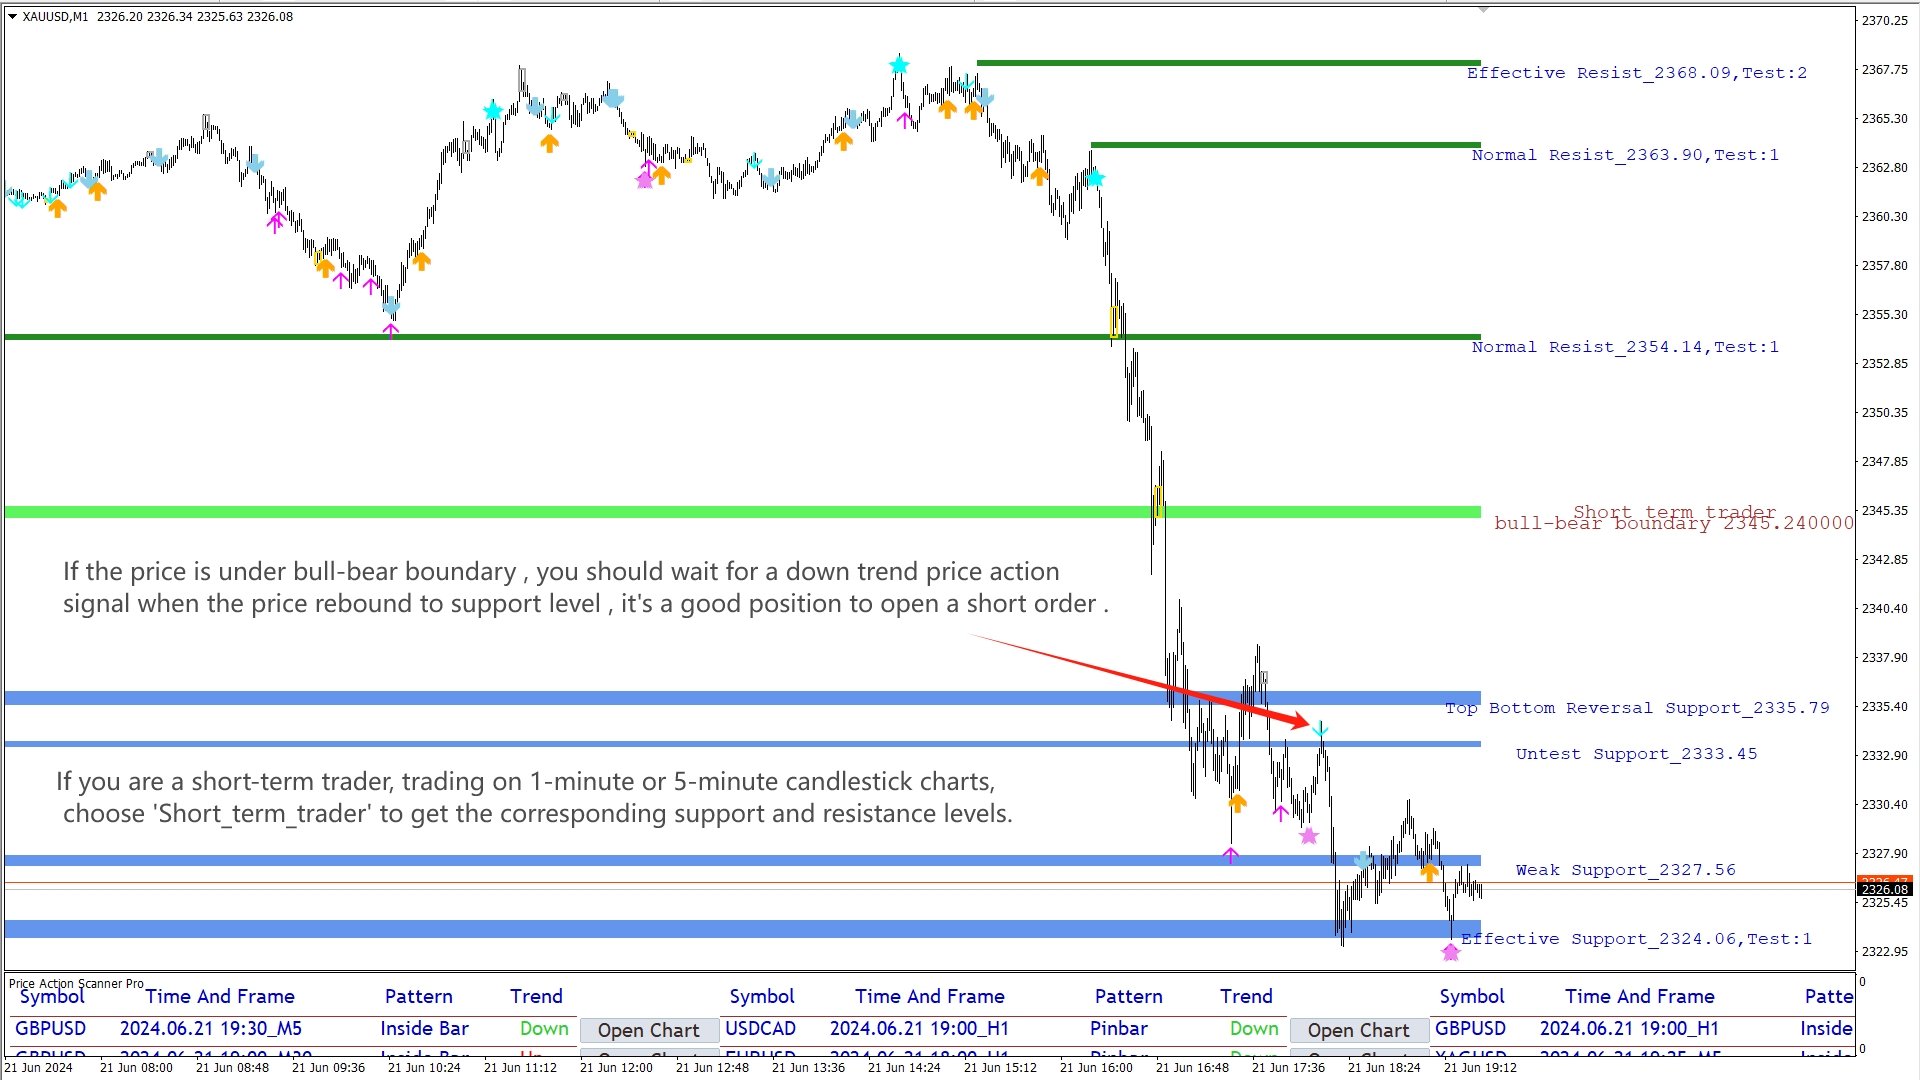
You can combine it with other indicators such as Fibonacci and price action. Buy at support levels, sell at resistance levels, or break through resistance levels to pursue long positions, and break below support levels to pursue short positions.
However, please note that these positions serve only as entry signals and do not necessarily indicate immediate opening of positions when price reaches these levels.
Parameter explanation:
Trading frequency: Choose according to your trading frequency and habits.
- If you are a short-term trader, looking for intraday opportunities or scalping, prefer to use price action on 1-minute or 5-minute candlestick charts as entry signals, choose Short_term_trader.
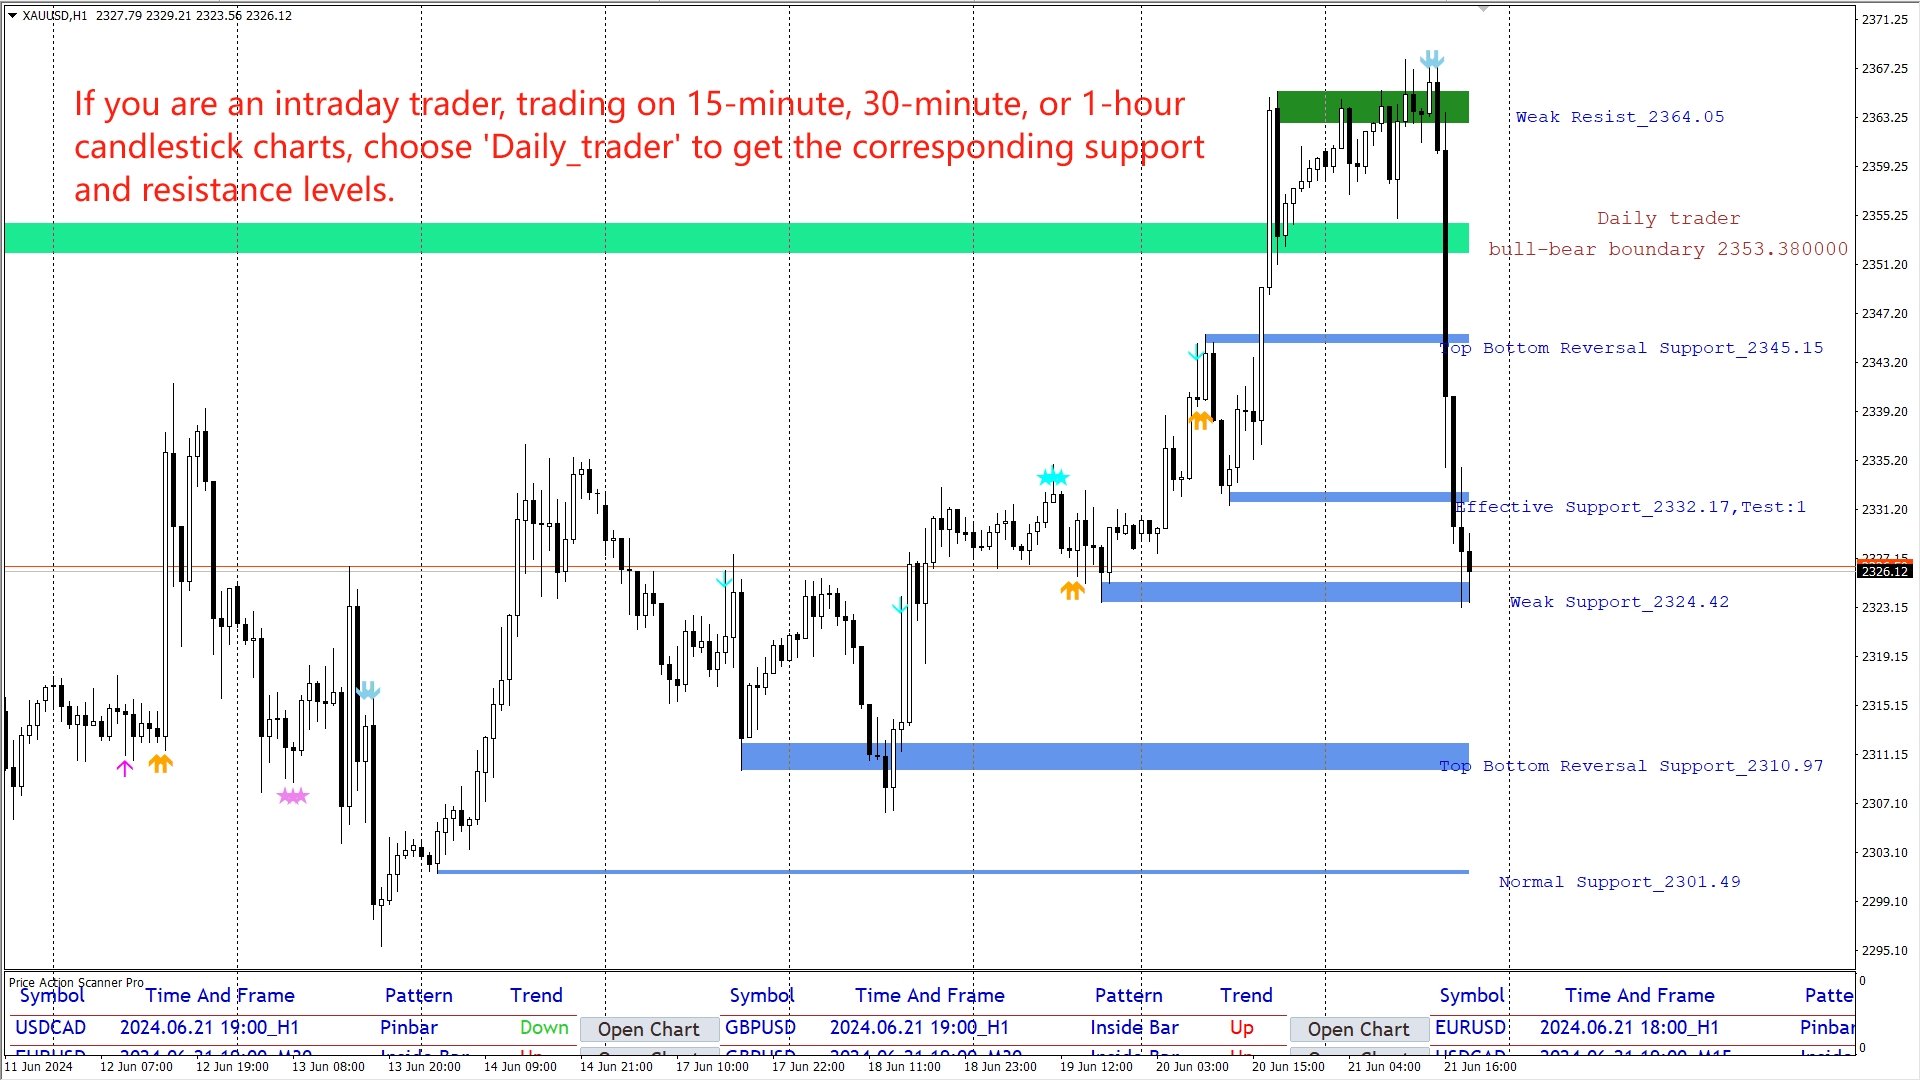
- If you are an intraday trader, looking for opportunities within the day and opening positions once or twice daily, prefer to use price action on 15-minute, 30-minute, and 1-hour candlestick charts as entry signals, choose Daily_trader.
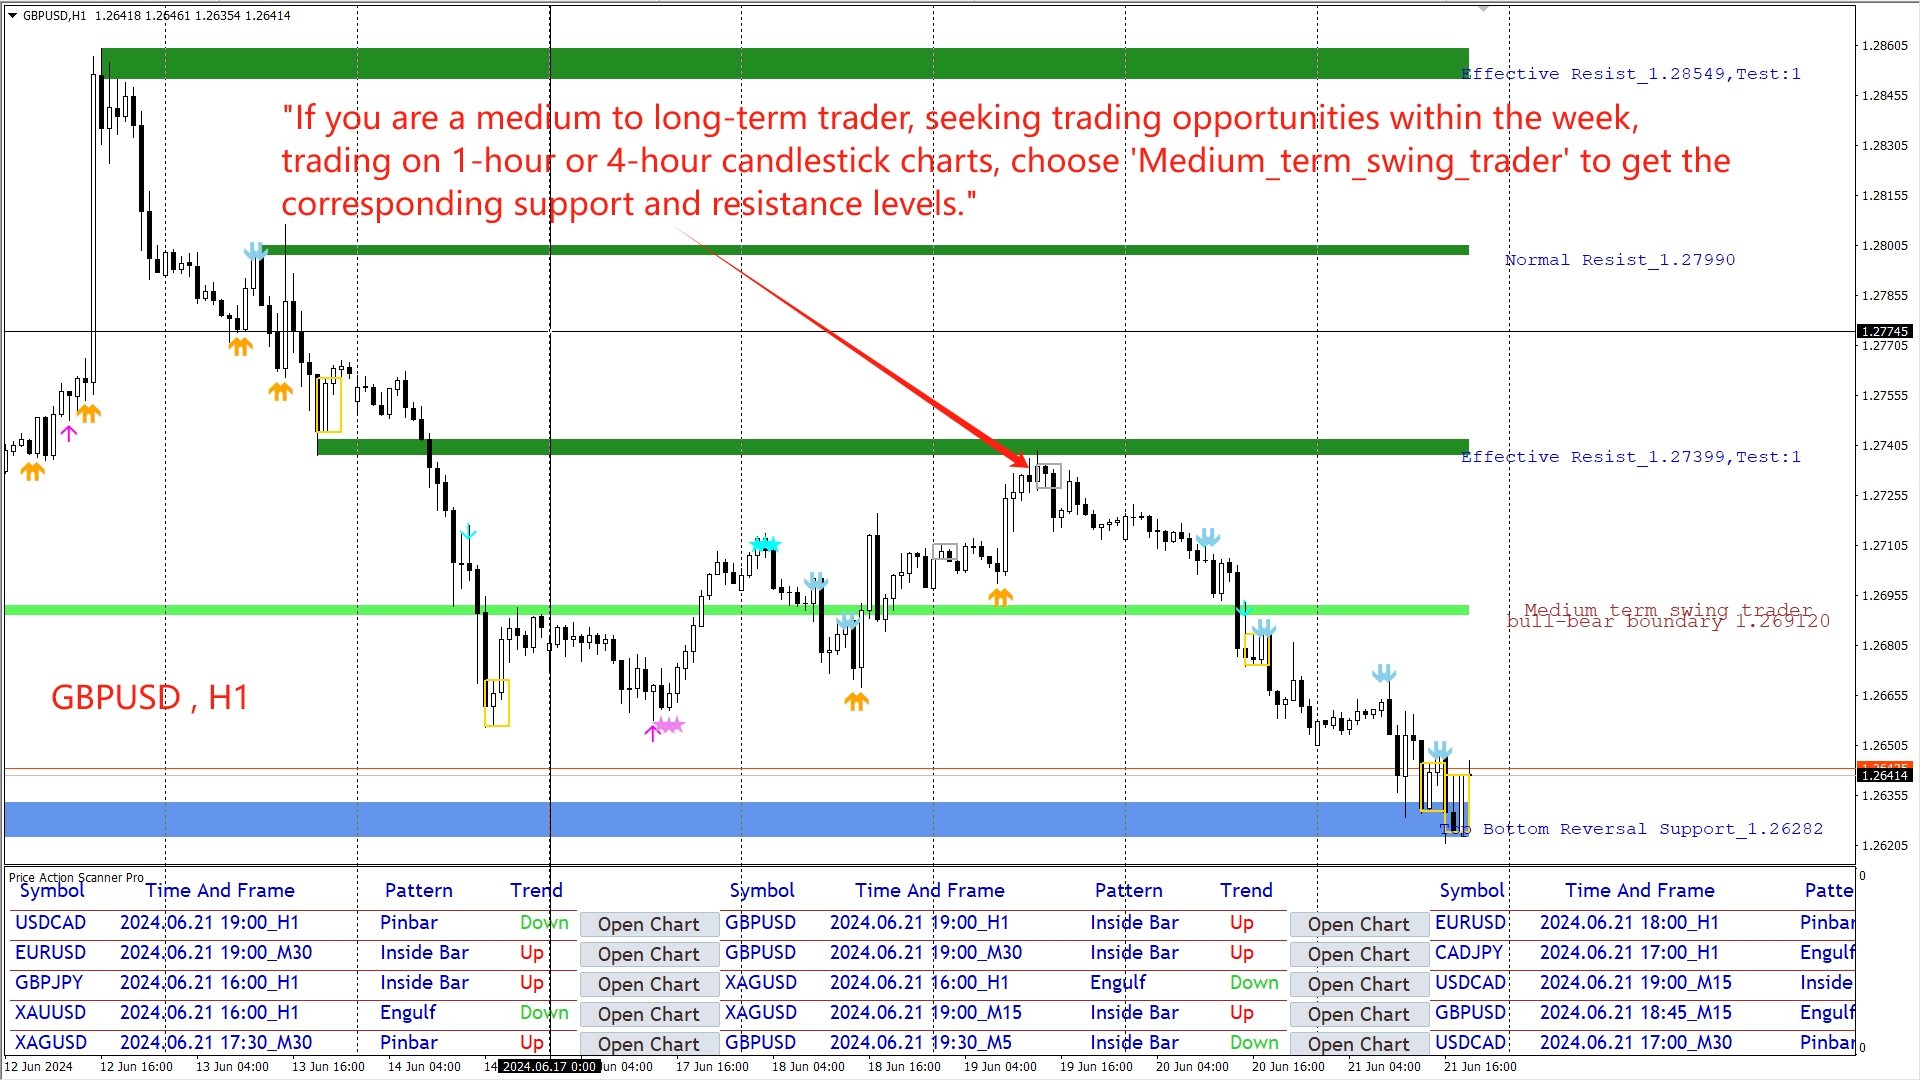
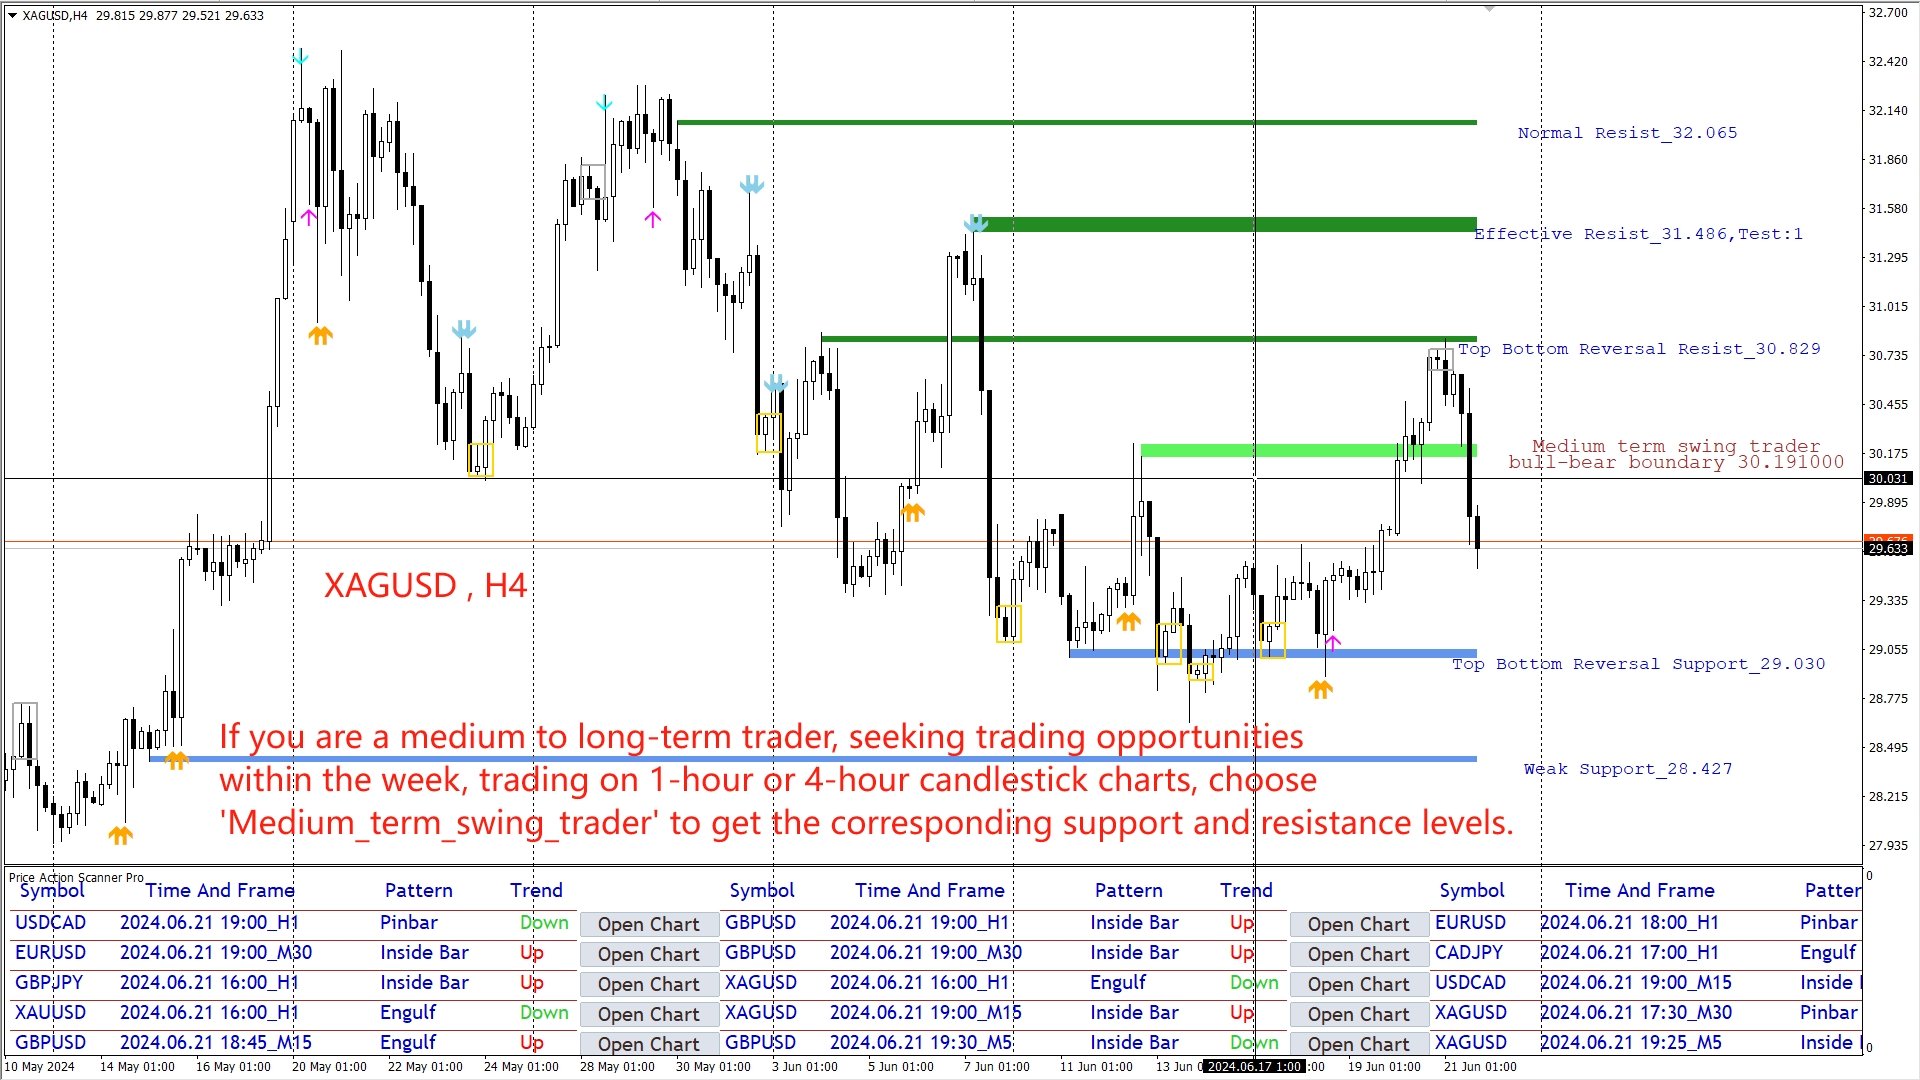
- If you are a medium to long-term swing trader, opening positions once or twice weekly, prefer to use price action on 1-hour or 4-hour candlestick charts as entry signals, choose Medium_term_swing_trader.
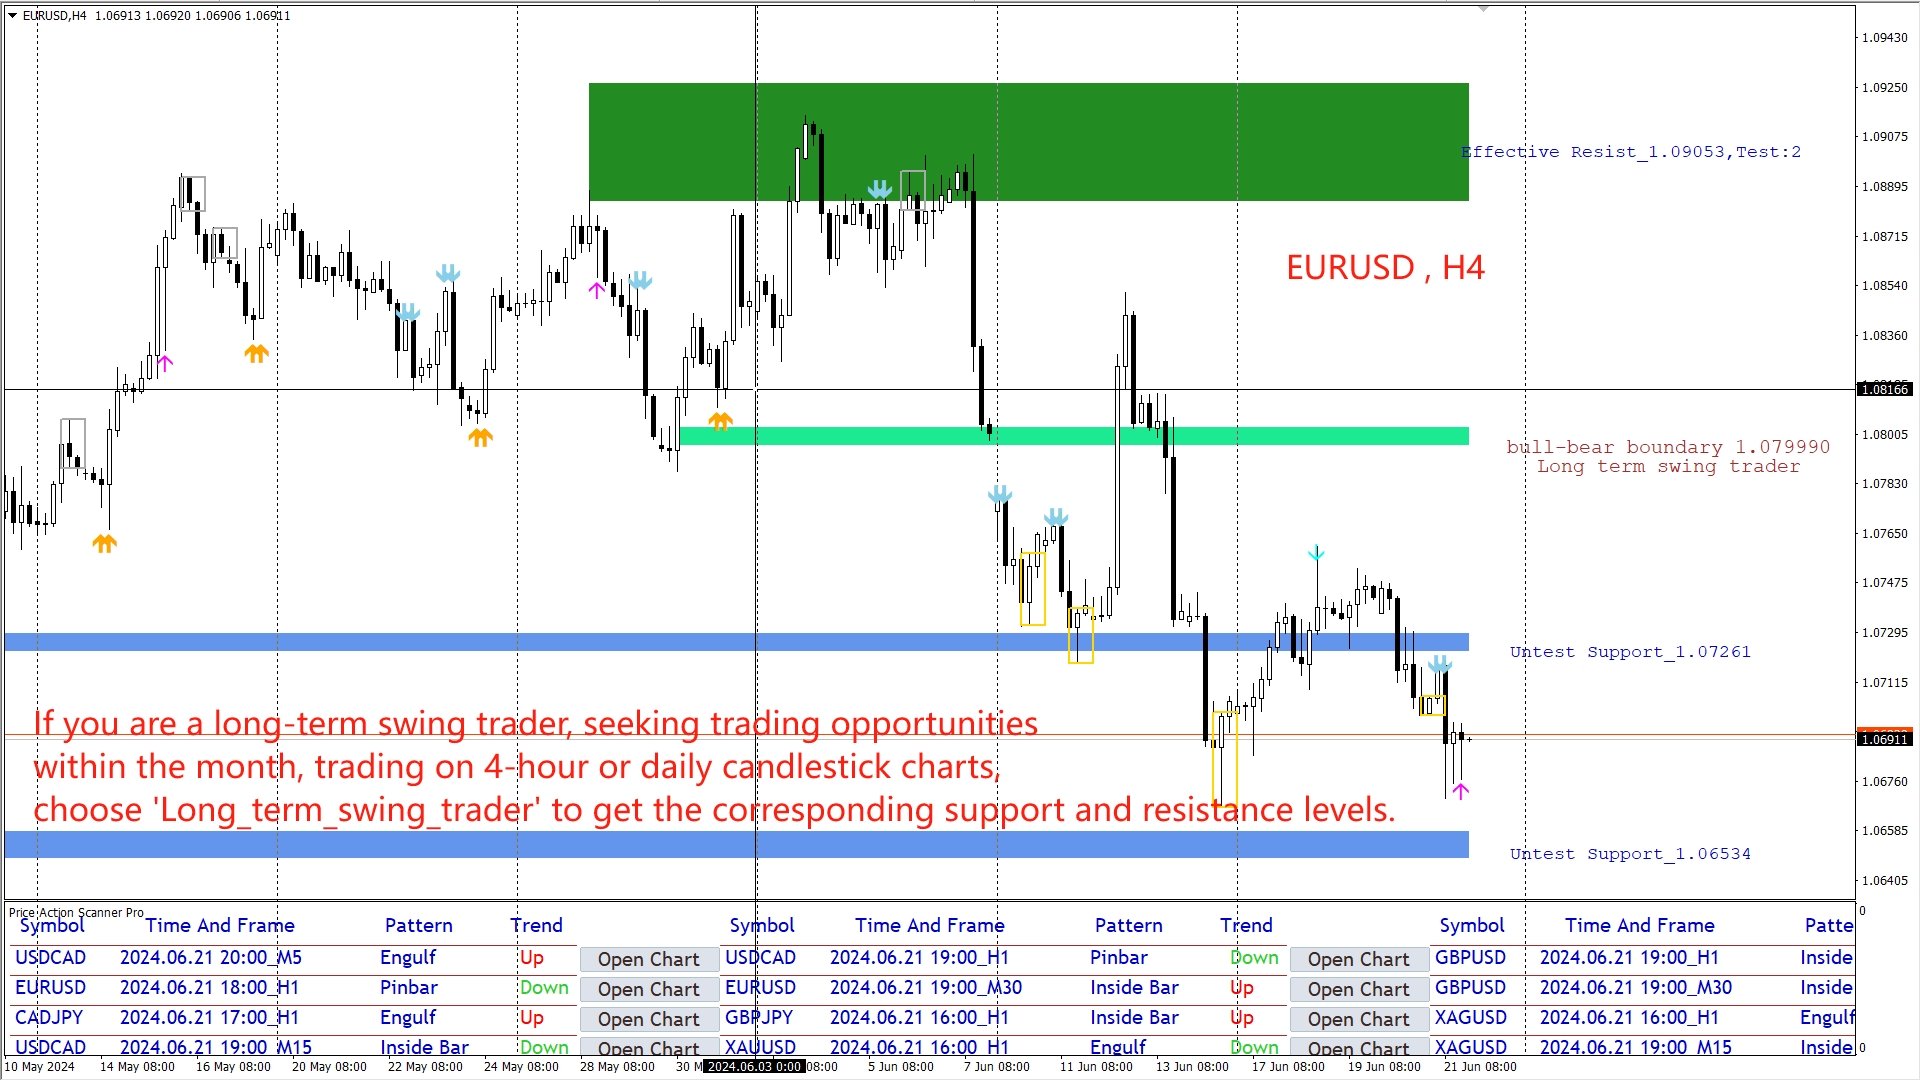
- If you are a long-term swing trader, opening positions once or twice monthly, prefer to use price action on 4-hour or daily candlestick charts as entry signals, choose Long_term_swing_trader.