• Aperçu
  • Avis (1)
  • Commentaires

Gold Indicator

5

This indicator uses horizontal lines to identify support and resistance levels based on Zigzag legs and On-Balance Volume (OBV) analysis. Here is a summary of how the indicator works:

  1. Resistance and Support Lines:

    • A horizontal line above the current price level indicates resistance.
    • A horizontal line below the current price level indicates support.
  2. Drawing Horizontal Lines:

    • Draw horizontal lines on every Zigzag leg within the last X legs, where X is a specified number (e.g., 10).
    • Only the most recent top and bottom legs are considered.
  3. Price Movements and OBV Validation:

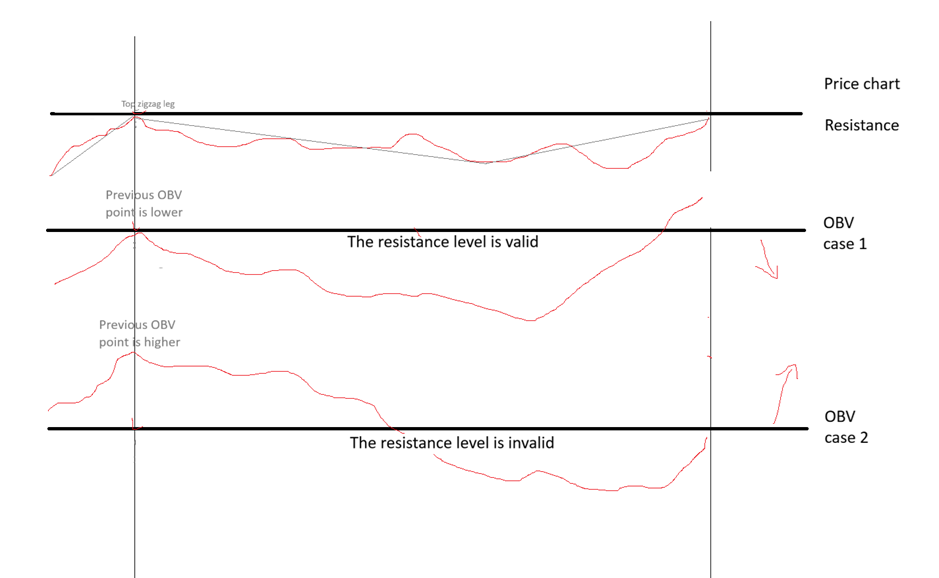
    • When the price rises:

      1. Identify a previous Zigzag upper leg above the current price level.
      2. Draw a horizontal line at the Zigzag leg and a vertical line connecting to the OBV window.
      3. Draw a horizontal line on the OBV window where the vertical line crosses.
      4. The horizontal line is solid if the current OBV is higher than the previous OBV, and dotted if lower.
    • When the price falls:

      1. Identify a previous Zigzag lower leg below the current price level.
      2. Follow similar steps to draw horizontal and vertical lines as above.
      3. The horizontal line is solid if the current OBV is higher than the previous OBV, and dotted if lower.
  4. Valid and Invalid Support/Resistance:

    • A valid support/resistance line is shown as a solid red line.
    • An invalid support/resistance line is shown as a dark dotted line, indicating it is easy to break.
  5. Chart Timeframe:

    • The indicator operates on the current chart timeframe.
    • If no Zigzag leg is found within the history limit, the indicator looks back in history until the most recent Zigzag leg is found.


Avis 1
Abraham Correa
2394
Abraham Correa 2024.06.23 03:21 
 

It seems to place the zigzag indicator into a subwindow which doesn't seem like much but it does seem vital. It bring detection of trends in price and would be personally be best to have another indicator join its activity. Good.

Produits recommandés
SR indicator
Alexander Chertnik
SR is a support and resistance indicator, it shows major highs and lows by different colors. The color of a level is changing if the last high or low are touching it. After the closing of a bar above or below level, it will delete it. extern inputs: loop for candles / colors / drawing time *This indicator signal is not perfect and have to be used with other market analysis and confirmations.
FREE
Double Price Channel   Price channel indicator for a certain number of bars specified in the settings. Indicator lines represent dynamic support or resistance levels. The upper limit is the price maximum for a certain number of periods, the lower one is the minimum. Unlike moving averages, which are based on close prices, the indicator is not “distracted” by small fluctuations. It will be recalculated only if the boundaries change. If the latter happens, then it is worth seriously thinking abou
FREE
Updates 9/12/2023 - If you are looking for the Spock EA, I don't sell it anymore. DM me for more info. 24/10/2023  -  Check out my other products. Starting to roll out some EAs & indicators based on this range. Currently there is no MT5 version. I am using MT4 myself. So I will spend my time mostly to develop more extensive stats for the Stats version and maybe even an EA. But I might  develop a MT5 version. All depends on the demand. Meaning, the more people request it, the bigger the
FREE
We Trade Live Trend Levels
Ian Andrew Nicholson
5 (4)
We Trade Live Trend Levels  This indicator is a fantastic addition to the We Trade Live Trend Max this helps filter out noise and helps with better entries into a trade this add on is a must have and we use it all the time along side We Trade Live Trend Max this is a fantastic tool to help with entering a trade and exiting a trade,  This indicator Calculates  Volume strength  indicating levels of support and resistance for a trade, measures momentum in a market making buying or selling into the
FREE
BeST_ Classic Pivot Points is an MT4 Indicator that is based on the widely known and definitely classic Pivot Point of a market prices activity. A pivot point is calculated as an average of significant prices (high,low,close) from the performance of a market in the prior trading period. If the market in the following period trades above the pivot point it is usually evaluated as a bullish sentiment, whereas trading below the pivot point is seen as bearish. A pivot point and the associated suppo
FREE
This is a Multi-Time-Frame Zigzag indicator You can change parameters of Zigzag, include Zigzag Depth, Zigzag Deviation, Zigzag Backstep. You can choose which Time Frame to display Zigzag by turn ShowXXX to true or false (ShowXXX = ShowM1, ShowM5, ShowM15...). Noted: Lower Time Frame Zigzag will not display on Higher Time Frame. Example: Your current Time Frame is H1, you can not see Zigzag of M1 to M30 even you turn them on.
This indicators automatically draws the   support and resistances   levels (key levels) for you once you've dropped it on a chart. It reduces the hustle of drawing and redrawing these levels every time you analyse prices on a chart. With it, all you have to do is drop it on a chart, adjust the settings to your liking and let the indicator do the rest. But wait, it gets better; the indicator is absolutely free! For more information:  https://youtu.be/rTxbPOBu3nY For more free stuff visit:  https
FREE
MQLTA Support Resistance Lines is an indicator that calculates the historical levels of Support and Resistance and display them as Lines on chart. It will also Alert you if the price is in a Safe or Dangerous zone to trade and show you the distance to the next level. The indicator is ideal to be used in other Expert Advisor through the iCustom function. This DEMO only works with AUDNZD, the full product can be found at https://www.mql5.com/en/market/product/26328 How does it work? The indicato
FREE
FRAMA macd 2 AM
Andriy Matviyevs'kyy
Technically, the indicator represents the difference between two fractal adaptive moving averages. Fractal Adaptive Moving Average (FRAMA) is a smart adaptive moving average developed by John Ehlers. FRAMA takes price changes into account and closely follows the price level, remaining straight during price fluctuations. FRAMA takes advantage of the fact that markets are fractal and dynamically adjusts the lookback period based on this fractal geometry. The indicator has the ability to send notif
FREE
MP Demark Pivot Levels
Pierre Ksachikian
4.5 (2)
This indicator is stand alone version from  MP Pivot Levels  (All in one) containing Demark's Pivots. Calculations:     PP = X / 4     R1 = X / 2 - LOWprev     S1 = X / 2 - HIGHprev Uses: When the pair currency price may change the direction of movement. Possible constraints of support and resistance that creates plateaus for the currency pair prices. Tendency identification by comparing the present prices according to current day's pivot point and also the prior day's pivot points. ___________
FREE
RSI Bands MT4
Pierce Vallieres
RSI Bands is a powerful indicator which displays an upper and lower band corresponding to the RSI overbought and oversold levels. The band shows what price must be reached during that specific candle in order for the RSI overbought/oversold level to be reached. This is an extremely useful tool for spotting when a trend has begun and when a trend is about to end. The indicator provides buffers, allowing you to use it in your own Expert Advisor. Please message me if you have any questions. CURRE
FREE
Grapic ByArrowTrend Pro
Truong Cong Truc
1 (1)
Indicator support for only: Entry Point to Trend Pro Link indicator  support   :   https://www.mql5.com/en/market/product/70867 Supports all currency pairs declared in the definition. Help investors do not need to open many charts. Notice the DEAL:  multiple time frames confluence   M15, H1, H4. Entry Point to Trend Pro The indicator helps investors to identify the earliest and perfect reversal point. Easy to make decision to trade with the trend   Price action trading. support resistance
FREE
The indicator uses the Chester W. Keltner's channel calculation method, modified by the well-known trader Linda Raschke. Due to the modification, the calculated channel contains a much more complete overview of the price movements, which allows increasing the probability of an accurate prediction of the upcoming price movement. Unlike the classic Keltner method, the base line of the channel is plotted based on the Exponential Moving Average, and the Average True Range is used to calculate the up
FREE
Major Support and Resistance Indicator
Ahmad Ar Abedalaziz Alazaizeh
5 (1)
This indicator filters the Zigzag indicator to calculate the main support and resistance levels. Variables minimum gap between peaks : is the distance (GAP) between the peaks of the Zigzag peaks sensitivity : Minimum number of nearby peaks look back: it means that it has to test the last 50 peaks in the Zigzag object name perfix: a prefix for level’s line name on chart
FREE
Ppr PA
Yury Emeliyanov
4.75 (4)
"Ppr PA" is a unique technical indicator created to identify "PPR" patterns on the currency charts of the MT4 trading platform. These patterns can indicate possible reversals or continuation of the trend, providing traders with valuable signals to enter the market. Features: Automatic PPR Detection:   The indicator automatically identifies and marks PPR patterns with arrows on the chart. Visual Signals:   Green and red arrows indicate the optimal points for buying and selling, respectively. A
FREE
Free automatic Fibonacci is an indicator that automatically plots a Fibonacci retracement based on the number of bars you select on the BarsToScan setting in the indicator. The Fibonacci is automatically updated in real time as new highest and lowest values appears amongst the selected bars. You can select which level values to be displayed in the indicator settings. You can also select the color of the levels thus enabling the trader to be able to attach the indicator several times with differe
FREE
LR Trigger AM
Andriy Matviyevs'kyy
This indicator displays linear regression data of financial instrument prices for two different periods. The user has the ability to select the prices at which the calculation is made. The position of the histogram above zero indicates an increase in prices. The location of the histogram below zero indicates a fall in prices. On fully formed chart bars, the indicator is not redrawn. At the same time, the indicator values ​​at 0 bar (the current bar, the bar that has not finished forming yet) may
FREE
Oscillator 5 35
Paul Bratby
1 (1)
5/35 Oscillator to be used with our Elliott Wave Indicator as part of the overall strategy on trading the 5th wave. The Elliott Wave Indicator Suite is designed around a simple but effective Swing Trading Strategy. The Indicator Suite is great for Stocks, Futures and Forex trading on multiple timeframes You can find the main Elliott Wave Indicator here  https://www.mql5.com/en/market/product/44034
FREE
Update:ver1.53 (2023/08/16) ・ Overview and required environment Generate a duplicate limit order reservation for manual orders or orders from other tools, etc. This is specialized to "simplify the ordering operation". For the analysis to decide ordering, please do your best by yourself, such as fishing for materials, deriving a rule of thumb, using other analysis tools and EA together, etc. Since version 1.28, the function of "automatically re-order after settlement" has been implemented. (This
FREE
TrendPlus
Sivakumar Subbaiya
4.21 (14)
Trend Plus   Trendplus  Indicator   Time Frame: Suitable for any time frame.  Purpose: Trend Prediction. Blue and red candle indicate the buy and sell call respectively. Buy: When the blue candle is formed buy call is initiated. close the buy trades when the next red candle will formed.   Sell: When the Red candle is formed Sell call is initiated. close the Sell trades when the next blue candle will formed.   Happy trade!!
FREE
Market Profile 3
Hussien Abdeltwab Hussien Ryad
4 (4)
Market Profile 3 MetaTrader 4 indicator  — is a classic Market Profile implementation that can show the price density over time, outlining the most important price levels, value area, and control value of a given trading session. This indicator can be attached to timeframes between M1 and D1 and will show the Market Profile for daily, weekly, monthly, or even intraday sessions. Lower timeframes offer higher precision. Higher timeframes are recommended for better visibility. It is also possible t
FREE
Trend arrow Indicator
NGUYEN NGHIEM DUY
3.23 (13)
Trend arrow Indicator is an arrow Indicator used as an assistant tool for your trading strategy. The indicator analyzes the standard deviation of bar close for a given period and generates a buy or sell signals if the deviation increases. It good to combo with Martingale EA to follow Trend and Sellect Buy Only/Sell Only for EA work Semi-Automatic. You can use this  Indicator with any EAs in my Products.
FREE
Индикатор реализован для определения классического канала движения цены, который используется на крупных биржевых площадках. Не перерисовывается Синий уровень - это уровень поддержки  Красный уровень - это уровень сопротивления  Белый уровень - является Pivot-уровнем  Настройки Period_SEC  - ввод  значения периода . Примечание:  Индикатор определяет уровни только на пятизначных котировках! Метод торговли:  Открытие позиций осуществляется от уровней , именно на их значениях происходит отскок цены
FREE
Pivot Point Fibo RSJ est un indicateur qui trace les lignes de support et de résistance de la journée en utilisant les taux de Fibonacci. Cet indicateur spectaculaire crée jusqu'à 7 niveaux de support et de résistance via Pivot Point en utilisant les taux de Fibonacci. C'est fantastique de voir comment les prix respectent chaque niveau de ce support et de cette résistance, où il est possible de percevoir les points d'entrée/sortie possibles d'une opération. Caractéristiques Jusqu'à 7 nive
FREE
Download the free version   here. Divergence Divergence refers to when the price of a currency pair moves in one direction while the trend indicator is moving in the opposite direction. With divergence, there can be positive and negative signals. Divergences in Forex trading are quite common signals of technical analysis. These are basic early Forex signals indicating the trend reversal and filter false signals. Application of this indicator It is usually not easy to detect divergences by the t
FREE
This indicator is stand alone version from  MP Pivot Levels  (All in one) containing Woodie Pivots. Woodie’s pivot points are made up of multiple key levels, calculated from past price points, in order to frame trades in a simplistic manner. The key levels include the ‘pivot’ itself, and multiple support and resistance levels (usually up to three each). Traders use these levels as a guide for future price movements when setting up trades. The pivot : (Previous high + previous low + 2 x previou
FREE
Are you tired of drawing trendlines every time you're analyzing charts? Or perhaps you would like more consistency in your technical analysis. Then this is for you. This indicator will draw trend lines automatically when dropped on a chart. How it works Works similar to standard deviation channel found on mt4 and mt5. It has 2 parameters: 1. Starting Bar 2. Number of bars for calculation The   starting bar   is the bar which drawing of the trend lines will begin, while the   number of bars for c
FREE
PZ Pivot Points
PZ TRADING SLU
4.64 (14)
This indicator displays pivot points in the chart, including historical vales, and supports many calculation modes for Pivot Points and S/R levels.  [ Installation Guide | Update Guide | Troubleshooting | FAQ | All Products ] It plots historical levels for backtesting purposes It allows you to select the reference timeframe It implements different Pivot Point calculation modes It implements different SR calculation modes It implements customizable colors and sizes Calculation Modes The indi
FREE
OrderBlock TS Roman
Vladislav Vlastovskii
3.88 (8)
Индикатор строит блоки заказов (БЗ) по торговой системе (ТС) Романа. Поиск блоков осуществляется одновременно на двух таймфремах: текущем и старшем (определяемым в настройках). Для оптимизации и игнорирования устаревших блоков в настройках задается ограничение количества дней в пределах которых осуществляется поиск блоков. Блоки строятся по правилам ТС состоящем из трех шагов: какую свечу вынесли (что?); какой свечой вынесли (чем?); правило отрисовки (как?).
FREE
This is a regression tree indicator for MT4/MT5. This indicator classificate nodes on the time period so that the deviation becomes smaller, and displays regression line and channel for each node. It's free! Attached CartDemo.ex4 and CartDemo.ex5 is a Demo version and has the following limitations: Method is RandomForest only Maximum number of bars is 200 Maximum number of trees is 2 Maximum tree depth is 2 Calculated waste lines are shown Not display correlation coefficients Fu
FREE
Les acheteurs de ce produit ont également acheté
Gann Made Easy
Oleg Rodin
4.87 (95)
Gann Made Easy est un système de trading Forex professionnel et facile à utiliser qui est basé sur les meilleurs principes de trading en utilisant la théorie de mr. WD Gann. L'indicateur fournit des signaux d'ACHAT et de VENTE précis, y compris les niveaux Stop Loss et Take Profit. Vous pouvez échanger même en déplacement en utilisant les notifications PUSH. S'il vous plaît contactez-moi après l'achat! Je partagerai avec vous mes astuces de trading et d'excellents indicateurs bonus gratuitement!
Gold Stuff
Vasiliy Strukov
4.9 (268)
Gold Stuff est un indicateur de tendance conçu spécifiquement pour l'or et peut également être utilisé sur n'importe quel instrument financier. L'indicateur ne se redessine pas et ne traîne pas. Délai recommandé H1. Au niveau de l'indicateur de travail, l'Expert Advisor EA Gold Stuff est entièrement automatique. Vous pouvez le trouver sur mon profil. Vous pouvez obtenir une copie gratuite de notre indicateur Strong Support et Trend Scanner, veuillez envoyer un message privé. moi! Contactez
Trend Pulse
Mohamed Hassan
5 (3)
Please contact me after purchase to immediately get your PDF strategy + documentation for Trend Pulse !  Official release price of $99  ( 17 / 50 copies left). Next price is $199 . Introducing Trend Pulse , a unique and robust indicator capable of detecting bullish, bearish, and even ranging trends! Trend Pulse uses a special algorithm to filter out market noise with real precision. If the current symbol is moving sideways, Trend Pulse will send you a ranging signal, letting you know that
Trend Punch
Mohamed Hassan
4.95 (21)
This indicator is unstoppable when combined with our other indicator called  Support & Resistance . After purchase, send us a message and you will get it   for  FREE as a BONUS! Introducing Trend Punch , the revolutionary forex trend indicator that will transform the way you trade! Trend Punch is uniquely designed to provide precise buy and sell arrows during strong market trends, making your trading decisions clearer and more confident. Whether you're trading major currency pairs or exotic sym
Scalper Inside PRO
Alexey Minkov
4.75 (60)
An exclusive indicator that utilizes an innovative algorithm to swiftly and accurately determine the market trend. The indicator automatically calculates opening, closing, and profit levels, providing detailed trading statistics. With these features, you can choose the most appropriate trading instrument for the current market conditions. Additionally, you can easily integrate your own arrow indicators into Scalper Inside Pro to quickly evaluate their statistics and profitability. Scalper Inside
FX Power MT4 NG
Daniel Stein
5 (12)
Obtenez votre mise à jour quotidienne du marché avec des détails et des captures d'écran via notre Morning Briefing ici sur mql5 et sur Telegram ! FX Power MT4 NG est la nouvelle génération de notre très populaire indicateur de force des devises, FX Power. Et qu'est-ce que ce compteur de force de nouvelle génération offre ? Tout ce que vous avez aimé de l'original FX Power PLUS Analyse de la force de l'OR/XAU Des résultats de calcul encore plus précis Périodes d'analyse configurables individuel
Currency Strength Wizard est un indicateur très puissant qui vous offre une solution tout-en-un pour un trading réussi. L'indicateur calcule la puissance de telle ou telle paire de devises en utilisant les données de toutes les devises sur plusieurs périodes. Ces données sont représentées sous la forme d'un indice de devise facile à utiliser et de lignes électriques de devise que vous pouvez utiliser pour voir la puissance de telle ou telle devise. Tout ce dont vous avez besoin est d'attacher l'
Atomic Analyst
Issam Kassas
5 (3)
Tout d'abord, il convient de souligner que cet indicateur de trading n'est ni repainting, ni redrawing et ne présente aucun délai, ce qui le rend idéal à la fois pour le trading manuel et automatisé. Manuel de l'utilisateur : réglages, entrées et stratégie. L'Analyste Atomique est un indicateur d'action sur les prix PA qui utilise la force et le momentum du prix pour trouver un meilleur avantage sur le marché. Équipé de filtres avancés qui aident à éliminer les bruits et les faux signaux, et à
VEUILLEZ LIRE LES INFORMATIONS CI-DESSOUS AVANT D'ACHETER LE PRODUIT! Apollo Pips PLUS SP est un produit unique! C'EST POUR CEUX QUI VEULENT OBTENIR MON NOUVEL INDICATEUR "APOLLO PIPS" PLUS BONUS "SUPER PACK" AVEC ACCÈS À TOUS MES INDICATEURS DE TRADING! En achetant le produit Apollo Pips PLUS SP, vous achetez en fait une toute nouvelle version de mon indicateur Apollo Pips. Cette version de l'indicateur dispose d'un algorithme amélioré et d'un paramètre facile à utiliser qui vous donne la possi
Tout d'abord, il convient de souligner que cet outil de trading est un indicateur non repeint, non redessiné et non retardé, ce qui le rend idéal pour le trading professionnel. Cours en ligne, manuel utilisateur et démonstration. L'indicateur Smart Price Action Concepts est un outil très puissant à la fois pour les nouveaux et les traders expérimentés. Il regroupe plus de 20 indicateurs utiles en un seul, combinant des idées de trading avancées telles que l'analyse du trader Inner Circle et les
ACTUELLEMENT 26% DE RÉDUCTION La meilleure solution pour tout débutant ou trader expert ! Cet indicateur est un outil de trading unique, de haute qualité et abordable car nous avons incorporé un certain nombre de caractéristiques exclusives et une nouvelle formule. Avec seulement UN graphique, vous pouvez lire la force de la devise pour 28 paires Forex ! Imaginez comment votre trading va s'améliorer parce que vous êtes capable de repérer le point de déclenchement exact d'une nouvelle tendan
M1 Arrow
Oleg Rodin
4.73 (15)
Une stratégie intraday basée sur deux principes fondamentaux du marché. L'algorithme est basé sur l'analyse des volumes et des vagues de prix à l'aide de filtres supplémentaires. L'algorithme intelligent de l'indicateur ne donne un signal que lorsque deux facteurs de marché se combinent en un seul. L'indicateur calcule les vagues d'une certaine plage sur le graphique M1 en utilisant les données de la période la plus élevée. Et pour confirmer la vague, l'indicateur utilise une analyse en volume.
TakePropips Donchian Trend Pro
Eric John Pajarillaga Aldana
4.61 (18)
TakePropips Donchian Trend Pro   (MT4) est un outil puissant et efficace qui détecte automatiquement la direction de la tendance à l'aide du canal Donchian et vous fournit des signaux de trading d'entrée et de sortie ! Cet indicateur multifonction comprend un scanner de tendance, des signaux de trading, un panneau statistique, un filtre, des sessions de trading et un tableau de bord de l'historique des alertes. Il est conçu pour vous fournir des signaux de trading et vous faire gagner des heures
TPSpro RFI Levels
Roman Podpora
4.83 (23)
Reversal First Impulse levels (RFI)    INSTRUCTIONS        RUS       -       ENG              R ecommended to use with an indicator   -   TPSpro  TREND PRO -  Version MT5 A key element in trading is zones or levels from which decisions to buy or sell a trading instrument are made. Despite attempts by major players to conceal their presence in the market, they inevitably leave traces. Our task was to learn how to identify these traces and interpret them correctly. Main functions: Displaying activ
TPSproTREND PrO
Roman Podpora
4.78 (18)
TPSpro TRENDPRO  - is a trend indicator that automatically analyzes the market and provides information about the trend and each of its changes, as well as giving signals for entering trades without redrawing! The indicator uses each candle, analyzing them separately. referring to different impulses - up or down impulse. Exact entry points into transactions for currencies, crypto, metals, stocks, indices!  -  Version MT5               DETAILED DESCRIPTION                R ecommended to use with
Trend Screener
STE S.S.COMPANY
4.82 (92)
Indicateur de tendance, solution unique révolutionnaire pour le trading et le filtrage des tendances avec toutes les fonctionnalités de tendance importantes intégrées dans un seul outil ! Il s'agit d'un indicateur multi-période et multi-devises 100 % non repeint qui peut être utilisé sur tous les symboles/instruments : forex, matières premières, crypto-monnaies, indices et actions. Trend Screener est un indicateur de suivi de tendance efficace qui fournit des signaux de tendance fléchés avec des
- Real price is 80$ - 50% Discount ( It is 39$ now ) Contact me for instruction, any questions! Introduction The breakout and retest strategy is traded support and resistance levels. it involves price breaking through a previous level.  The break and retest strategy is designed to help traders do two main things, the first is to avoid false breakouts. Many false breakouts start with a candlestick that breaks out of a level but ends with an immediate candlestick that brings the price back into t
Actuellement 20% de réduction ! La meilleure solution pour tout débutant ou trader expert ! Ce logiciel de tableau de bord fonctionne sur 28 paires de devises. Il est basé sur 2 de nos principaux indicateurs (Advanced Currency Strength 28 et Advanced Currency Impulse). Il donne un excellent aperçu de l'ensemble du marché Forex. Il montre les valeurs de l'Advanced Currency Strength, la vitesse de mouvement des devises et les signaux pour 28 paires de devises dans tous les (9) délais. Imagine
Présentation       Quantum Trend Sniper Indicator   , l'indicateur révolutionnaire MQL5 qui transforme la façon dont vous identifiez et négociez les inversions de tendance ! Développé par une équipe de traders expérimentés avec une expérience commerciale de plus de 13 ans,       Indicateur Quantum Trend Sniper       est conçu pour propulser votre parcours de trading vers de nouveaux sommets grâce à sa manière innovante d'identifier les inversions de tendance avec une précision extrêmement élevée
Ultimate Sniper Dashboard
Hispraise Chinedum Abraham
4.85 (27)
Prix réduit à 299 $ ! Les prix peuvent augmenter à l'avenir ! Lisez la description ci-dessous ! Meilleur système d'entrée pour le tableau de bord Ultimate Sniper : NIVEAUX DYNAMIQUES ULTIMES. (Veuillez consulter mes produits) L'Ultimate Sniper Dashboard fonctionne UNIQUEMENT sur les marchés en direct en raison des limites des tests multidevises de MT4. Voici l'Ultimate-Sniper Dashboard ! Notre meilleur produit qui contient à la fois HA-Sniper, MA-Sniper et de nombreux modes spéciaux. L'
BullsEye Signal NoRepaint
Martin Alejandro Bamonte
3 (2)
BullseyeSignal – NoRepaint est un signal qui, comme son nom l'indique, ne se repeint jamais en aucune circonstance. Le signal est émis sur la même bougie observée dans l'image. Il est idéal pour les marchés hautement volatils tels que le forex, les cryptomonnaies, les actions, les indices et les futures. Vous ne verrez qu'une flèche verte pour l'achat et une flèche rouge pour la vente, mais il y a de nombreux indicateurs qui travaillent ensemble en arrière-plan pour fournir une expérience de tra
RelicusRoad Pro
Relicus LLC
4.73 (141)
Maintenant 147 $ (augmentant à 499 $ après quelques mises à jour) - Comptes illimités (PCS ou Mac) Manuel d'utilisation RelicusRoad + Vidéos de formation + Accès au groupe Discord privé + Statut VIP UNE NOUVELLE FAÇON DE REGARDER LE MARCHÉ RelicusRoad est l'indicateur de trading le plus puissant au monde pour le forex, les contrats à terme, les crypto-monnaies, les actions et les indices, offrant aux traders toutes les informations et tous les outils dont ils ont besoin pour rester renta
How to use Pair Trading Station Pair Trading Station is recommended for H1 time frame and you can use it for any currency pairs. To generate buy and sell signal, follow few steps below to apply Pair Trading Station to your MetaTrader terminal. When you load Pair Trading Station on your chart, Pair Trading station will assess available historical data in your MetaTrader platforms for each currency pair. On your chart, the amount of historical data available will be displayed for each currency pai
XQ Indicator MetaTrader 4
Marzena Maria Szmit
3.67 (3)
Step into the realm of Forex trading with confidence and precision using XQ, a cutting-edge Forex indicator designed to elevate your trading game to unprecedented heights. Whether you're a seasoned trader or just stepping into the world of currency exchange,   XQ Forex Indicator   empowers you with the insights and signals needed to make informed trading decisions. The signal conditions are a combination of three indicators, and XQ Forex Indicator only display  medium and long-term trends . The
Introduction to X3 Chart Pattern Scanner X3 Cherart Pattern Scanner is the non-repainting and non-lagging indicator detecting X3 chart patterns including Harmonic pattern, Elliott Wave pattern, X3 patterns, and Japanese Candlestick patterns. Historical patterns match with signal patterns. Hence, you can readily develop the solid trading strategy in your chart. More importantly, this superb pattern scanner can detect the optimal pattern of its kind. In addition, you can switch on and off individu
Gold Buster M1 System est un système de trading professionnel pour les graphiques M1 sur la paire XAUUSD. Mais, malgré le fait que le système a été développé à l'origine exclusivement pour le commerce de l'or, le système peut également être utilisé avec d'autres paires de devises. Après l'achat, je vous donnerai une liste de paires de trading pouvant être utilisées avec le système en plus de XAUUSD, ce qui élargira vos possibilités d'utilisation de ce système. TOUS LES INDICATEURS DU SYSTÈME NE
Le profit de la structure du marché change à mesure que le prix s'inverse et recule. L'indicateur d'alerte d'inversion de la structure du marché identifie le moment où une tendance ou un mouvement de prix approche de l'épuisement et est prêt à s'inverser. Il vous avertit des changements dans la structure du marché qui se produisent généralement lorsqu'un renversement ou un recul majeur est sur le point de se produire. L'indicateur identifie initialement les cassures et la dynamique des prix,
Backtest and Read Overview before purchase. Chart patterns have been a topic of debate among traders; some believe they are reliable signalers, while others do not. Our Chart Patterns All-in-One indicator displays various chart patterns to help you test these theories for yourself. The profitability of these patterns is not a reflection of the indicator's effectiveness but rather an evaluation of the patterns themselves. The Chart Patterns All-in-One indicator is an excellent tool for visualizin
TopBottom Checker
Oleg Rodin
4.89 (9)
TopBottom Checker est un indicateur qui détermine les bas et les hauts du prix. L'indicateur peut être utilisé avec n'importe quelle paire de devises. L'indicateur fonctionne sur n'importe quel laps de temps de M1 à D1. L'indicateur peut être utilisé comme un système de trading autonome ou dans le cadre de tout système de trading que vous utilisez, car cet indicateur fonctionne avec les aspects du marché qui sont très importants pour absolument n'importe quelle stratégie. Les signaux indicateurs
Scalper Vault
Oleg Rodin
5 (29)
Scalper Vault est un système de scalpage professionnel qui vous fournit tout ce dont vous avez besoin pour un scalpage réussi. Cet indicateur est un système de trading complet qui peut être utilisé par les traders de forex et d'options binaires. Le délai recommandé est M5. Le système vous fournit des signaux fléchés précis dans le sens de la tendance. Il vous fournit également des signaux supérieurs et inférieurs et des niveaux de marché Gann. Les indicateurs fournissent tous les types d'alertes
Plus de l'auteur
Singles MT4
Ahmed Alaaeldin Abdulrahman Ahmed Elherzawi
Trailing Step, Trailing Stop and Stop Loss as we used see how Pro traders used to make consistent profit. Traders who prefer the Stop Loss and Trailing Step trading style can use this EA to power their trading strategy and leverage from the movement of the price towards the Take Profit line with the continuous movement of the SL line. What is special about this EA is that it will immediately open the next trade in the opposite direction once the price hits SL. The EA has a built-in News Filter,
Investment Castle Supply and Demand
Ahmed Alaaeldin Abdulrahman Ahmed Elherzawi
5 (4)
Supply and Demand indicator does not repaint as it counts the number of tests/retests occurred in the past x number of times. As a trader you need a path to be able to place your buy and sell trades such as: Supply and Demand, Falling & raising channels . Experienced trades will draw the key levels and channels around the timeframes. But, they will not be able to draw them on the small time frames as the price changes too frequent. This indicator is based on Shved supply and demand indicator, b
FREE
Chances
Ahmed Alaaeldin Abdulrahman Ahmed Elherzawi
5 (6)
The Investment Castle Chances indicator will show signals on the chart for entering a buy or sell trade. There are 2 types of signals for each direction as follows: Buy / Sell (Orange colored candlesticks) Strong Buy   (Green colored candlesticks)  / Strong Sell  (Red colored candlesticks) You may place a buy trade once you see the Buy arrow or vise versa, or you might prefer to wait for a further confirmation “Strong Buy” / “Strong Sell”. This indicator works best with the high time frames H1,
FREE
Investment Castle RSI Divergence MT5
Ahmed Alaaeldin Abdulrahman Ahmed Elherzawi
The RSI Divergence Indicator is a powerful tool designed to identify potential reversals in the market by spotting discrepancies between the Relative Strength Index (RSI) and price movement. Divergences can be a significant indication of an impending trend change, either from bullish to bearish or vice versa. This indicator is built for making the task of identifying potential trade opportunities more straightforward and efficient. Features: Automatic Detection:   The indicator scans the cha
FREE
Spots EA
Ahmed Alaaeldin Abdulrahman Ahmed Elherzawi
4 (1)
The Spots Expert Advisor is the automated trading bot was created using the Spots indicator based on the common candlestick patterns such as: engulfing, hanging man, doji etc. The main objective for creating this EA is to have a fully automated and low drawdown bot. I'm sharing the first set file on the website, please feel free to optimize it for other pairs and with your forex broker using the preset parameters.
Investment Castle Trend Lines
Ahmed Alaaeldin Abdulrahman Ahmed Elherzawi
5 (5)
All traders should know the trend before making their decision when placing the buy or sell orders. The first step always starts with  supply and demand ,   rising and falling channels , trend lines, engulfing candles etc. All the above contribute to what is called “Price Action” and that is the best and most reliable way in trading and catching the trend and making profits, without stress. The  Investment Castle Trend Line Indicator  will automatically draw the trend lines on the MT5 for you.
FREE
Investment Castle Indicator
Ahmed Alaaeldin Abdulrahman Ahmed Elherzawi
4.8 (5)
Investment Castle Indicator has the following features: 1.  Dictates the direction of the trend in different Timeframes . 2.   Shows the hit rate and winning rate on the chart. 3. This indicator does not repaint the chart. 4. This indicator is built-in the Support & Resistance based Investment Castle EA which works with Psychological Key Levels "Support & Resistance" Indicator.
FREE
Channels Indicator MT5
Ahmed Alaaeldin Abdulrahman Ahmed Elherzawi
4.8 (5)
Channels indicator does not repaint as its based on projecting the falling and raising channels. As a trader you need a path to be able to place your buy and sell trades such as: Supply and Demand , Falling & raising channels. Falling and raising channels can be in any time frame and also can be in all time frames at the same time and the price always flows within these channels. Experienced trades will draw the key levels and channels around the time frames. But, they will not be able to draw
FREE
Investment Castle RSI Divergence
Ahmed Alaaeldin Abdulrahman Ahmed Elherzawi
The RSI Divergence Indicator is a powerful tool designed to identify potential reversals in the market by spotting discrepancies between the Relative Strength Index (RSI) and price movement. Divergences can be a significant indication of an impending trend change, either from bullish to bearish or vice versa. This indicator is built for making the task of identifying potential trade opportunities more straightforward and efficient. Features: Automatic Detection: The indicator scans the chart
FREE
Spots
Ahmed Alaaeldin Abdulrahman Ahmed Elherzawi
The Spots Indicator can be used for Entering and Exiting your trades based on the common candlestick patterns such as: engulfing, hanging man, doji etc. It is designed to publish desktop and mobile notification every time a signal is triggered. However, it is worth noting that this indicator is recommended to be used with other indicator for confirming the entries. It is best to use it with the Investment Castle Trend Lines indicator  and the Supply and Demand indicator .
FREE
Investment Castle EA MT4
Ahmed Alaaeldin Abdulrahman Ahmed Elherzawi
4.5 (2)
Introducing the Investment Castle Expert Advisor - the ultimate trend-based trading tool that comes with built-in Investment Castle and Psychological Key Levels indicators. Whether you're a novice or a seasoned trader, this powerful tool will help you make informed decisions and maximize profits. Features: Automated Support and Resistance Key Levels: Say goodbye to manual chart analysis! Our AI-driven software automatically identifies key levels of support and resistance, allowing you to make s
Investment Castle Support and Resistance
Ahmed Alaaeldin Abdulrahman Ahmed Elherzawi
5 (5)
Investment Castle Support and Resistance Indicator has the following features: 1.  Dictates the direction of Buy or Sell trades based on Support and Resistance Levels automatically . 2.  Candles stick colors will change to Red for Sell and Blue for Buy (Default settings, user can change from the inputs). 3. This indicator is built-in the Support & Resistance based Investment Castle EA which works with Psychological Key Levels "Support & Resistance".
FREE
Investment Castle Trend Lines MT4
Ahmed Alaaeldin Abdulrahman Ahmed Elherzawi
5 (3)
All traders should know the trend before making their decision when placing the buy or sell orders. The first step always starts with  supply and demand , rising and falling channels , trend lines, engulfing candles etc. All the above contribute to what is called “Price Action” and that is the best and most reliable way in trading and catching the trend and making profits, without stress. The  Investment Castle Trend Line Indicator  will automatically draw the trend lines on the MT4 for you. An
FREE
Investment Castle II MT4
Ahmed Alaaeldin Abdulrahman Ahmed Elherzawi
5 (1)
The Investment castle II ea trading robot has a variety of features, including: The ability to remember open positions, their take profit and stop loss levels if the VPS or terminal is restarted. The ability to remember trade buttons and their setup if the VPS or terminal is restarted. The ability to plot profit/loss on a chart, but only when the user runs the visualizer and on live charts. It automatically disables this feature when backtesting or optimizing settings for improved speed and perf
Chances MT4
Ahmed Alaaeldin Abdulrahman Ahmed Elherzawi
5 (2)
The Investment Castle Chances indicator will show signals on the chart for entering a buy or sell trade. There are 2 types of signals for each direction as follows: Buy / Sell (Orange colored candlesticks) Strong Buy (Green colored candlesticks)  / Strong Sell  (Red colored candlesticks) You may place a buy trade once you see the Buy arrow or vise versa, or you might prefer to wait for a further confirmation “Strong Buy” / “Strong Sell”. This indicator works best with the high time frames H1, H
FREE
Investment Castle Indicator MT4
Ahmed Alaaeldin Abdulrahman Ahmed Elherzawi
4.89 (9)
Investment Castle Indicator has the following features: 1.  Dictates the direction of the trend in different Timeframes . 2.   Shows the hit rate and winning rate on the chart. 3. This indicator does not repaint the chart. 4. This indicator is built-in the Support & Resistance based Investment Castle EA which works with   Psychological Key Levels "Support & Resistance" Indicator.
FREE
Investment Castle Engulfing
Ahmed Alaaeldin Abdulrahman Ahmed Elherzawi
4.5 (2)
Whether you are a scalper or daily trader, you will always look for bullish / bearish engulfing candles. This can be a bit tricky and stressful when you try to visually identify the engulfing candles on the chart. Not only that, you might be trading on the M15 time frame but the engulfing candle is forming or has already formed in the H4 time frame. This indicator is made to do that on your behalf. You can trade on any time frame and see Engulfing candles of another time frame, this means that
FREE
Investment Castle Supply and Demand MT4
Ahmed Alaaeldin Abdulrahman Ahmed Elherzawi
Supply and Demand indicator does not repaint as it counts the number of tests/retests occurred in the past x number of times. As a trader you need a path to be able to place your buy and sell trades such as: Supply and Demand, Falling & raising channels . Experienced trades will draw the key levels and channels around the timeframes. But, they will not be able to draw them on the small time frames as the price changes too frequent. This indicator is based on Shved supply and demand indicator, b
FREE
Investment Castle Support and Resistance MT4
Ahmed Alaaeldin Abdulrahman Ahmed Elherzawi
4.71 (7)
Investment Castle Support and Resistance Indicator has the following features: 1.  Dictates the direction of Buy or Sell trades based on Support and Resistance Levels automatically . 2.  Candles stick colors will change to Red for Sell and Blue for Buy (Default settings, user can change from the inputs). 3. This indicator is built-in the Support & Resistance based Investment Castle EA which works with Psychological Key Levels "Support & Resistance".
FREE
Investment Castle Volatility Index
Ahmed Alaaeldin Abdulrahman Ahmed Elherzawi
5 (2)
Investment Castle Volatility Index has the following features: 1. This indicator shows the volumes of the current symbol and the market volatility. 2. This indicator is built-in in the Investment Castle EA which works as volatility index for the EA dynamic distance and opposite start. 3. Parameters available for optimization for each pairs. 4. Works with any chart.
FREE
Spots MT4
Ahmed Alaaeldin Abdulrahman Ahmed Elherzawi
The Spots Indicator can be used for Entering and Exiting your trades based on the common candlestick patterns such as: engulfing, hanging man, doji etc. It is designed to publish desktop and mobile notification every time a signal is triggered. However, it is worth noting that this indicator is recommended to be used with other indicator for confirming the entries. It is best to use it with the   Investment Castle Trend Lines indicator  and the   Supply and Demand indicator
FREE
Investment Castle News
Ahmed Alaaeldin Abdulrahman Ahmed Elherzawi
Investment Castle News Indicator will plot vertical lines before the news on the chart and categorized in three different colors in accordance with the news importance. You can choose to limit the news to the current chosen symbol or show all future news on the same chart. High impact news is marked in Red lines be default. Medium impact news is marked in Orange lines be default. Low impact news is marked in Yellow lines be default.
FREE
Channels Indicator
Ahmed Alaaeldin Abdulrahman Ahmed Elherzawi
4 (1)
Channels indicator does not repaint as its based on projecting the falling and raising channels. As a trader you need a path to be able to place your buy and sell trades such as: Supply  and Demand , Falling & raising channels. Falling and raising channels can be in any time frame and also can be in all time frames at the same time and the price always flows within these channels. Experienced trades will draw the key levels and channels around the timeframes. But, they will not be able to draw
FREE
The Panel MT4
Ahmed Alaaeldin Abdulrahman Ahmed Elherzawi
The Panel will read the floating profit/loss for the symbol of your chart and will plot the profit/loss numbers on the chart. It will work with manual trades or trades made by any expert advisor. The Panel shows the Max Drawdown in the base currency, floating profit/loss for both buy and sell orders. It will also show the same in Pips. The Panel is movable on the chart, so you can drag it using the mouse cursor.
FREE
Ultimate
Ahmed Alaaeldin Abdulrahman Ahmed Elherzawi
4 (1)
Dashboard, TP line and Profit/Loss labels are set to false by default for speeding up the optimization. Switch them to True before you start. There are many strategies inside this EA as follows: - Entry based on indicator signal "as shown on the trend indicator " - Opposite to trade entry with opposite martingale - Entries based on " support and resistance indicator ". - Normal martingale - Normal martingale with distance multiplier - Normal martingale with volatility index - Opposite martingal
Investment Castle Engulfing MT4
Ahmed Alaaeldin Abdulrahman Ahmed Elherzawi
Whether you are a scalper or daily trader, you will always look for bullish / bearish engulfing candles. This can be a bit tricky and stressful when you try to visually identify the engulfing candles on the chart. Not only that, you might be trading on the M15 time frame but the engulfing candle is forming or has already formed in the H4 time frame. This indicator is made to do that on your behalf. You can trade on any time frame and see Engulfing candles of another time frame, this means that y
FREE
Investment Castle Volatility Index MT4
Ahmed Alaaeldin Abdulrahman Ahmed Elherzawi
3.67 (3)
Investment Castle Volatility Index has the following features: 1. This indicator shows the volumes of the current symbol and the market volatility. 2. This indicator is built-in in the Investment Castle EA which works as volatility index for the EA dynamic distance and opposite start. 3. Parameters available for optimization for each pairs. 4. Works with any chart.
FREE
The Panel
Ahmed Alaaeldin Abdulrahman Ahmed Elherzawi
The Panel will read the floating profit/loss for the symbol of your chart and will plot the profit/loss numbers on the chart. It will work with manual trades or trades made by any expert advisor. The Panel shows the Max Drawdown in the base currency, floating profit/loss for both buy and sell orders. It will also show the same in Pips. The Panel is movable on the chart, so you can drag it using the mouse cursor.
FREE
Investment Castle Legacy MT4
Ahmed Alaaeldin Abdulrahman Ahmed Elherzawi
5 (3)
Investment Castle Legacy Expert Advisor is a trend-based Expert Advisor that uses a built-in   Investment Castle indicator & Manual Buy / Sell Zones. Investment Castle   Legacy  EA has the following features: Volatility Index Integration for automating the Distance Reversed Martingale Strategy Auto enable / disable before the News and set the resumption after the news with option to stop and recover. Manual orders to contribute to the open series. If there are two series, the one in higher loss
Ultimate MT4
Ahmed Alaaeldin Abdulrahman Ahmed Elherzawi
5 (1)
Dashboard, TP line and Profit/Loss labels are set to false by default for speeding up the optimization. Switch them to True before you start. There are many strategies inside this EA as follows: - Entry based on indicator signal "as shown on the   trend indicator " - Opposite to trade entry with opposite martingale - Entries based on " support and resistance indicator ". - Normal martingale - Normal martingale with distance multiplier - Normal martingale with volatility index - Opposite marting
Filtrer:
Abraham Correa
2394
Abraham Correa 2024.06.23 03:21 
 

It seems to place the zigzag indicator into a subwindow which doesn't seem like much but it does seem vital. It bring detection of trends in price and would be personally be best to have another indicator join its activity. Good.

Répondre à l'avis