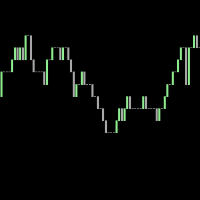
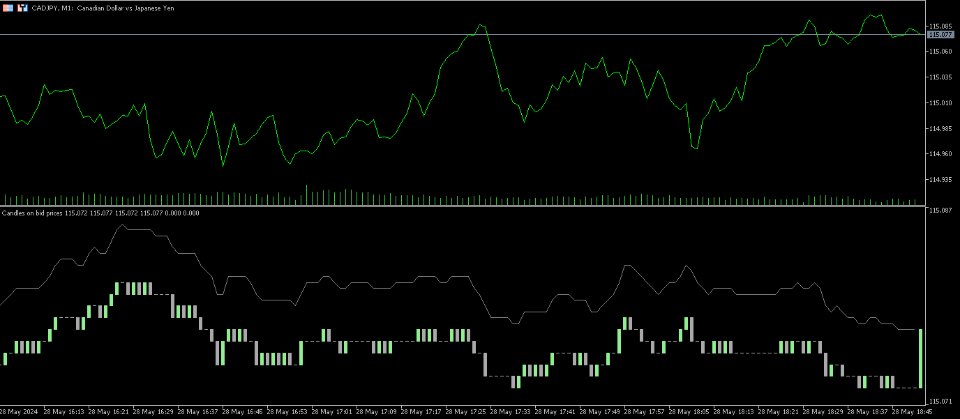
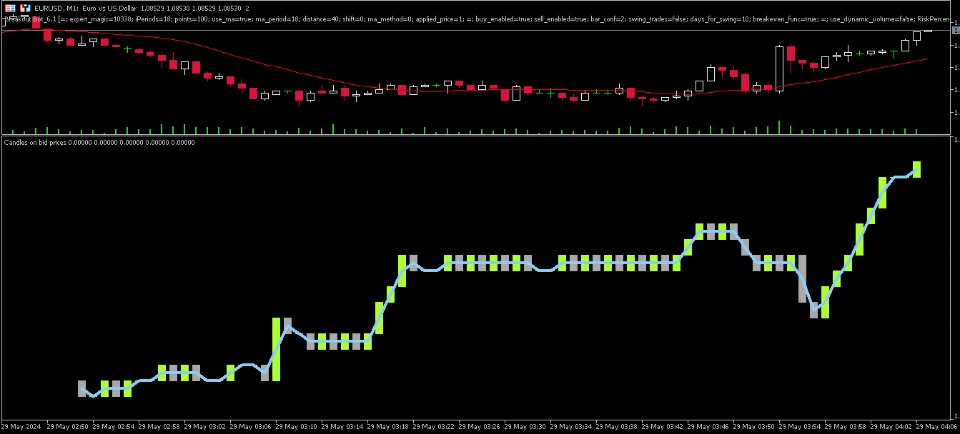
Candlestick chart based on the BID ticks
- Indicateurs
- Conor Mcnamara
- Version: 1.2
- Mise à jour: 29 mai 2024
This is a tick indicator which compares the current bid price with the previous bid directly before it, and draws candles based on a comparison of the current ticks. It does not use historical ticks. Everything happens in real time, data moves from right to left, and the newest data arrives at the right.
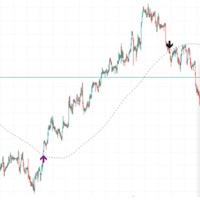
A trend line can be added which points in the direction of the price shifts.










L'utilisateur n'a laissé aucun commentaire sur la note