MACD Breakout Indicator
- Indicateurs
- Mohamed Hassan Mohamed Hassan Alsherbiny
- Version: 2.0
- Mise à jour: 8 juillet 2024
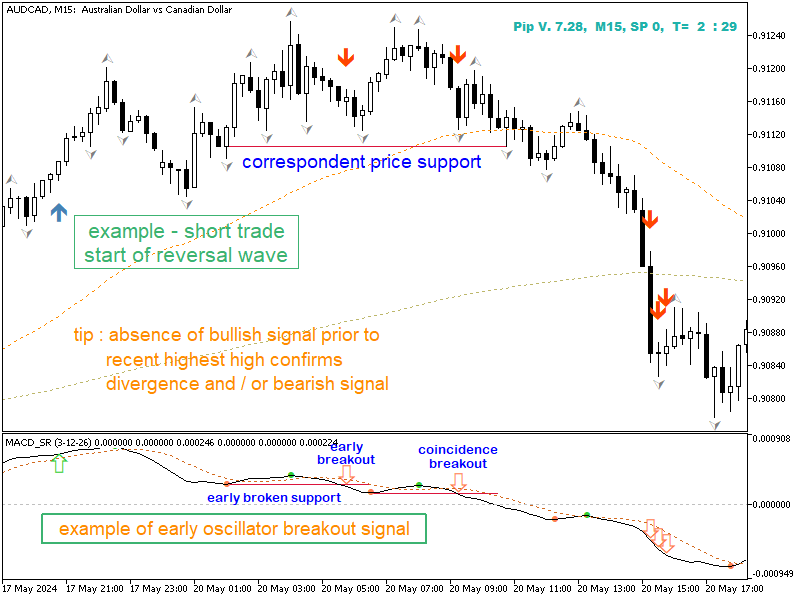
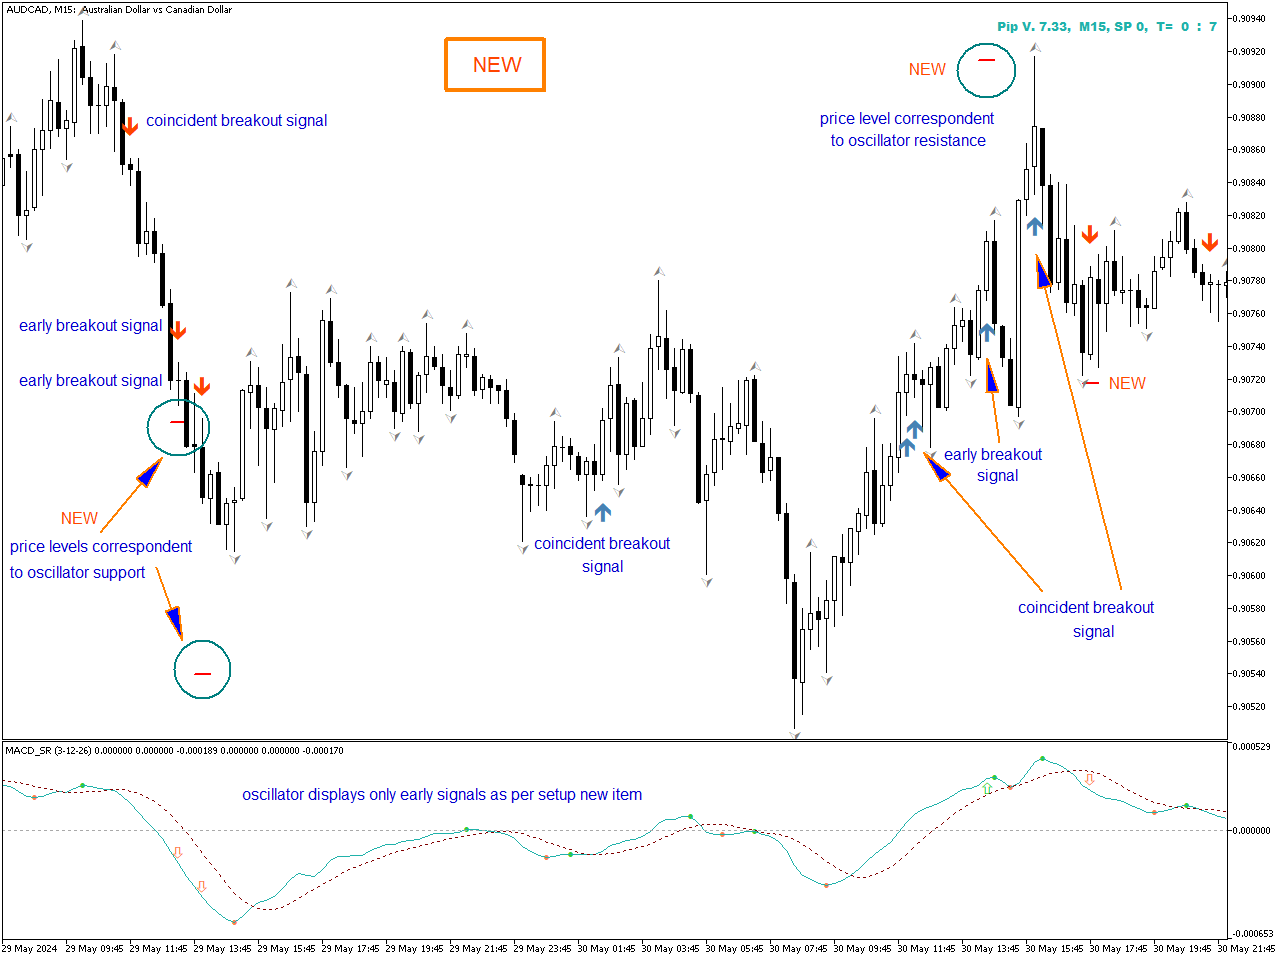
Il y a probablement une augmentation des prix lorsque MACD dépasse le niveau de résistance historique de l'oscillateur. Il est recommandé de vérifier la rupture du prix en comparant la rupture de l'oscillateur, car leurs effets sont similaires aux niveaux de support et de résistance de la rupture des prix ; les transactions à découvert auront probablement la même perception.
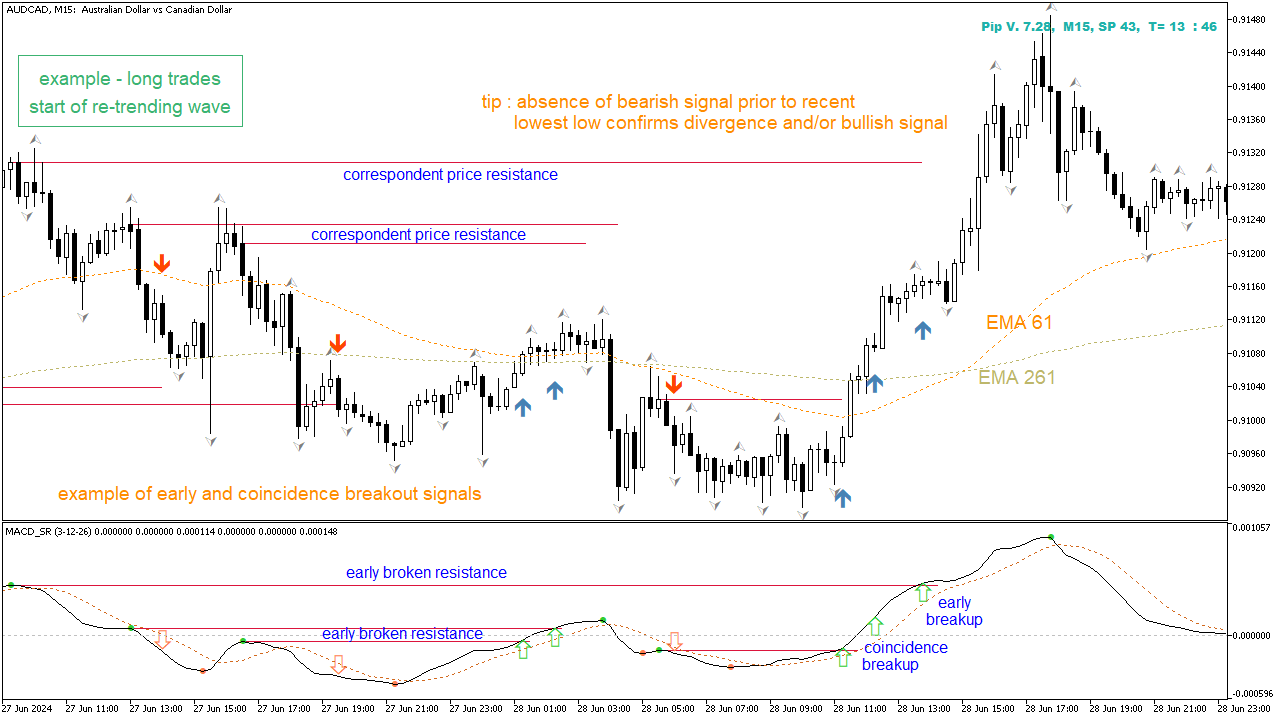
Comme avantage, la cassure de l'oscillateur précède souvent la cassure du prix en tant qu'alerte précoce d'un événement à venir, tels que démontrés par les 2e et 3e captures d'écran. En outre, on confirme la divergence si un signal de continuation n'est pas trouvé avant le plus haut ou le plus bas et qu'un signal d'inversion est observé.
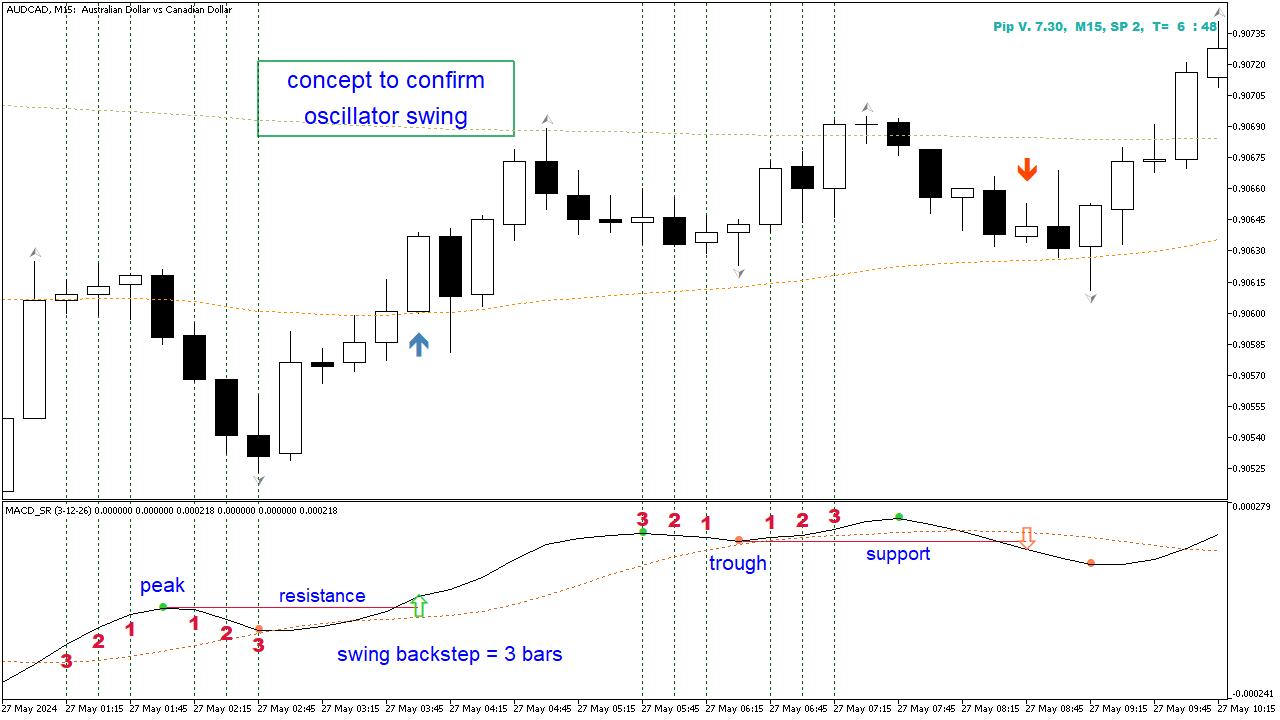
Le principe repose sur la quête de niveaux de swing selon le nombre de barres de chaque côté du pic ou du creux – comme indiqué dans la première capture d'écran – et à son tour modifiés par les paramètres de l'indicateur « swing backstep ».
Les signaux indicateurs sont visibles exclusivement sur le graphique ; une fenêtre séparée affiche des captures d'écran uniquement à des fins d'illustration. Néanmoins, pour afficher les signaux dans une fenêtre séparée, vous pouvez trouver l'indicateur approprié sur https://www.mql5.com/en/market/product/117836/
L'indicateur est conseillé d'être utilisé en collaboration avec d'autres indicateurs de support et de résistance des prix, de zones d'offre et de demande et/ou d'indicateurs de tendance.
Si vous souhaitez utiliser l'indicateur dans votre EA, envisagez le tampon n° 3 pour les transactions longues et le tampon n° 4 pour les transactions courtes.
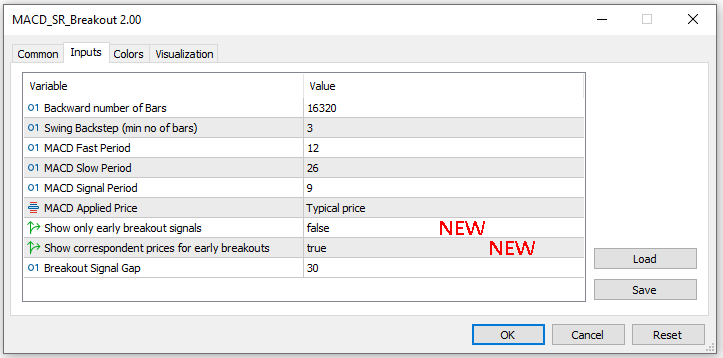
réglage de l'indicateur :
- Backward number of Bars : Quantité de barres en arrière requises pour être analysées par marqueur.
- Swing Backstep (min no of bars) : nombre minimal de barres nécessaires pour créer un pic ou un creux de part et d'autre.
- MACD Fast Period : MACD - période d'EMA rapide
- MACD Slow Period : MACD - La période EMA est lente.
- MACD Signal Period : MACD ligne de signalisation - période SMA
- MACD Applied Price : prix utilisé pour évaluer l'EMA
- Breakout Signal Gap : contrôle la distance entre la flèche de signal et la mèche de la barre
Note:
Il n'y a pas d'indicateur qui assurera 100 % des transactions gagnantes, mais le trader doit réaliser un backtest afin d'optimiser son réglage en utilisant d'autres indicateurs.


Very thank you for sharing. I use the indicator and will not missing there. Can you make public the code? Best regards