Price Divergence for MT5
- Indicateurs
- Krzysztof Janusz Stankiewic
- Version: 1.0
- Activations: 5
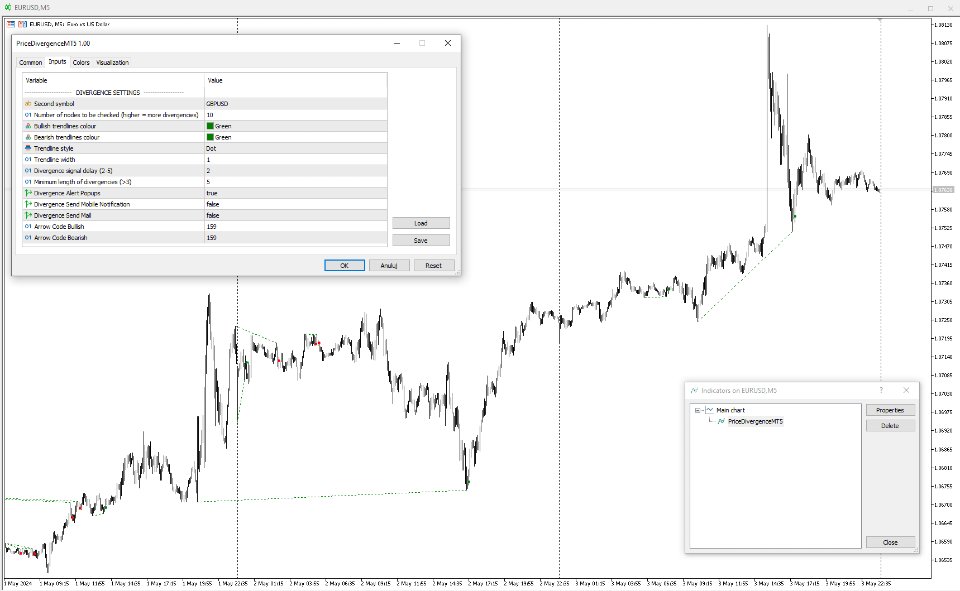
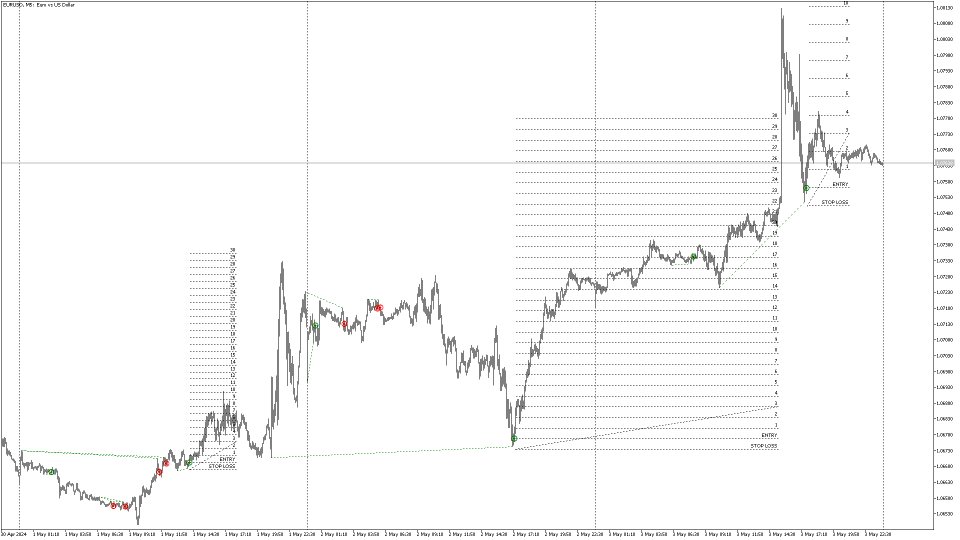
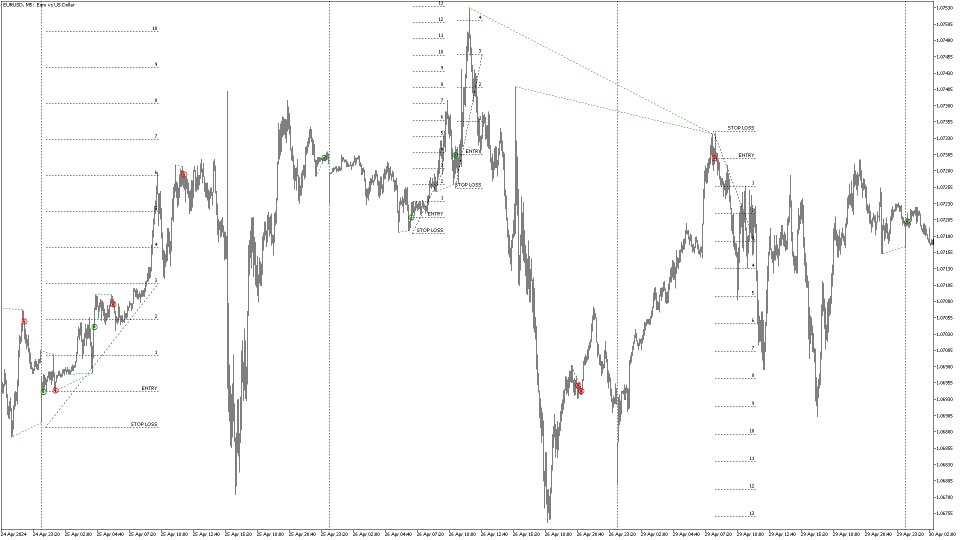
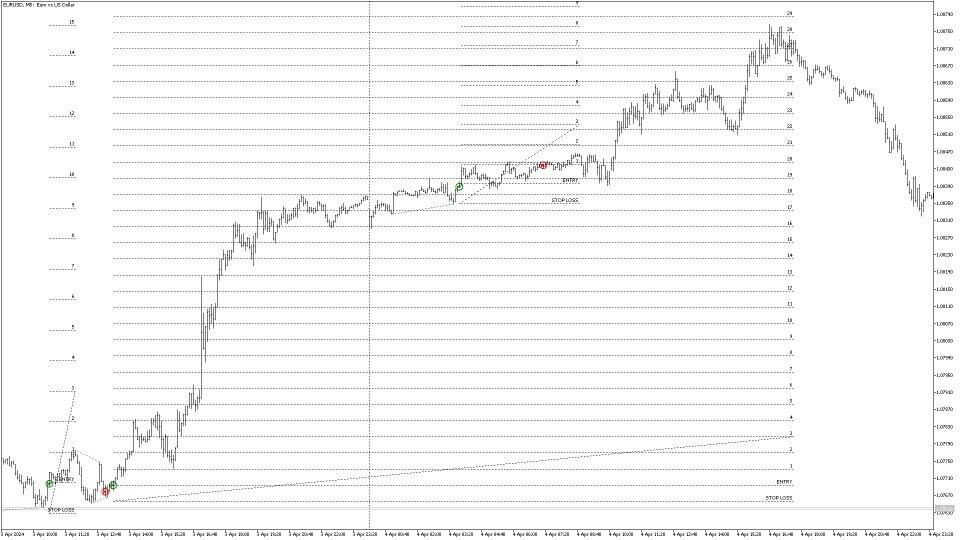
The indicator illustrates the divergence between the price movements of two financial instruments, such as EURUSD and GBPUSD or US500 and US30 or Gold and Silver. These divergences are plotted in the form of segments on the price chart of the dominant instrument. The dominant instrument refers to the one that exhibits a stronger bullish trend in the case of a bullish divergence, or a stronger bearish trend in the case of a bearish divergence. Investors are encouraged to independently seek correlated financial instruments that would work well with this indicator.
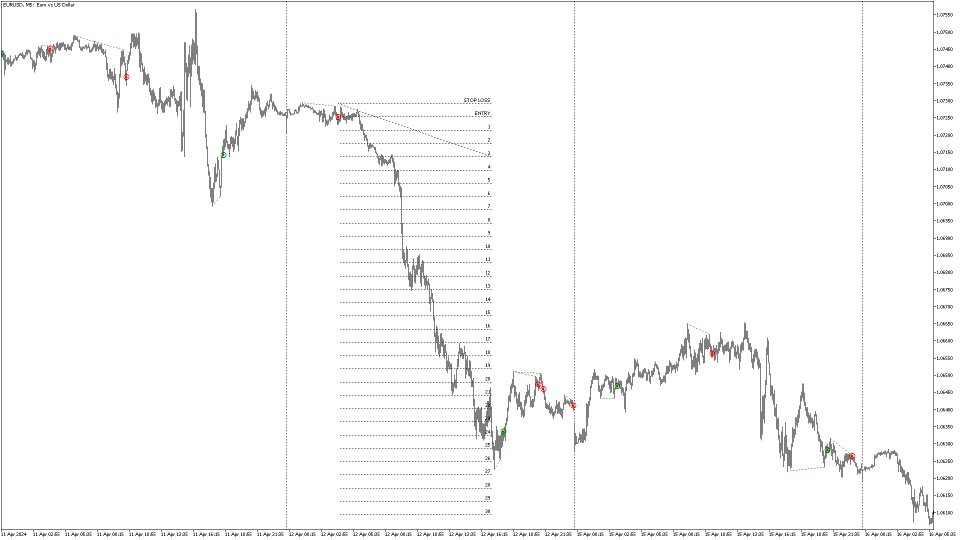
The trading strategy involves considering opening a long position when a bullish divergence is observed, or opening a short position when a bearish divergence occurs. It is recommended to use simultaneously other indicators for entry confirmation, particularly those that identify trends.
While many signals may result in a break-even or stop-loss outcome, there are instances that offer high risk:reward (R:R) ratios. The user has the discretion to determine whether these high R:R ratios offset the losses incurred from other setups.

