YF Meter
- Indicateurs
- Yun-Feng Hsieh
- Version: 5.20
- Mise à jour: 1 septembre 2022
- Activations: 8
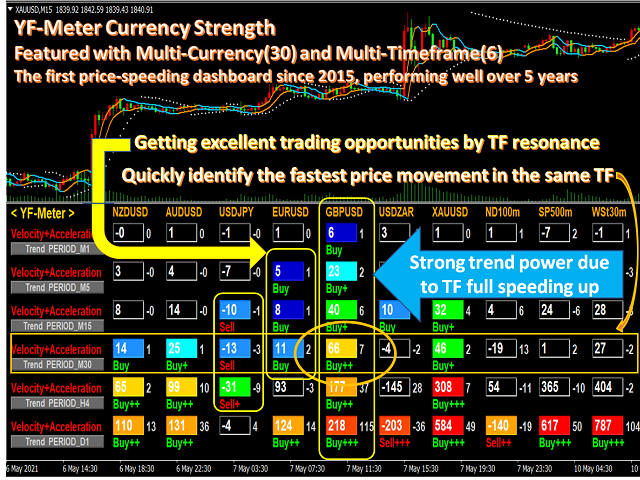
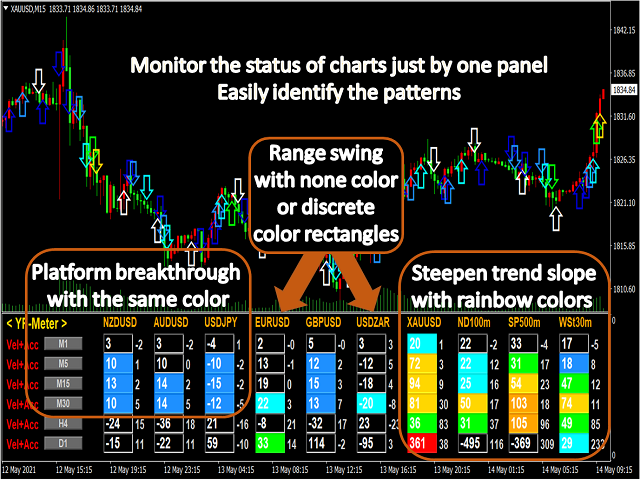
YF-Meter indicator help you to find the fastest speed up currency pairs.
While the US news are released, non-US currencies rising up or dropping down at the moment.
It is important to consider "the opportunity cost" of opening the positions.
If we can find the fastest rising up or dropping down currency pairs, that would improve our trading.
This idea comes up with "Newton's laws of motion", different from the traditional volatility measurement.
After adjustment by the unique filter(the digital signal processing concept from communications engineering),
the velocity indicator is more stable and directional, and can work at any period and time frame.
It shows the USD profit value per period of time.
Positive velocity means bullish trend, negative velocity means bearish trend.
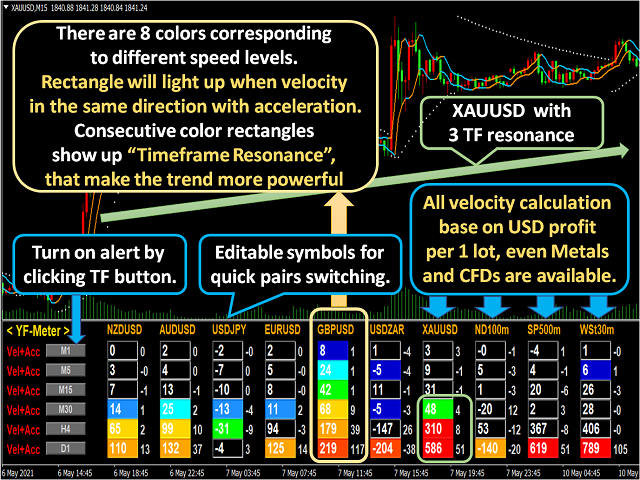
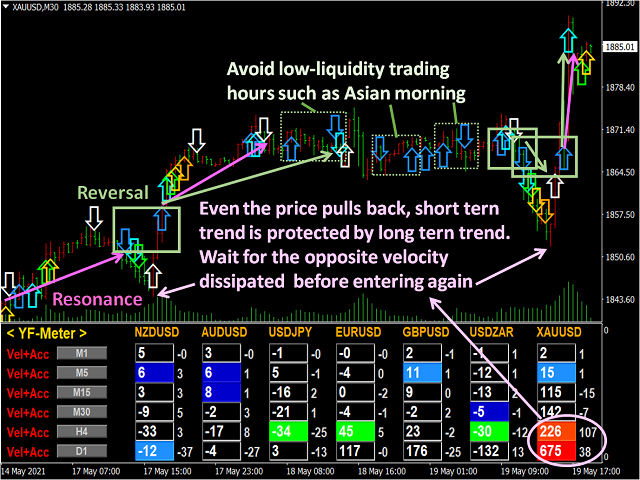
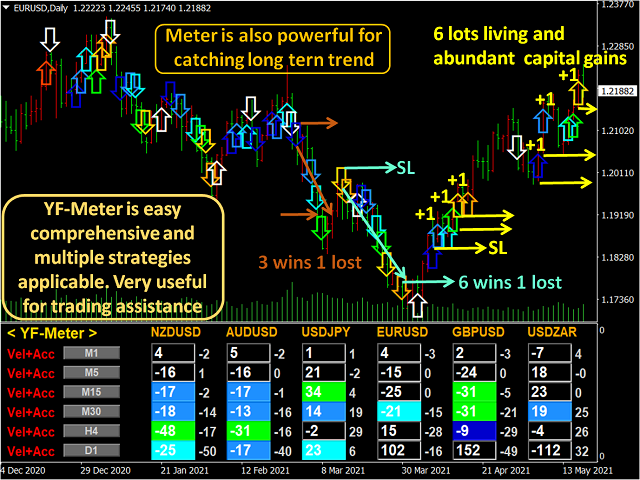
Colors represent the temperature relative to speed showing how fast the currency pairs run per period.
There are eight levels to identify speed strength, also you can create your own criteria by changing parameters.
Parameters
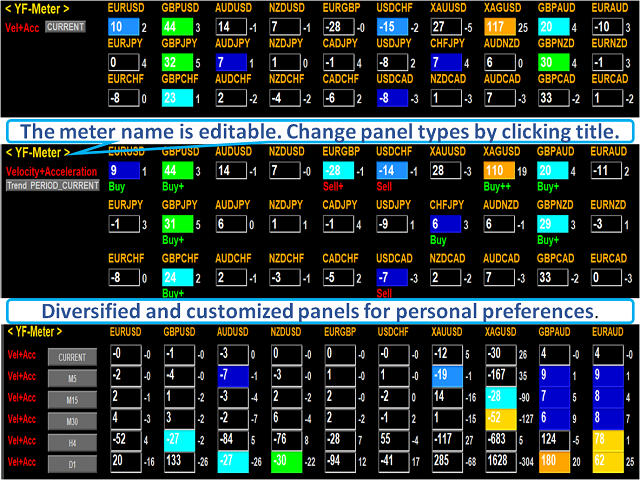
- Panel: Multi-currency 30 in the same time frame or multi-timeframe 6 for 10 pairs.
- Rows: There are 6 row for selecting to display.
- TimeframeRows: The fixed time frame of rows.
- Show_Acceleration: The function for showing accelerations or not.
- Show_TrendSignal: The function for showing trend signals or not.
- Currencies: To choose 30 currency pairs to display on meter, to close unwanted by setting "0".
- VelocityLevels & Colors: Initial settings
- 5 points per period and below - black, means no movement.
- 5 to 10 - medium blue, tiny movement, the direction is clear but weak.
- 10 to 20 - dodger blue, trend can be determined. Consider opening the positions toward the direction.
- 20 to 30 - aqua, medium strong trend, also the strong trend on short tern time frame M1/M5.
- 30 to 50 - lime, strong trend on short tern time frame, such as M1 /M5 /M15.
- 50 to 100 - gold, strong trend on medium tern time frame, such as M30 /H1 /H4.
- 100 to 200 - orange, the trend on long tern time frame, H4 /D1.
- 200 to 300 - orangered, strong trend shall continue for a long time and on long tern time frame, D1/ W1 /MN.
- More than 300 - red, extreme event has occurred or super trend.
- Colors Settings: The color setting of other items on the panel.
- Alert Function: If alert velocity is reached, there are sound alert and pop up window for warning within every alert period(in seconds).
- Mobile Notification: Alert will be send to mobile phone.
Attention
1. Due to multi-currency's data display in the single chart, demo could not work well.
One-month rent for testing is recommend. It works well on any time frame in live account.
2. Be sure that all necessary symbols in MT4 are turned on, and the symbol name must be correct.
Some brokers have their unique symbol name, ex. "EURUSDxxx",not the same as initial setting "EURUSD".
Display would be successful after adjusting the name.
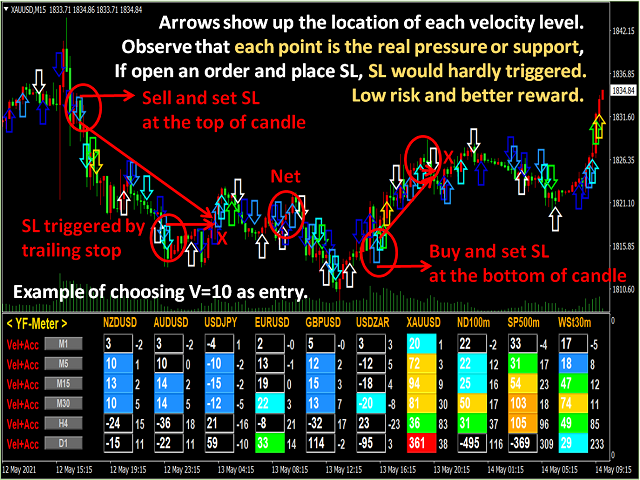
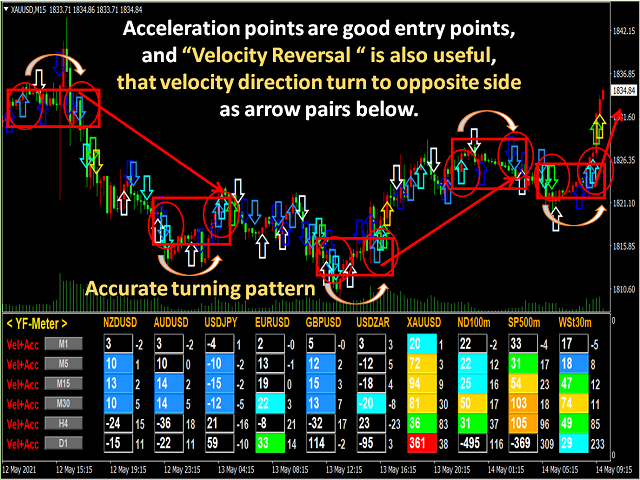
3. Arrows showing on screenshots is just for explanation, the function is not included due to a lot of objects.
4. The difference between Meter and Dashboard are trading function and panel designing, the speed calculation principle is the same.
5. Product do not guarantee any profit. Good trading comes from proper fund management.
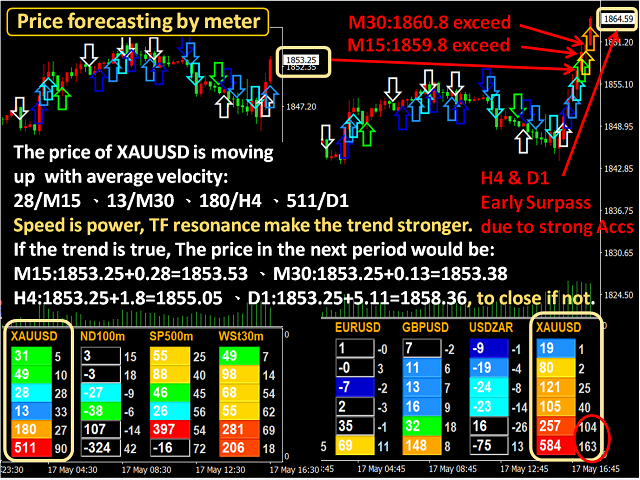
Meter is an accuracy and convenient trading tool, good at trend forecasting and market monitoring.




This indicator makes trading easier. Focusing on fastest pair is one of the best trait to have as a scalper. With right lot size, we can conquer market completely. The author also very responsive with every question being asked.