RSI Pro Analyser MT5
- Indicateurs
- Frederic Jacques Collomb
- Version: 1.1
- Mise à jour: 3 mai 2024
- Activations: 5
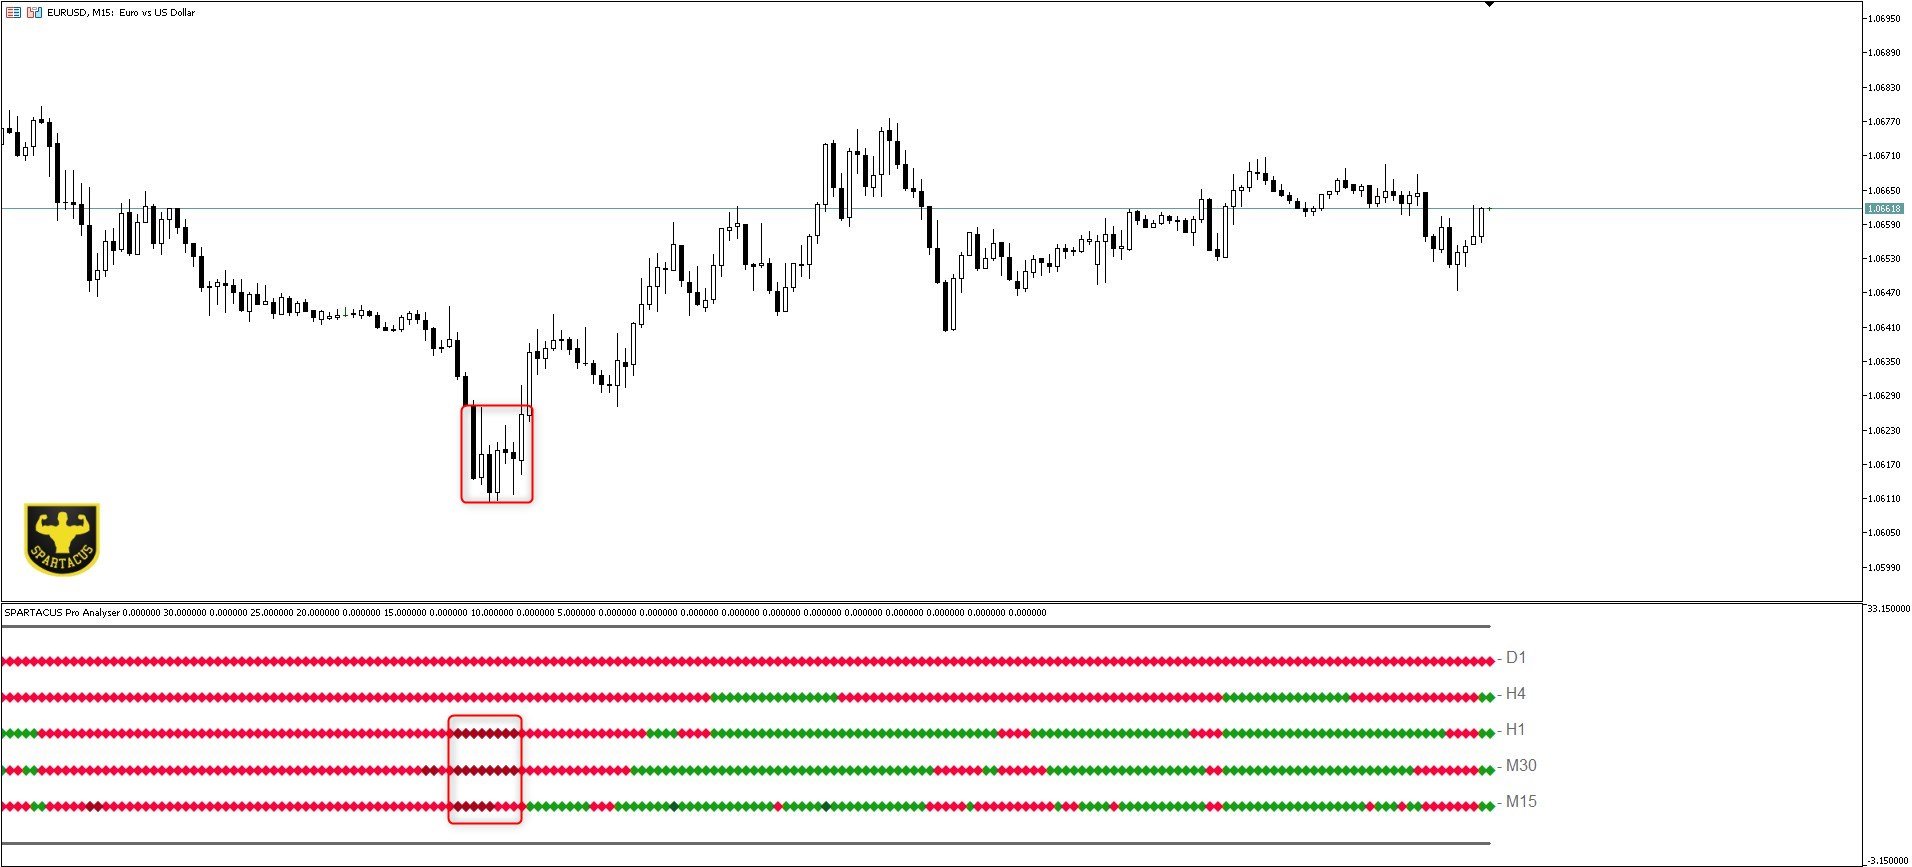
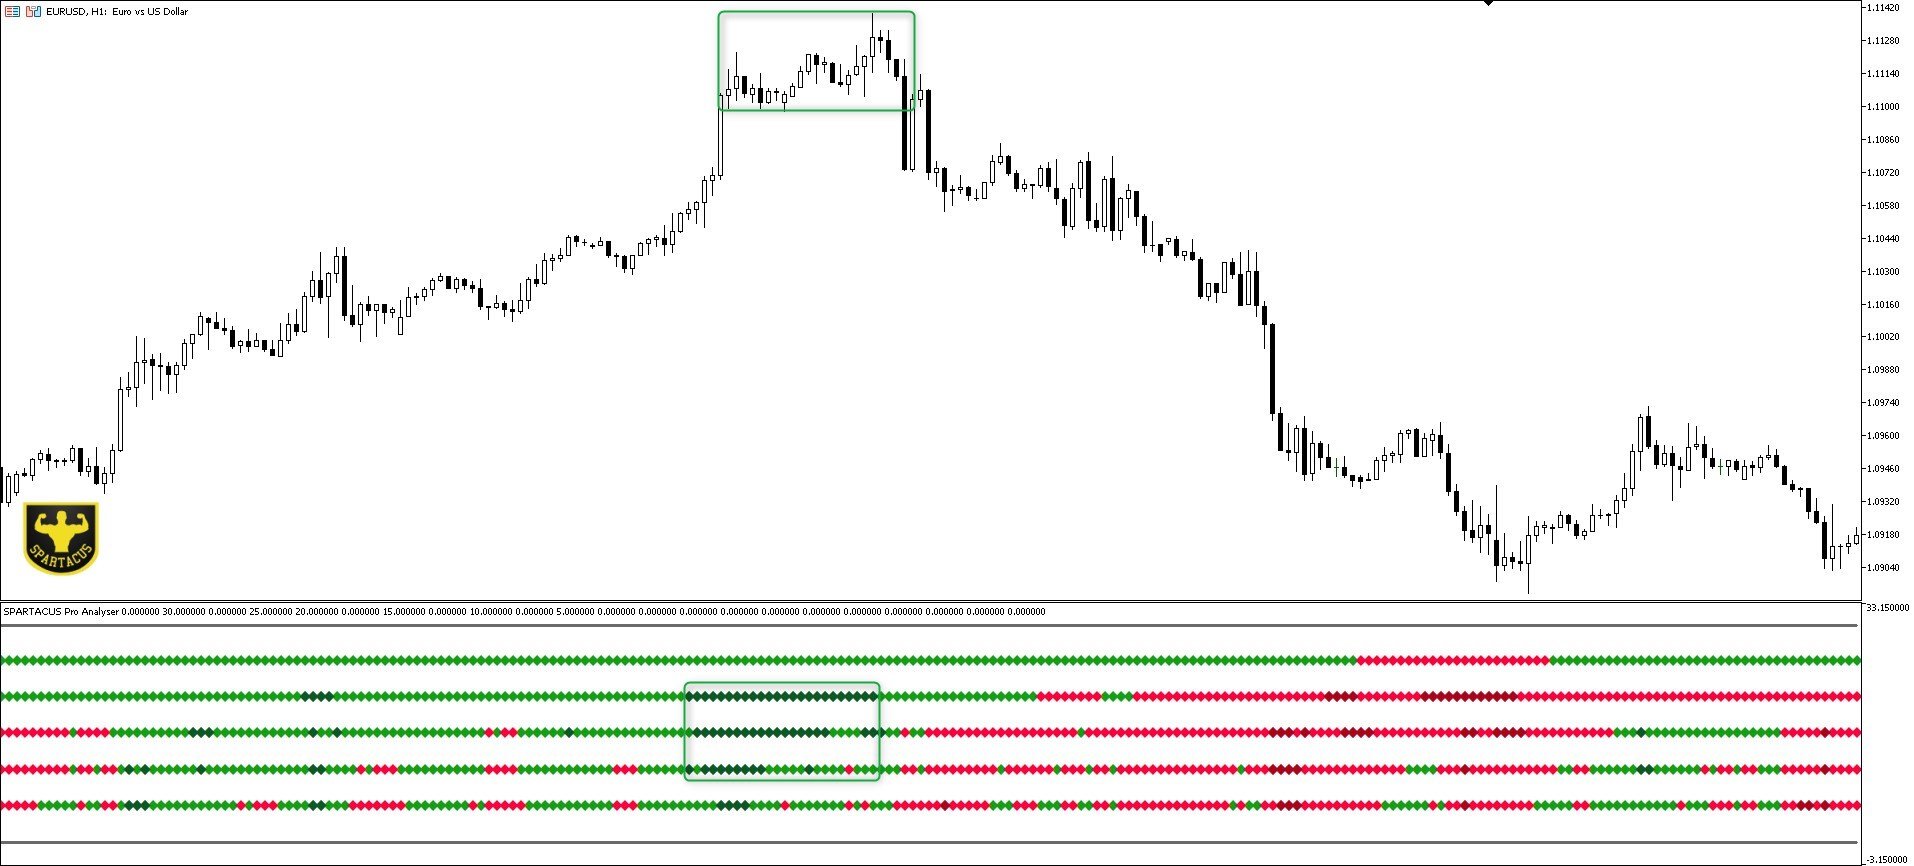
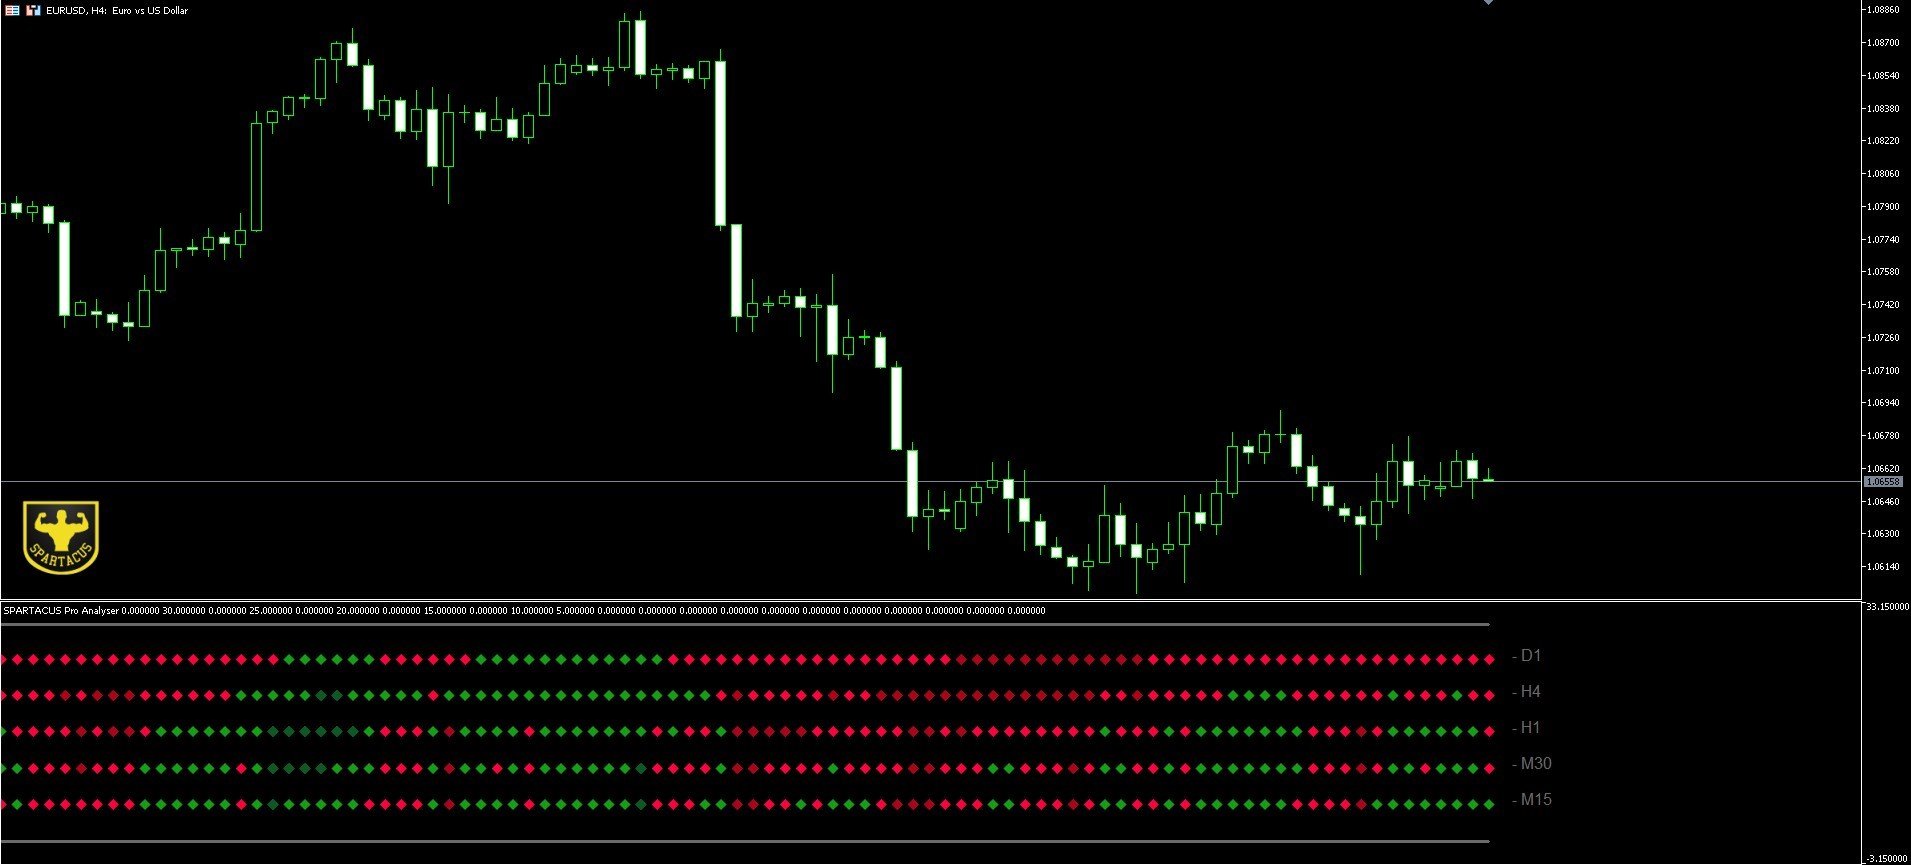
L'indicateur RSI Pro Analyser est un outil puissant conçu pour les traders cherchant à prendre des décisions éclairées sur plusieurs unités de temps simultanément. Cet indicateur utilise le RSI pour fournir des signaux de surachat, de survente et de tendance, facilitant ainsi l'identification des opportunités d'entrée sur le marché. Son principal atout est sa facilité de lecture grâce à son code couleur clairs et distincts pour indiquer différentes conditions de marché.
L'indicateur affiche les valeurs du RSI et les signaux associés sur cinq unités de temps différentes ( D,H4,H1,M30,M15), permettant ainsi aux traders d'obtenir une perspective complète du marché et de prendre des décisions éclairées sur plusieurs horizons temporels.
Utilisez les changements de couleur pour identifier les tendances et les renversements potentiels sur différentes unités de temps. Recherchez les zones de surachat et de survente pour repérer les opportunités de trading à contre-tendance ou de retournement de tendance.
Rouge: RSI indiquant une tendance baissière.
Vert: RSI indiquant une tendance haussière.
Rouge foncé: RSI signalant une zone de survente.
Vert foncé: RSI signalant une zone de surachat.
Vous pouvez également être averti des entrées à l'achat et à la vente par des alertes précises qui peuvent être envoyées par Pop Up, mail et notification Push.
L'indicateur RSI Pro Analyser est un outil complémentaire dans le processus de prise de décision du trader. Il est recommandé de l'utiliser en conjonction avec d'autres indicateurs et analyses pour obtenir une vue d'ensemble du marché.
Paramètre d'entrée:
RSI Period: 14 (par défaut), ajustable selon vos préférences.
Enable/disable alert: Activer ou désactiver les 3 type d'alertes, Pop Up/mail et notification Push.
Texte Buy/Sell: Texte des alertes entièrement paramétrable.