High Low Swing
- Indicateurs
- Shahabeddin Baset
- Version: 1.0
High Low Swing (HLS) Indicator
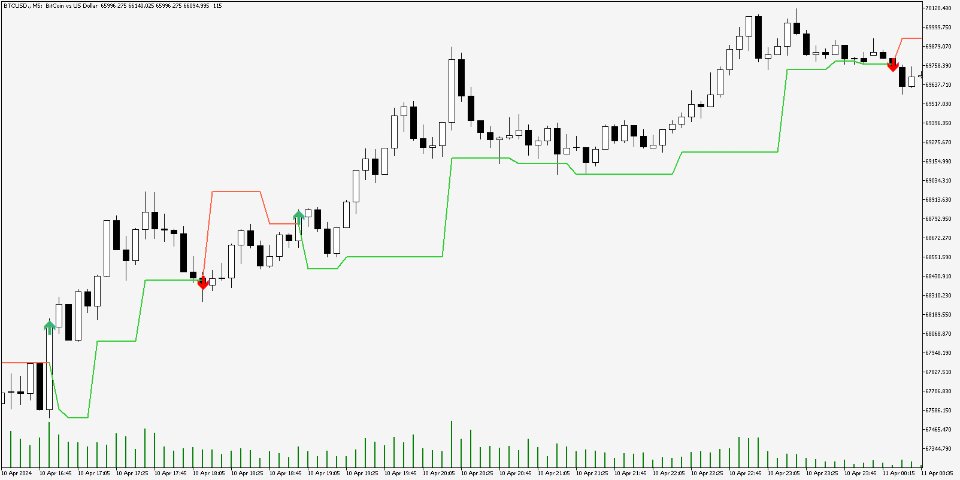
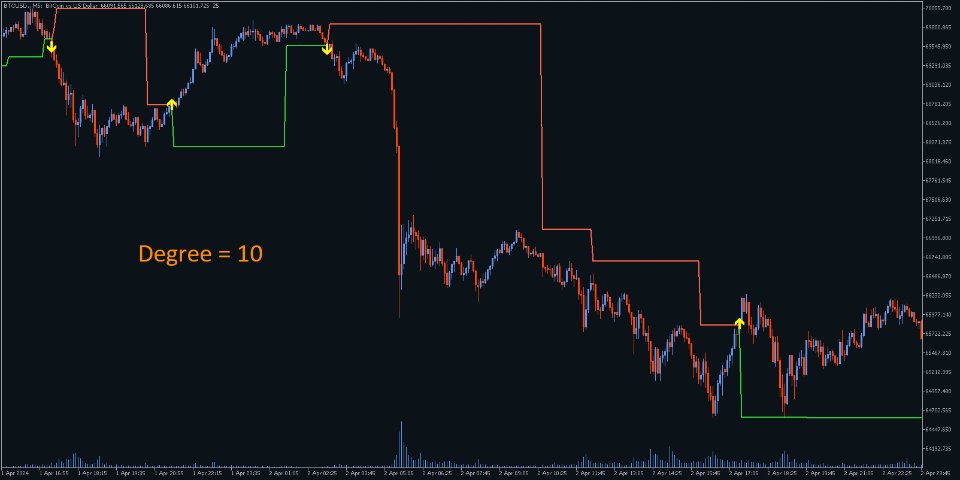
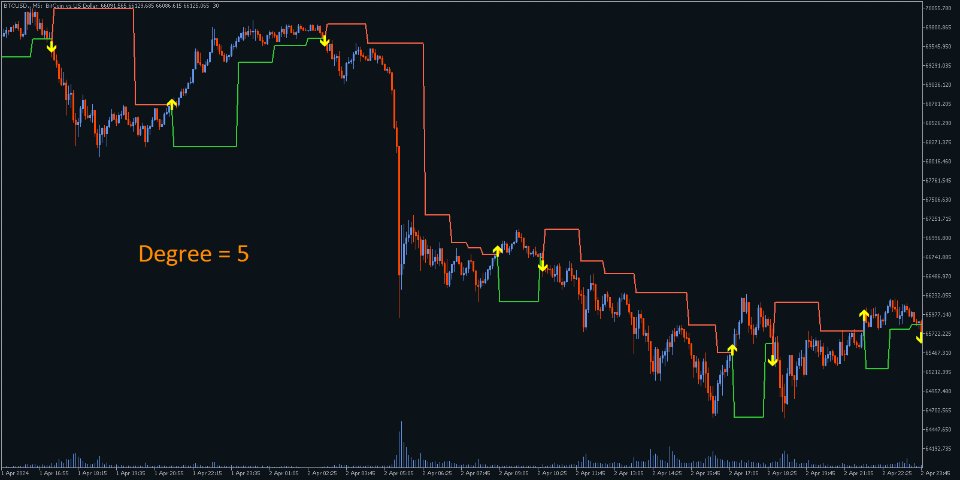
The HLS indicator is a technical analysis tool designed to identify swing highs and lows in the market, aiding swing traders in making informed decisions. It offers an adjustable "degree" parameter, allowing you to customize the sensitivity to strong price movements based on current market conditions.
Features:
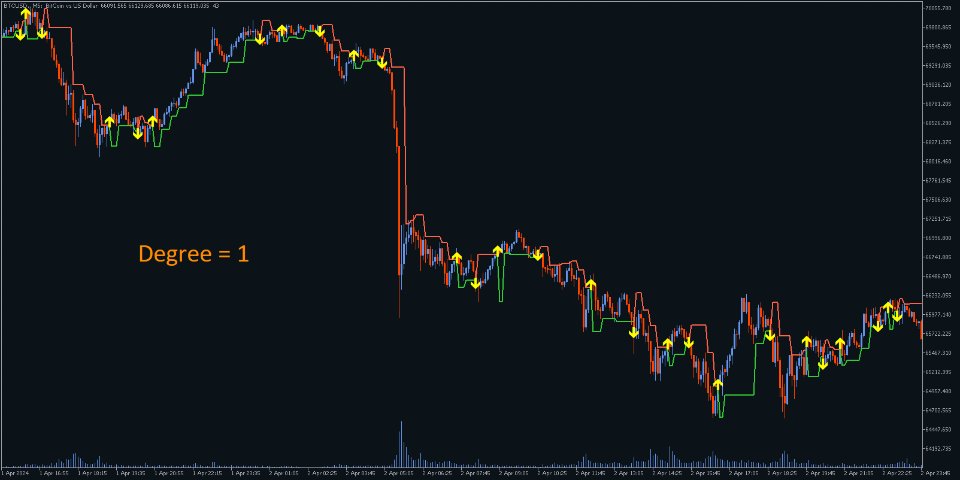
• Clear Buy/Sell Signals: The indicator plots signals directly on the chart, simplifying trade identification.• Adjustable Swing Strength: The "degree" parameter lets you fine-tune the indicator to capture significant swings or identify more frequent, smaller swings.
• Visual Trend Confirmation: A single colored line represents the most recent swing, colored red for downtrends and green for uptrends, providing a visual confirmation of the price direction.
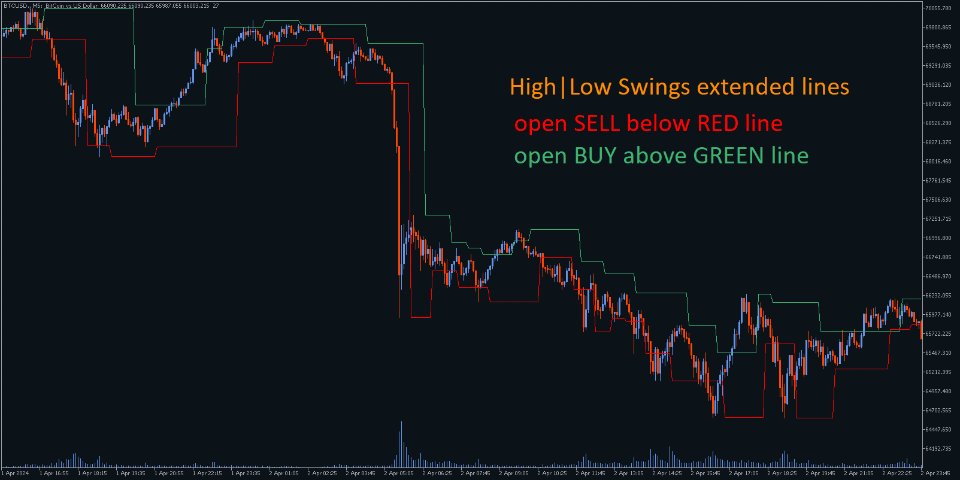
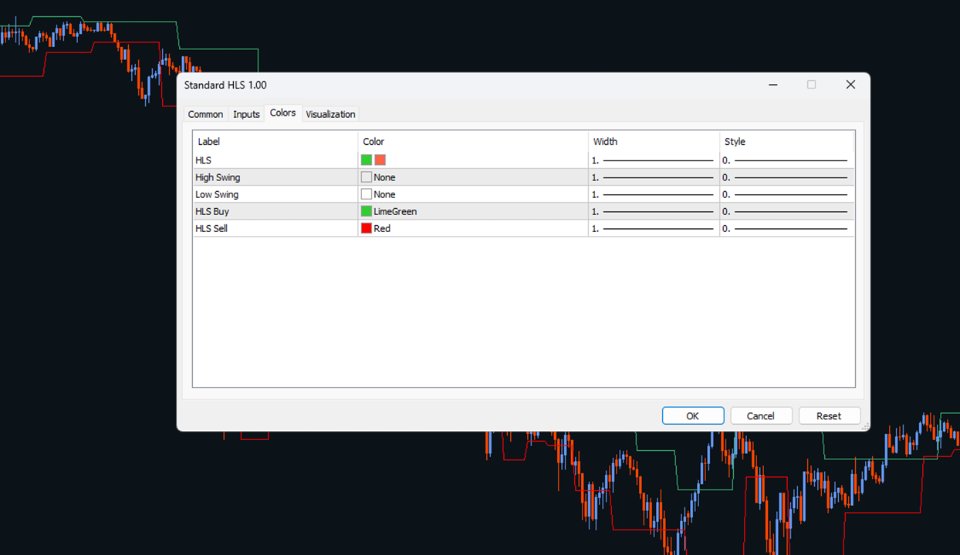
• Optional Extended Swings: The indicator can also calculate and display independent high or low swing lines (hidden by default). This allows for deeper analysis of potential turning points.
Description:
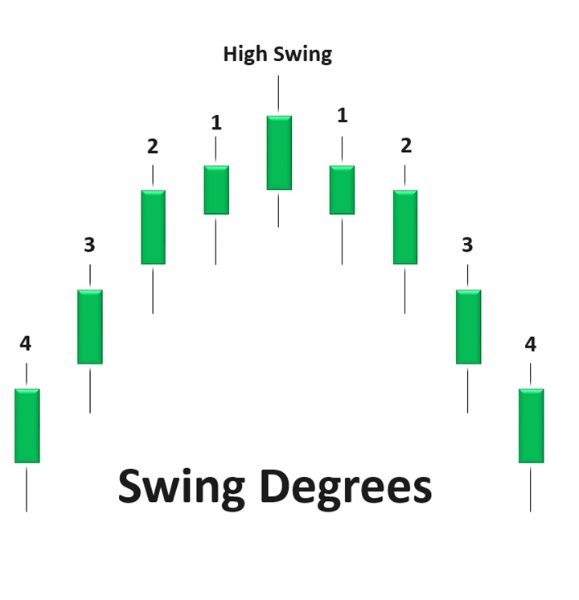
The HLS indicator identifies swings by analyzing the sequence of highs and lows. A high swing (of a certain "degree") is formed when a price peak is higher than a specified number of preceding highs and a specified number of subsequent highs. Similarly, a low swing is identified when a price trough is lower than a specified number of preceding lows and subsequent lows. The "degree" setting determines the required number of highs/lows to qualify as a swing.Trading Signals:
• Buy Signal: A buy signal is generated when the price closes above the most recent high swing line.
• Sell Signal: Conversely, a sell signal is generated when the price closes below the most recent low swing line.

