RSI Rush
- Indicateurs
- MARTIN ANDRES DEL NEGRO
- Version: 1.0
- Activations: 5
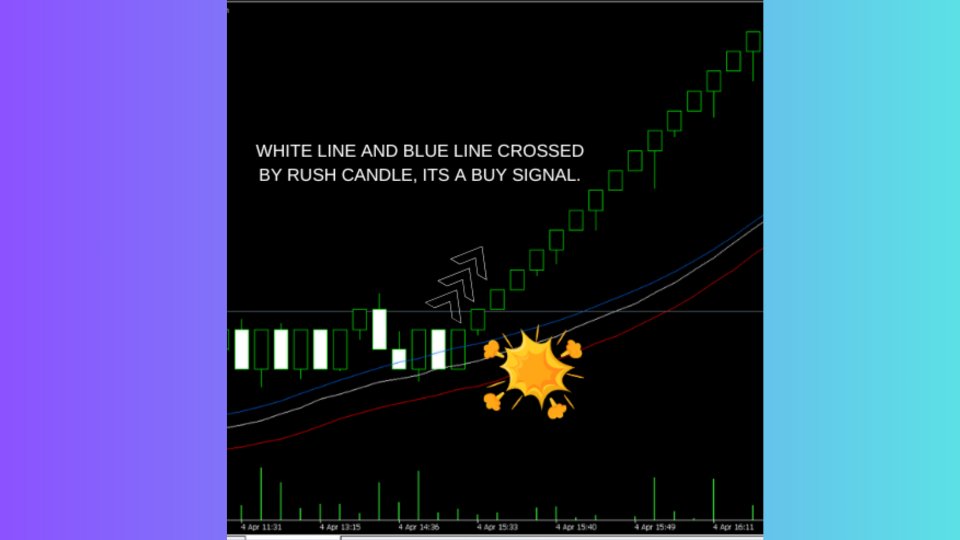
Certainly! Let’s discuss the RSI Rush, an aggressive momentum indicator that combines weighted moving averages (WMAs) at lows, mid-price, and tight highs. Here are the key components:
-
Weighted Moving Averages (WMAs):
- The RSI Rush employs three WMAs:
- WMA at Lows: Calculated based on the lowest prices during a specific period.
- WMA at Mid-Price: Considers the average price (midway between highs and lows) during the same period.
- WMA at Tight Highs: Based on the highest prices during the specified timeframe.
- These WMAs provide a smoothed representation of price action.
- The RSI Rush employs three WMAs:
-
Entry During Aggressive Phase:
- The RSI Rush aims to enter trades during the aggressive phase of price movement.
- An aggressive phase occurs when the price crosses above or below the central line (typically the 50 level).
- Crossing above the central line signals potential bullish movement.
- Crossing below the central line signals potential bearish movement.
-
Tight Price Action:
- The RSI Rush focuses on tight price ranges.
- Tight highs and lows indicate reduced volatility and potential breakouts.
- The indicator seeks to capture these breakouts during the aggressive phase.
-
Relative Strength Index (RSI):
- While not explicitly mentioned, the RSI Rush likely incorporates RSI as part of its analysis.
- RSI helps confirm overbought or oversold conditions, aligning with the concept of the aggressive phase.
In summary, the RSI Rush identifies high-probability entry points based on weighted moving averages, adjusted price action, and RSI signals. Traders can use this indicator to enhance their trading strategies and improve timing for their trades.
