Semi Log Scale Oscillator Anchored
- Indicateurs
- Ryan L Johnson
- Version: 1.0
- Activations: 5
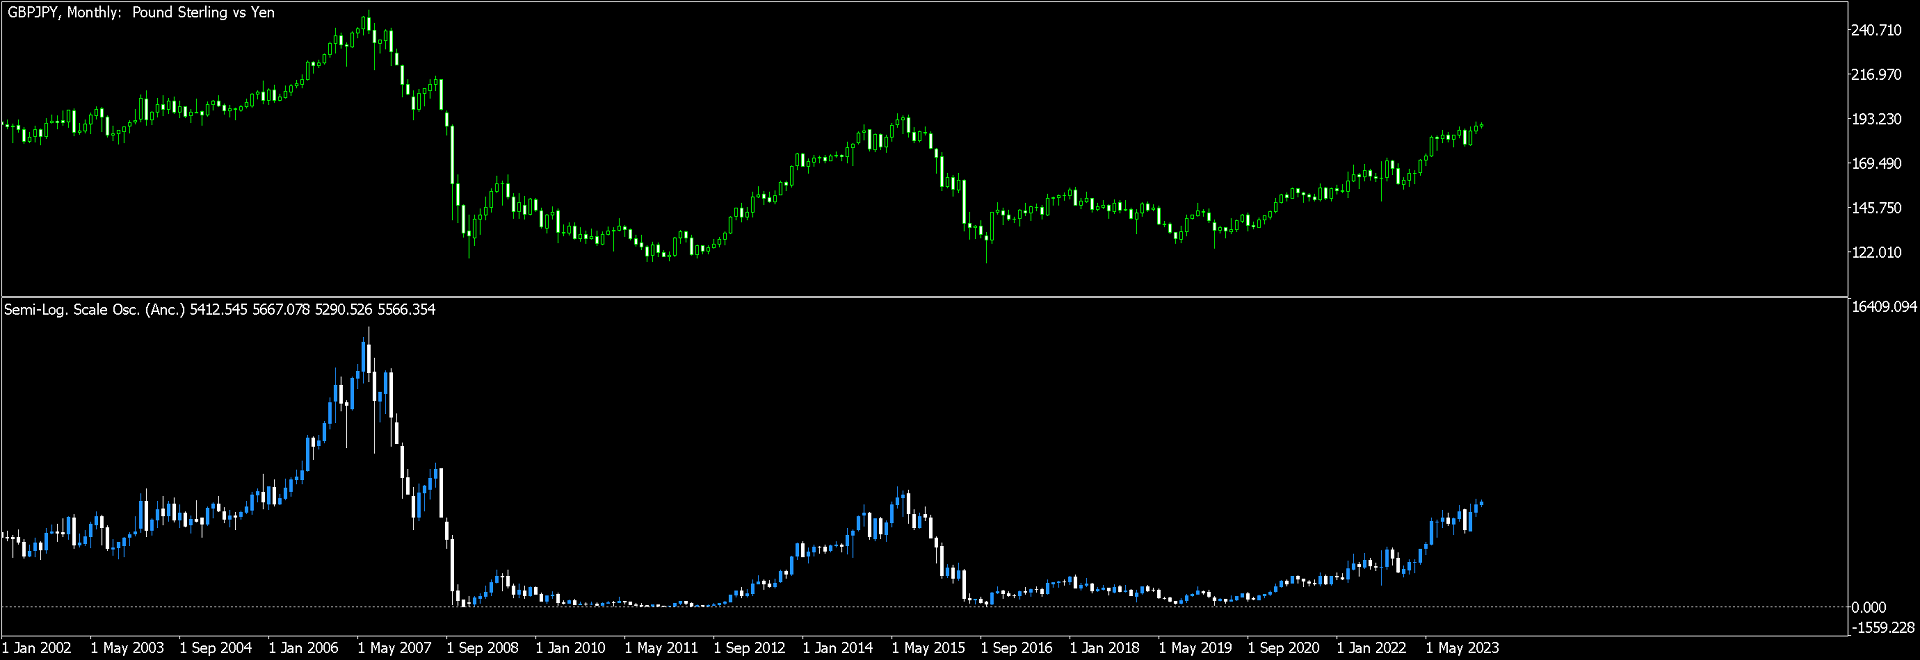
Cet indicateur est un oscillateur à échelle semi-logarithmique ancré. Une échelle logarithmique est largement utilisée par les data scientists professionnels pour cartographier avec plus de précision les informations collectées sur une période donnée, de la même manière que MT5 cartographie les données de prix. En fait, la logique sous-jacente à cet indicateur a été obtenue librement auprès d’un scientifique étranger en biotechnologie.
Un graphique log-log affiche des valeurs logarithmiques sur les axes x (horizontal) et y (vertical), ce qui produit généralement une ligne droite qui pointe vers le haut, vers le bas ou reste plate. Une ligne droite n'est pas très utile pour négocier sur les marchés, car elle est tellement lissée que les valeurs de prix réelles qui apparaissent au fil du temps sont très éloignées de la ligne étudiée. En revanche, un graphique semi-logarithmique n'est enregistré que sur un seul axe, généralement l'axe Y. Un tel graphique semi-logarithmique est bien adapté aux marchés commerciaux car l'axe du temps (x) est conservé dans sa forme originale tout en fournissant en même temps une échelle y graduée où la distance entre les augmentations de prix augmente progressivement à mesure que le prix augmente (et diminue à mesure que le prix baisse). Cela nous permet d’établir un niveau zéro pour un prix bas, de visualiser clairement les tendances sous des angles plus droits et d’observer clairement des hausses de prix amplifiées aux prix élevés. Par conséquent, cet indicateur utilise une échelle semi-logarithmique sur l’axe y uniquement.
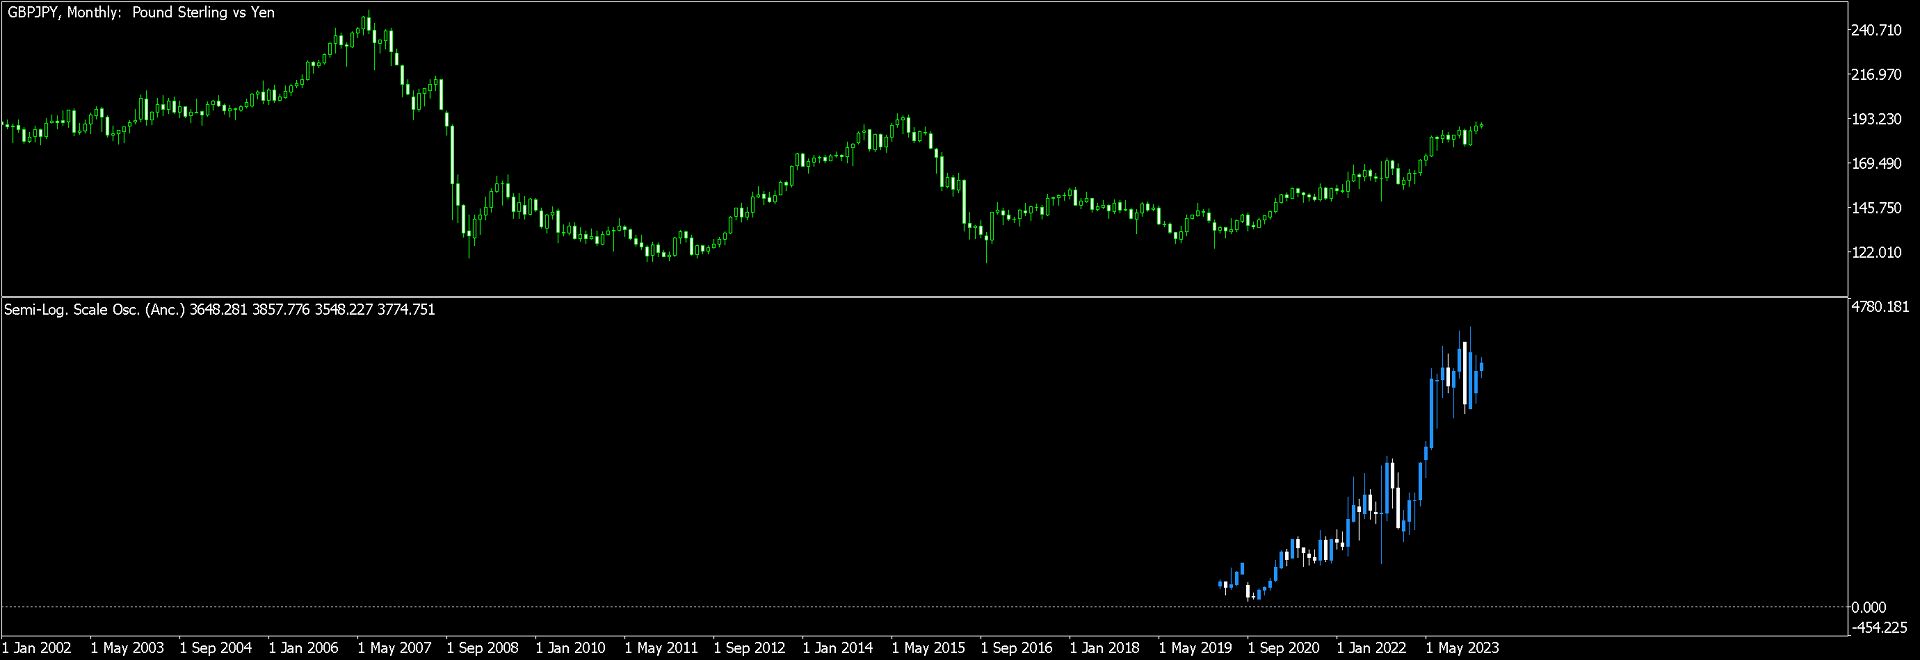
Cet indicateur est ancré car il permet de préciser une heure de début de calcul des barres de prix. Les paramètres sont les suivants :
Année.Mois.Jour Heure:Minute - par défaut 1970.01.01 00:01 - s'il est laissé sur le paramètre par défaut, l'indicateur détecte automatiquement la première barre de prix de l'historique des graphiques, même lorsque l'année 1970 n'est pas dans l'histoire. Les notes apparaissent dans la fenêtre des paramètres de l'indicateur.
Taille de la première étape pip à enregistrer - la valeur par défaut est 135 - cette valeur par défaut convient aux délais plus élevés tels que MN1 (mensuel), tandis que 5 convient aux délais inférieurs tels que M1 (minute). En fin de compte, les paramètres optimaux dépendront de la période à laquelle vous attachez l'indicateur, du niveau de volatilité des prix au cours de cette période et de l'heure de début que vous choisissez. N'oubliez pas... La formule semi-logarithmique calcule de bas en haut, votre heure de début doit donc toujours être un swing bas majeur. Encore une fois, des notes apparaissent dans la fenêtre des paramètres de l'indicateur.
Les indicateurs MT5 standard (intégrés) qui peuvent être appliqués aux « Données de l'indicateur précédent » peuvent être appliqués à cet indicateur.
Les lignes d'indicateur (tampons d'indicateur) peuvent être appelées avec iCustom dans les Expert Advisors créés par le logiciel de création Expert Advisor ou dans les Expert Advisors codés personnalisés. Les prix d'ouverture, de haut, de bas et de clôture de l'échelle logarithmique sont des tampons :
Pas de valeurs vides ; et
Pas de repeinture.
Cet indicateur ne se chargera pas sans données de marché en direct : le marché doit être ouvert.
AVERTISSEMENT LÉGAL : Rien dans cet article ne peut être interprété comme un conseil en matière de trading ou d'investissement. Tous les exemples fournis ci-dessus illustrent simplement les caractéristiques techniques et l’utilisation hypothétique de l’indicateur publié ici.