Chat MT4
- Utilitaires
- Thomas Bradley Butler
- Version: 5.30
- Mise à jour: 7 mars 2024
- Activations: 5
PLEASE READ BEFORE PURCHASE
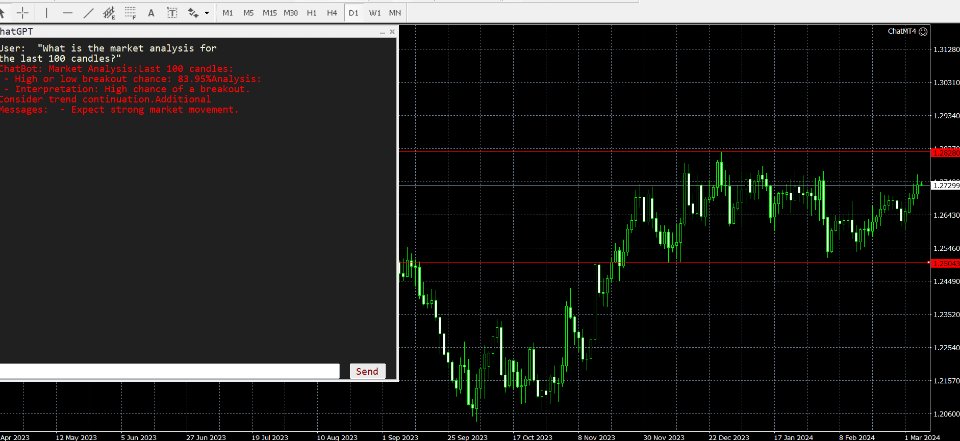
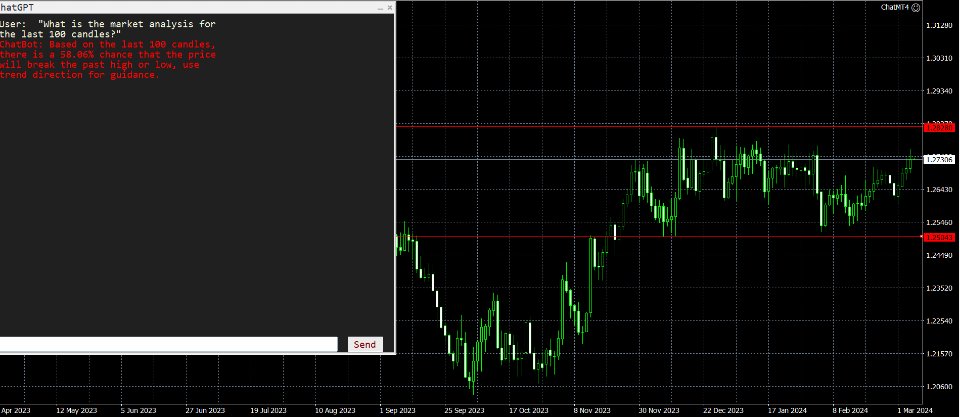
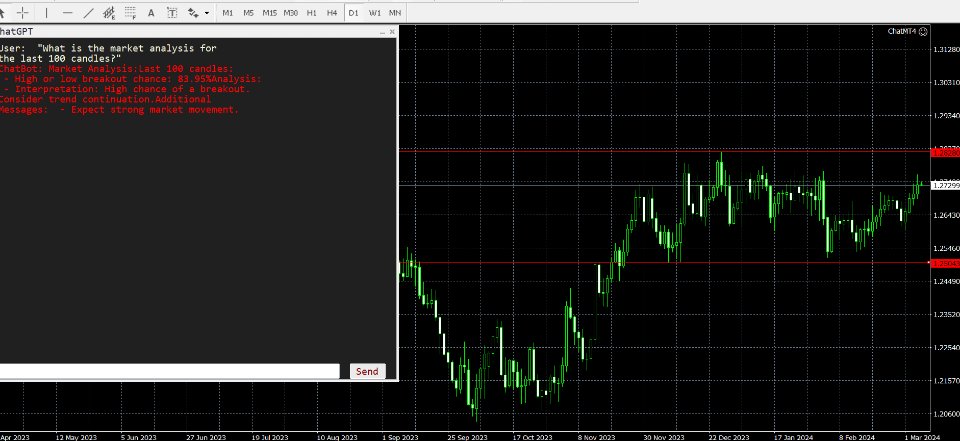
USE EXACT PROMPT FOR 100 BARS ANALYSED:
"What is the market analysis for the last 100 candles?"
You need to add links that are in comments to experts' tabs, and you need to input your own API Key in inputs:
Path files in comments!
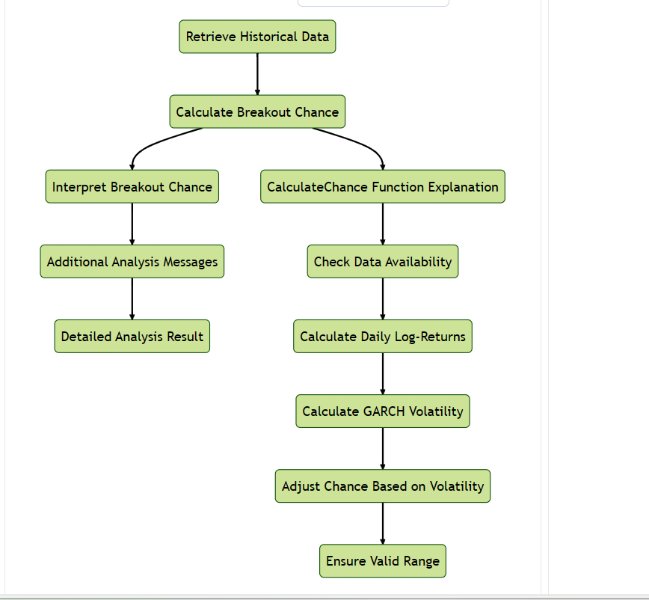
Market Analysis Script Explanation:
-
Retrieve Historical Data:
- The script starts by fetching the high and low prices of the last 10 candles (or bars) in the market. These represent the highest and lowest prices during each candle's time period.
-
Calculate Breakout Chance:
- It then calculates the chance of a price breakout based on historical data. This calculation involves more sophisticated methods like daily log-returns and GARCH (a volatility estimation technique).
-
Interpret Breakout Chance:
- The script provides an interpretation of the calculated chance:
- If the chance is above 70%, it suggests a high likelihood of a breakout, advising to consider trend continuation.
- If the chance is between 30% and 70%, it indicates a moderate chance, advising to monitor market conditions.
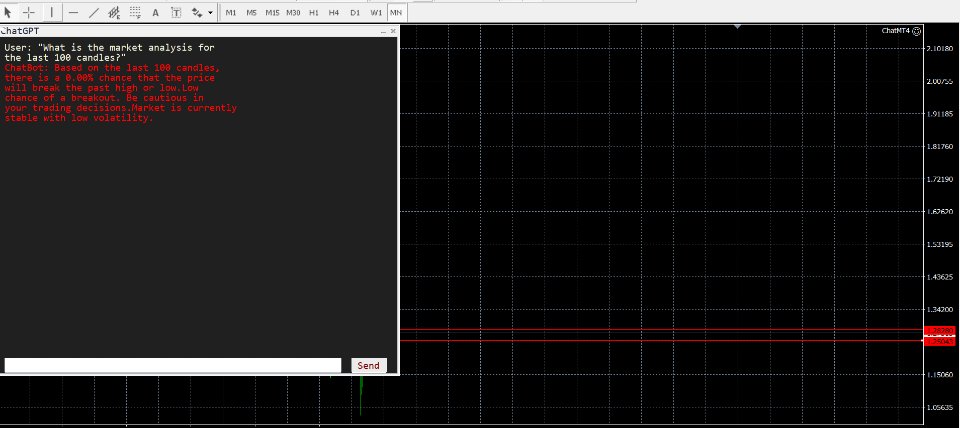
- If the chance is below 30%, it suggests a low chance, recommending caution in trading decisions.
- The script provides an interpretation of the calculated chance:
-
Additional Analysis Messages:
- The script includes additional analysis messages based on specific chance conditions:
- If the chance is above 80%, it advises to expect strong market movement.
- If the chance is below 20%, it suggests that the market is stable with low volatility.
- The script includes additional analysis messages based on specific chance conditions:
-
Detailed Analysis Result:
- Finally, the script returns a detailed analysis result as a string. This includes the number of candles considered, the calculated chance, and the detailed analysis messages.
CalculateChance Function Explanation:
-
Check Data Availability:
- The CalculateChance function first checks if there is enough historical data (at least two data points) to perform the calculation. If not, it prints an error message and returns 0.
-
Calculate Daily Log-Returns:
- It then calculates the daily log-returns, representing the logarithmic change in prices from one day to the next.
-
Calculate GARCH Volatility:
- Using the iStdDev function, it estimates the GARCH volatility, which is a measure of how much the price fluctuates over time.
-
Adjust Chance Based on Volatility:
- The chance of a breakout is adjusted based on the GARCH volatility. A higher volatility tends to decrease the chance, while lower volatility increases it.
-
Ensure Valid Range:
- The calculated chance is then constrained to be within the valid range of 0 to 100.
This script aims to provide a comprehensive analysis of the market's potential for a breakout based on historical price data and volatility estimation techniques.

