Zigzag Manual Sms Ict Tool
- Indicateurs
- Farhid Ibrahim
- Version: 2.2
- Activations: 5
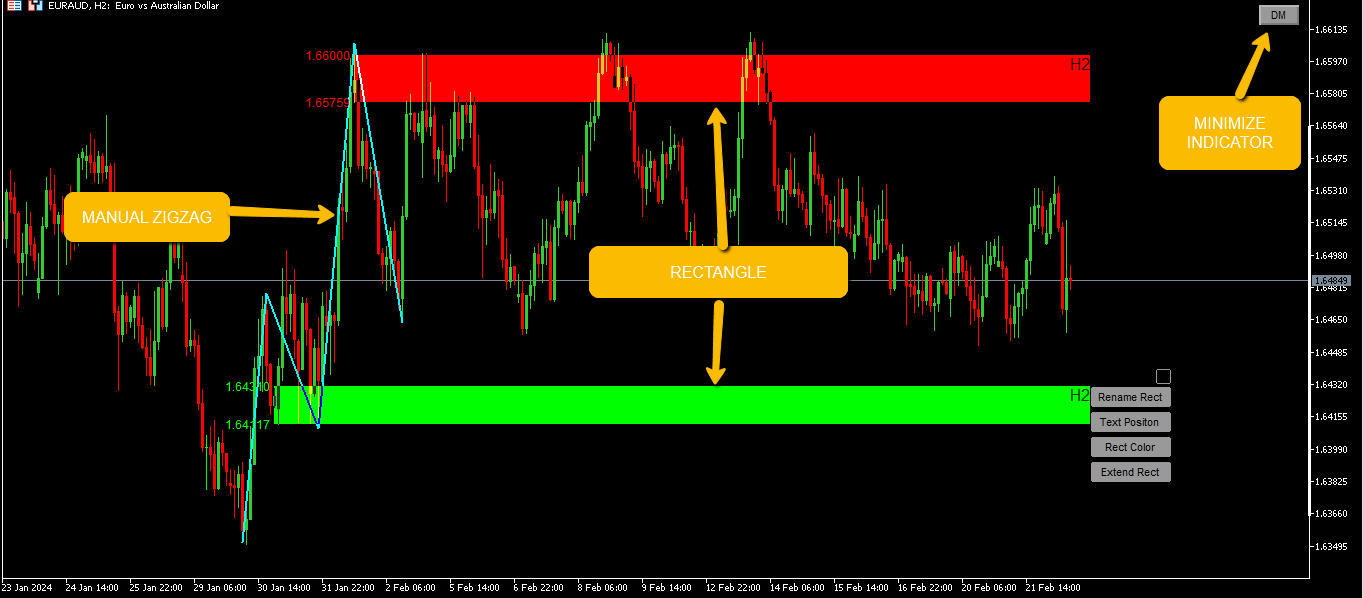
Cet outil vous offre une flexibilité inégalée pour les traders de tous niveaux. Conçu pour une utilisation simple et efficace, cet outil permet aux utilisateurs de dessiner des lignes facilement, avec la liberté de choisir la couleur, la taille et l'unité de temps adaptées à leurs préférences individuelles.
Qu'il s'agisse de tracer des tendances, des supports et des résistances, ou des configurations de figures chartistes, cet outil vous donne le contrôle complet sur vos analyses graphiques. Vous pouvez personnaliser chaque ligne tracée pour correspondre à votre stratégie de trading spécifique, quels que soient vos objectifs ou votre style de trading.
De plus, l'interface intuitive de cet indicateur permet un effacement rapide et précis. Vous pouvez facilement supprimer des lignes individuelles sans perturber le reste de votre analyse, offrant ainsi une souplesse et une réactivité accrues pendant vos sessions de trading.
En résumé, avec notre indicateur technique Forex, vous avez l'outil idéal pour exprimer vos idées graphiques de manière claire et précise, quelle que soit la situation du marché. Profitez de la liberté de personnalisation totale et de la facilité d'utilisation pour optimiser vos décisions de trading.
Note pour les acheteurs : Si voulez arrêter de dessiner, appuyer sur CTRL.
Pour supprimer un tracé, cliquer tout simplement sur le tracé.