• Aperçu
  • Avis
  • Commentaires (2)
  • Nouveautés

ICT Unicorn Model for MT4

The ICT Unicorn Model indicator highlights the presence of "unicorn" patterns on the user's chart which is derived from the lectures of "The Inner Circle Trader" (ICT).

Detected patterns are followed by targets with a distance controlled by the user.
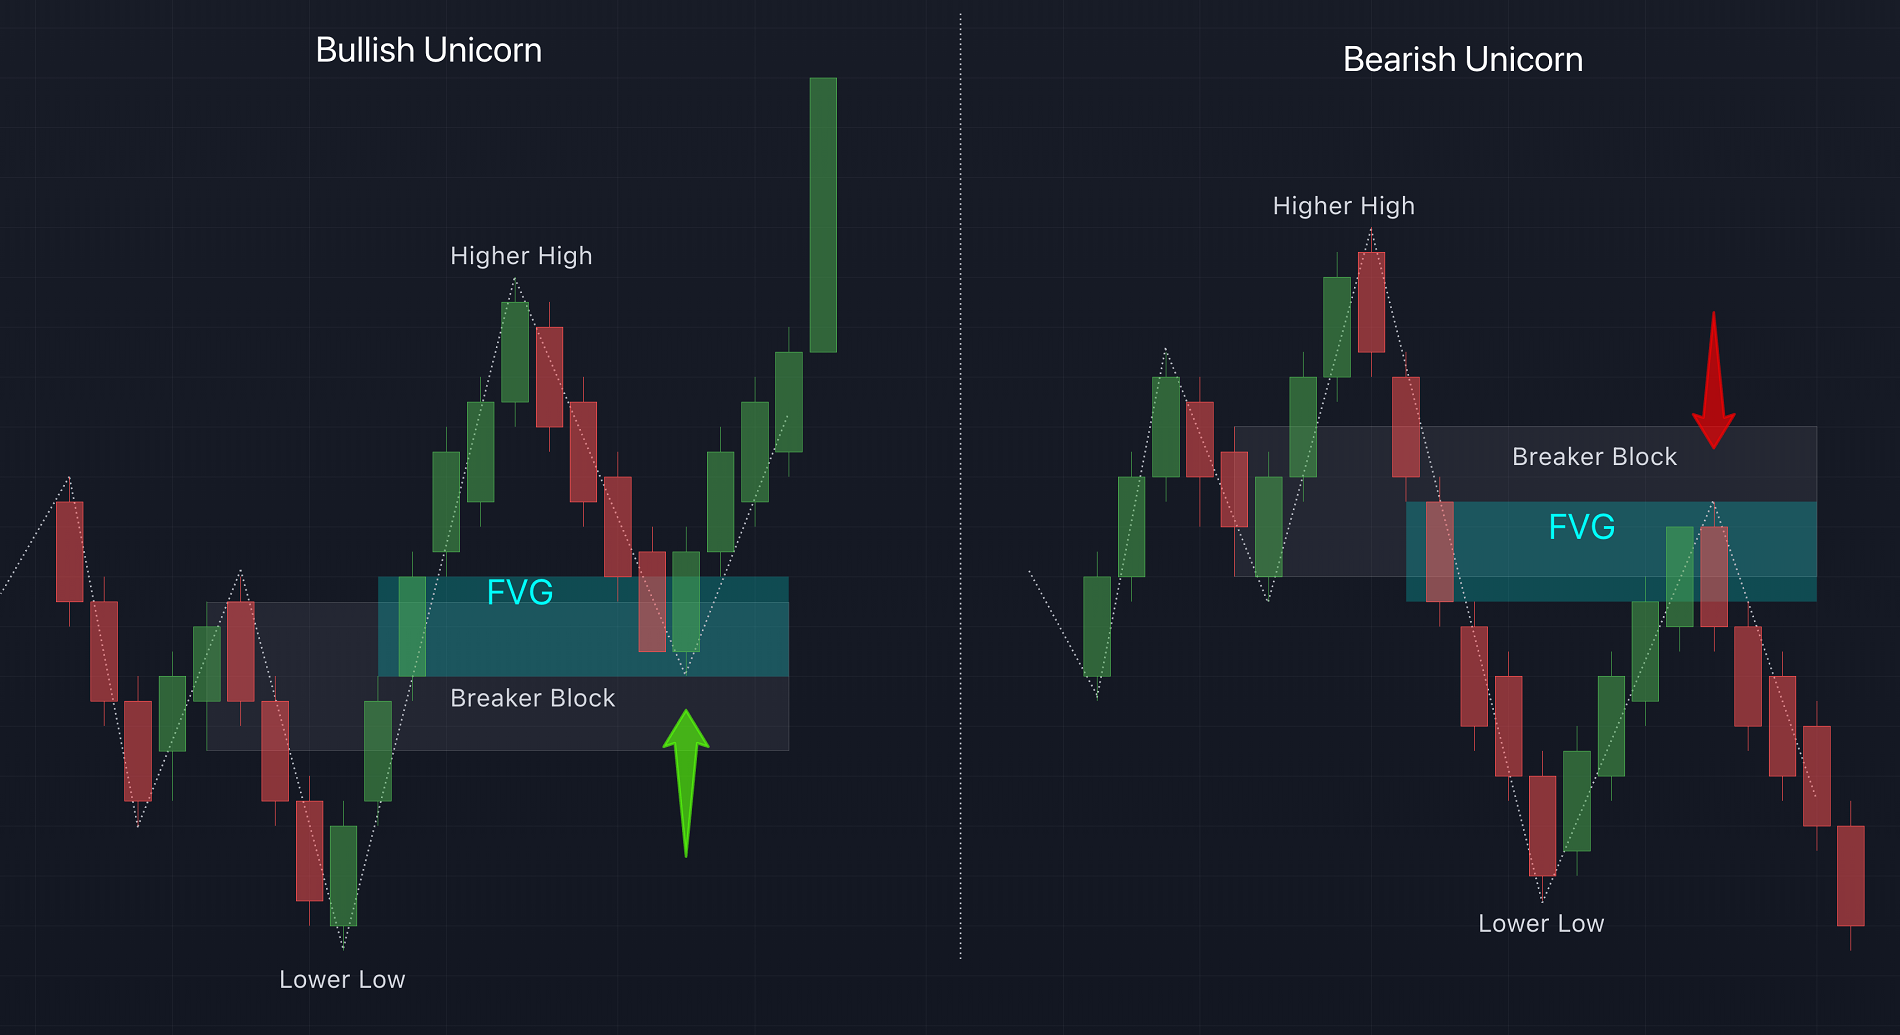
🔶 USAGE (image 2)

At its core, the ICT Unicorn Model relies on two popular concepts, Fair Value Gaps and Breaker Blocks. This combination highlights a future area of support/resistance.

A Bullish Unicorn Pattern consists out of:

  • A Lower Low (LL), followed by a Higher High (HH)
  • A Fair Value Gap (FVG), overlapping the established Breaker Block
  • A successful re-test of the FVG which confirms the pattern.
A Bearish Unicorn Pattern consists of:

  • A Higher High (HH), followed by a Lower Low (LL)
  • A Fair Value Gap (FVG), overlapping the established Breaker Block
  • A successful re-test of the FVG which confirms the pattern

The pattern detection depends on detected swings, which can be controlled by the Swing setting. Using higher values of this setting will return longer-term breaker blocks.
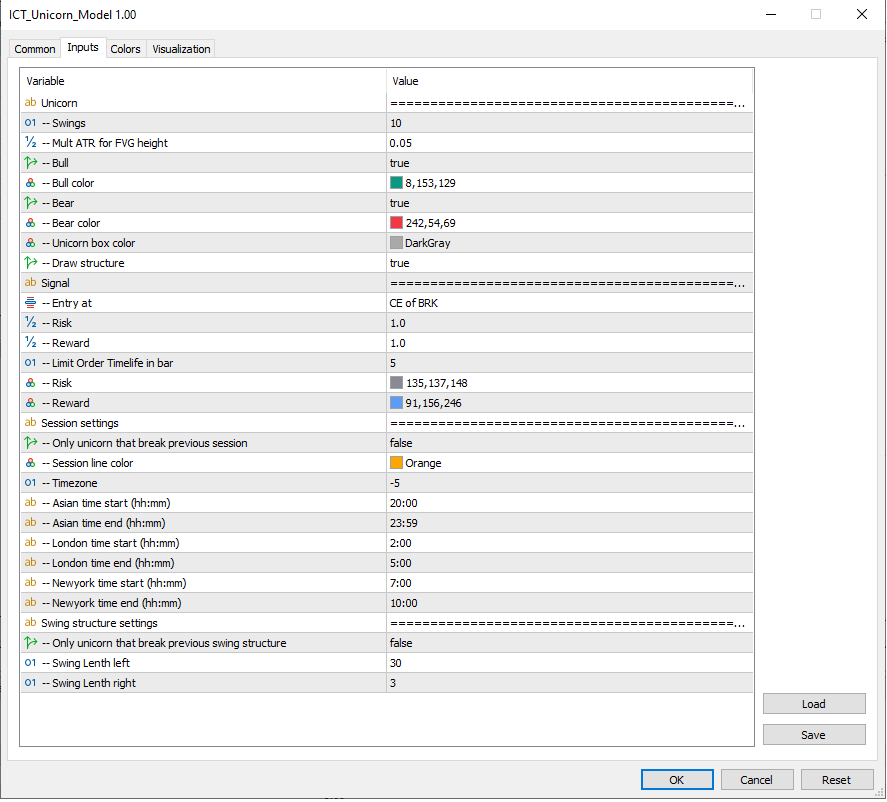
🔶 SETTINGS

🔹 Unicorn
  • Swings: This sets the length of swings, used for the underlying ZigZag and Unicorn Patterns detection.
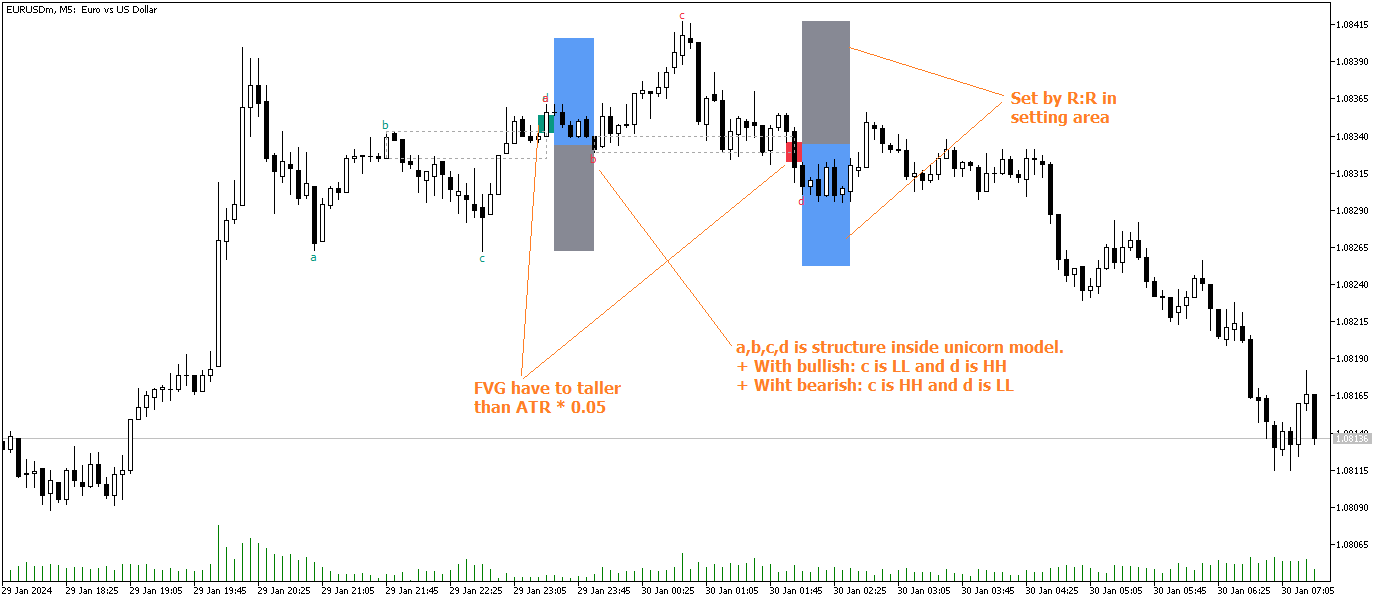
  • Mult ATR for FVG height: FVG is considered valid when its height is greater than the ATR multiplied by this value. Default is 0.05.
  • Bull: Enable/disable Bullish patterns, and set the color of FVG box.
  • Bear: Enable/disable Bearish patterns, and set the color of FVG box.
  • Draw structure: This option allow mark pivot point inside model as a,b,c,d: With bullish model,  c is LL and d is HH; With bearish model, c is HH and d is LL


🔹 Signal

  • Entry at: Choose how entry include:
    1. CE of BRK: 50% of breaker block
    2. Edge of BRK: entry at top of breaker block with bullish model and vice versal
    3. CE of FVG: 50% of fair value gap
    4. Edge of FVG: entry at top of fair value gap with bullish model and vice versal
  • Rish/Reward and its color settings.
  • Limit order timelife (in bar): set how many bar that risk and reward box keep drawing


🔹 Session settings

  • Only model that break previous session: When true, we just care about bullish model have C lower than low of previous session and vice versal. For example, we wait until close asian and just care about bullish model that break lowest of Asian.
  • Other settings include: Timezone, sessions time and color


🔹 Swing Structure settings

  • Only model that break previous swing structure: When true, we just care about bullish model have C lower than previous swing low and vice versal. 
  • Length of swing: include left-hand and right-hand length.

🔶 ALERTs

  1. When unicorn model detected
  2. When model was invalided by time (Depend on  Limit order timelife setting)
  3. When buy/sell signal (price cross entry)

You can setup notification with alert, email, MT5 mobile app or telegram.

🔶 BUFFER

For easy to create EA base on this indicator, we add buffer as following:

0: buff_buy_entry

1: buff_buy_stoploss

2: buff_buy_take profit

//---

3: buff_sell_ent

4: buff_sell_sl

5: buff_sell_tp

Default value =0. When have unicorn signal, the candle will have buffer value as price.


Frequently Asked Questions

Why nothing show on chart when i load inidicator?

https://www.youtube.com/watch?v=hW-KHHvUCWI

How i build signal scan system with this indicator?

https://youtu.be/VlaQJvTQVAw


Produits recommandés
Introduction to X3 Chart Pattern Scanner X3 Cherart Pattern Scanner is the non-repainting and non-lagging indicator detecting X3 chart patterns including Harmonic pattern, Elliott Wave pattern, X3 patterns, and Japanese Candlestick patterns. Historical patterns match with signal patterns. Hence, you can readily develop the solid trading strategy in your chart. More importantly, this superb pattern scanner can detect the optimal pattern of its kind. In addition, you can switch on and off individu
Reversal Pattern Pro
Boonyapagorn Rodvattanajinda
Reversal Patterns Pro Reversal Patterns Pro is a Price Action (PA) analytical tool that scans the reversal patterns.  - Finds and marks the most dependable Japanese candlestick patterns in real-time. - Supports all time frames (Best for Scalping) - Doesn't repaint making it an exceptional indicator for Expert Advisors. Input parameters : - Support & Resistance Mode ( true or false ) for enabling advanced filtering - Donchian Period - RSI Period - RSI Oversold Level - RSI Overbought Level - 
The indicator detects important peaks and troughs (extremes) on the chart. These points can be used to plot support/resistance levels and trend lines, as well as any other graphical analysis. These points can serve as reference points for setting trading orders. The indicator does not redraw . Settings: Size_History  - the size of the calculated history. Num_Candles_Right  - number of candles to the right of the peak or trough. Num_Candles_Left  - number of candles to the left of the pea
Martingal
Andriy Sydoruk
The indicator Martingal works on all currency pairs and on all timeframes. The arrows indicate the optimal input points for the future Martingale averaging, even with a zero exponent. The indicator shows the signal to close the series only if all the previous signals can be closed in the profit. After closing the series in profit, you must immediately open the order in the direction of the signal. Thus, the signal for closing is simultaneously the point of reverse opening to the other side of th
Introduction to Harmonic Volatility Indicator Harmonic Volatility Indicator is the first technical analysis applying the Fibonacci analysis to the financial volatility. Harmonic volatility indicator is another level of price action trading tool, which combines robust Fibonacci ratios (0.618, 0.382, etc.) with volatility. Originally, Harmonic Volatility Indicator was developed to overcome the limitation and the weakness of Gann’s Angle, also known as Gann’s Fan. We have demonstrated that Harmonic
Auto AndrewFork
Noor Ghani Rahman
1 (1)
Auto Pitchfork Indicator The indicator calculate the Pitch fork for the previous Day (Selectable) with multiple Support and Resistance lines from the Median price which acts as Magnet for the Price that if price touch the above warning (1) or below warning (1) lines and not cross up or down then there is maximum possibilities that it will return to the Median Line, and thus maintain the Price Action in Cyclic Pattern to the Market Move. You are able to select how many warning lines you want to k
Indicator plots price cycle blocks and sends signals with smart volume confirmation. Price cycles and fractals are combined to determine the demand/supply blocks. The indicator can be used alone or combined with other Cycle Indicators Inputs: Period: Recommended value is between 35 and 55( Which are Set 1 and Set 2 periods of cycle sniper ) Engulfing: If true, you will be able to see the engulfing bar confirmation. Volume Filter: True (The  arrow comes with volume confirmation ) Videos with dif
Fibolopes (converted from Envelopes) Indicator is based on the Fibonacci sequence. The input parameter FiboNumPeriod is responsible for the number in the integer sequence (0, 1, 1, 2, 3, 5. 8 13, 34, 55, 89...) The indicator will calculate the Main Yellow dot line and 2 bands as a +/- Deviation to it. This indicator is calculating a ZigZag (Aqua line) which combine with Fibolopes together form a system signals for Open (Z crossing Fibolopes) a new position and Close (Z crossing Fibolopes in oppo
SMT Divergence Pro
Suvashish Halder
5 (1)
SMT (Smart Money Technique) Divergence refers to the price divergence between correlated assets or their relationship to inversely correlated assets.  By analyzing SMT Divergence, traders can gain insights into the market's institutional structure and identify whether smart money is accumulating or distributing assets.  Every price fluctuation should be confirmed by market symmetry, and any price asymmetry indicates an SMT Divergence, suggesting a potential trend reversal. MT5 Version -  https:/
Introduction to Fibonacci Volatility Indicator Volatility indicator can help you to detect any statistical advantage for your trading. Especially, if you are trading with Price Action and Price Patterns, then we recommend to use the Volatility indicator together with your strategy. Especically, Fibonacci Volatility indicator combines the market volatiltiy with Fibonacci Analysis to provide you more advanced volatiltiy indicator. Main Features Fibonacci Volatility in Z score Configuration Mode Fi
PZ Wolfe Waves
PZ TRADING SLU
1 (1)
Precision trading: leverage wolfe waves for accurate signals Special Offer: Purchase now to receive free bonuses worth $129! (Read more for details) Wolfe Waves are naturally occurring trading patterns present in all financial markets and represent a fight towards an equilibrium price. These patterns can develop over short and long-term time frames and are one of the most reliable predictive reversal patterns in existence, normally preceding strong and long price movements. [ Installation Guide
Nepsetms45 est un indicateur de scalping forex qui montre au trader les points d'inversion des prix et la direction actuelle de la tendance. La précision des signaux indicateurs est en moyenne de 87 %. Cela suggère que si l'indicateur dessine une flèche sur le graphique, alors avec une probabilité de 87%, le prix ira dans le sens de la flèche d'au moins 20 points ou plus dans un proche avenir. L'indicateur montre également la direction de la tendance et la force du mouvement à l'aide de lignes
>>> BIG SALE PROMOTION: 50% OFF + GIFT EA!  - Promo price: $64 / Regular price $129 <<< - The promotion will end soon! The Forex Trend Tracker is an advanced tool designed to enhance the trading capabilities of forex traders. This sophisticated indicator uses complex mathematical formulas alongside the Average True Range (ATR) to detect the beginnings of new upward and downward trends in the forex market. It offers visual cues and real-time alerts to give traders a competitive advantage in th
Monster Harmonic Indicator
Paul Geirnaerdt
4.61 (31)
Monster Harmonics Indicator is a harmonic pattern indicator. It recognizes Gartley, Bat, Crab, Butterfly, Cypher, White Swan, Black Swan, Shark and several other patterns. Projected patterns that are not yet completed are recognized, too. Monster even shows the PRZ (Potential Reversal Zone). Users can add their own user defined patterns to Monster. Besides the current pattern, Monster also shows all patterns in the symbols history. Monster will provide alerts for developing patterns. Introduced
VR Pivot
Vladimir Pastushak
VR Pivot is an indicator of key pivot points. Pivot points are a special type of support and resistance levels that are used to determine the strongest price zones. Professional traders use pivot levels to determine prices at which there is a high probability of a price reversal. The levels are calculated using special mathematical formulas, which include the closing, opening, high, and low prices of the previous time period. The most effective is the daily period. It is important to note that a
Un modèle de graphique en triangle symétrique représente une période de contraction et de consolidation avant que le prix ne soit forcé de casser à la hausse ou de s'effondrer. Une cassure de la ligne de tendance inférieure marque le début d'une nouvelle tendance baissière, tandis qu'une cassure de la ligne de tendance supérieure indique le début d'une nouvelle tendance haussière. Obtenez le tableau de bord pour surveiller tous les instruments et les délais que vous échangez contre des modèles
All Symbols   AND  All Time frames Scan                                                                                                                 Document Introduction   The ABCD is a basic harmonic pattern. The ABCD pattern is a visual, geometric chart pattern comprised of three consecutive price swings. It looks like a diagonal lightning bolt and can indicate an upcoming trading opp
Forex Indicator  " Hanging Man pattern" for MT4 Indicator  " Hanging Man pattern "  is very powerful indicator for Price Action trading:    No repaint, No delays; Indicator   detects bearish Hanging Man patterns on chart:  Red arrow signal on chart (see pictures) PC, Mobile & Email alerts are included Indicator "Hanging Man pattern" is excellent to combine with Support/Resistance Levels // More great Expert Advisors and Indicators are available here:  https://www.mql5.com/en/users/def1380/seller
UPD1 Profile Levels
Vitaliy Kuznetsov
5 (6)
L'indicateur trouve les niveaux de volume de prix maximum et minimum (profil de marché) sur l'histogramme de travail pour le nombre de barres spécifié.   Profil composite. La hauteur de l'histogramme est entièrement automatique et s'adapte à n'importe quel outil et période. L'algorithme de l'auteur est utilisé et ne répète pas les analogues connus. La hauteur des deux histogrammes est approximativement égale à la hauteur moyenne de la bougie. Smart alert vous permet de vous informer sur le prix
PZ 123 Pattern
PZ TRADING SLU
3.75 (4)
Unlock powerful breakout opportunities The 123 Pattern is one of the most popular, powerful and flexible chart patterns. The pattern is made up of three price points: a bottom, a peak or valley, and a Fibonacci retracement between 38.2% and 71.8%. A pattern is considered valid when the price breaks beyond the last peak or valley, moment at which the indicator plots an arrow, rises an alert, and the trade can be placed. [ Installation Guide | Update Guide | Troubleshooting | FAQ | All Products ]
Fibonacci calculator is used with Elliot Waves, it can generate remarkable results. A trader could use these levels or ratios to find high probability trades with very small stop loss. You may also use these ratios to find Elliott Waves extensions and to book profit near those levels. For Elliot Wave experts, Fibonacci calculator is a highly useful tool that can assist them in calculating Fibonacci extension and retracement levels for the market price. The indicator proves itself as a useful one
Very special indicator of Joe Dinapoli which is a derivative  of a Detrended Oscillator. Through a set of parametric equations, a predicting oscillator is created that forecasts, one period ahead of time, overbought and oversold conditions. The resulting predictor values are expressed as bands on the bar chart, both above and below the market. It may be mistaken as a Bollinger Band but has no resemblance to it whatsoever. The Predictor bands may be used in a variety of ways to aid in entering an
This is the Full Version, to get the free version please contact me. The free version works on “GBPCHF” charts. All symbols and time frames scanner. Harmonic Pattern Harmonic patterns are used in technical analysis that traders use to find trend reversals. They are considered one of the most accurate technical analysis tools, as they allow traders to predict the future price movement direction and the potential trend targets. Also, unlike many other technical tools, the number of false signal
Индикатор ищет подобную ценовую структуру, сравнивая с последней ценовой структурой. Размер паттерна (грубо говоря количество переломов зигзага) настраивается (всегда меньше на 1, чем введено - нулевой перелом не считается). Все найденные совпадения отмечаются прямоугольником. Так же к паттернам существует быстрая навигация с помощью кнопочек "Next patt" и "Prev patt". В индикатор вшиты два индикатора типа ЗигЗа г : стандартный зигзаг и пользовательский , моей разработки. Параметры настройки ста
harmonic patterns   Harmonic patterns can be used to spot new trading opportunities and pricing trends – but only if you know exactly what you are looking for. Harmonic patterns are formed by combining geometric shapes and Fibonacci levels. As a result, Fibonacci levels are the key concept of these patterns. Identifying harmonic patterns requires more practice than other market classical patterns. But by learning these patterns, you can recognize the future trend of the price chart. These patter
Mean Reversion Supply Demand Indicator Mean Reversion Supply Demand is the indicator to detect the important supply demand zone in your chart. The concept of supply demand trading relies on the quantity mismatching between buying and selling volumes in the financial market. Typically, supply demand zone serves to predict the turning point. The wave pattern, for any supply demand zone to work as an successful trade, looks like the price must touch the base zone, move away and then return to zone
Channel Vertex is a price action pattern formed by price Chanel and a triangle pattern . Price channels basically indicates possible support and resistance zones around a price movement and retracement    or breakout at these levels can indicate possible trend continuation or reversal .  Majority of the times price fluctuations forms triangle patterns defined by 3 vertexes , these triangle patterns most times defines a trend continuation.  A triangle pattern is a trend continuation pattern tha
Price pivot points
Andrey Kozak
3.8 (5)
An indicator that shows price reversal points on the chart. Using RSI and other standard indicators, the indicator determines the price reversal points and shows them on the chart with arrows. The indicator does not redraw its values ​​and in 95% of cases it shows accurate signals. This indicator works on all currency pairs and all timeframes. How to trade with this indicator (recommendations): We recommend opening trades in the direction of the arrow that appears. If a blue arrow appears, op
PW Oscillator
Svyatoslav Kucher
PW Oscillator   - индикатор предназначенный для поиска локальных экстремумов, определения текущей тенденции. В расчетах индикатора используется авторская методика. С помощью индикатора можно определять места возможного разворота цены желательно в направлении тенденции, но также с достаточной точностью и против нее. Также с помощью индикатора можно определять текущую тенденцию. Индикатор подходит для любых валютных пар, но для адекватного отображения показания необходимо, чтобы было достаточно ис
Introduction This indicator detects volume spread patterns for buy and sell opportunity. The patterns include demand and supply patterns. You might use each pattern for trading. However, these patterns are best used to detect the demand zone (=accumulation area) and supply zone (=distribution area). Demand pattern indicates generally potential buying opportunity. Supply pattern indicates generally potential selling opportunity. These are the underlying patterns rather than direct price action. T
FREE
Les acheteurs de ce produit ont également acheté
Gold Stuff
Vasiliy Strukov
4.9 (270)
Gold Stuff est un indicateur de tendance conçu spécifiquement pour l'or et peut également être utilisé sur n'importe quel instrument financier. L'indicateur ne se redessine pas et ne traîne pas. Délai recommandé H1. Au niveau de l'indicateur de travail, l'Expert Advisor EA Gold Stuff est entièrement automatique. Vous pouvez le trouver sur mon profil. Vous pouvez obtenir une copie gratuite de notre indicateur Strong Support et Trend Scanner, veuillez envoyer un message privé. moi! Contactez
VEUILLEZ LIRE LES INFORMATIONS CI-DESSOUS AVANT D'ACHETER LE PRODUIT! Apollo Pips PLUS SP est un produit unique! C'EST POUR CEUX QUI VEULENT OBTENIR MON NOUVEL INDICATEUR "APOLLO PIPS" PLUS BONUS "SUPER PACK" AVEC ACCÈS À TOUS MES INDICATEURS DE TRADING! En achetant le produit Apollo Pips PLUS SP, vous achetez en fait une toute nouvelle version de mon indicateur Apollo Pips. Cette version de l'indicateur dispose d'un algorithme amélioré et d'un paramètre facile à utiliser qui vous donne la possi
Scalper Inside PRO
Alexey Minkov
4.75 (60)
An exclusive indicator that utilizes an innovative algorithm to swiftly and accurately determine the market trend. The indicator automatically calculates opening, closing, and profit levels, providing detailed trading statistics. With these features, you can choose the most appropriate trading instrument for the current market conditions. Additionally, you can easily integrate your own arrow indicators into Scalper Inside Pro to quickly evaluate their statistics and profitability. Scalper Inside
Trend Pulse
Mohamed Hassan
5 (5)
Please contact me after purchase to immediately get your PDF strategy + documentation for Trend Pulse !  Official release price of $89  (2 /50 copies left). Next price is $199 . Introducing Trend Pulse , a unique and robust indicator capable of detecting bullish, bearish, and even ranging trends! Trend Pulse uses a special algorithm to filter out market noise with real precision. If the current symbol is moving sideways, Trend Pulse will send you a ranging signal, letting you know that it'
FX Power MT4 NG
Daniel Stein
5 (13)
Obtenez votre mise à jour quotidienne du marché avec des détails et des captures d'écran via notre Morning Briefing ici sur mql5 et sur Telegram ! FX Power MT4 NG est la nouvelle génération de notre très populaire indicateur de force des devises, FX Power. Et qu'est-ce que ce compteur de force de nouvelle génération offre ? Tout ce que vous avez aimé de l'original FX Power PLUS Analyse de la force de l'OR/XAU Des résultats de calcul encore plus précis Périodes d'analyse configurables individuel
TPSproTREND PrO
Roman Podpora
4.79 (19)
TPSpro TREND PRO   est un indicateur de tendance qui analyse automatiquement le marché et fournit des informations sur la tendance et chacun de ses changements, ainsi que des signaux pour entrer dans des transactions sans redessiner ! L'indicateur utilise chaque bougie et les analyse séparément. faisant référence à différentes impulsions - impulsion ascendante ou descendante. Points d'entrée précis dans les transactions sur les devises, les crypto-monnaies, les métaux, les actions, les indices 
Atomic Analyst
Issam Kassas
5 (3)
Tout d'abord, il convient de souligner que cet indicateur de trading n'est ni repainting, ni redrawing et ne présente aucun délai, ce qui le rend idéal à la fois pour le trading manuel et automatisé. Manuel de l'utilisateur : réglages, entrées et stratégie. L'Analyste Atomique est un indicateur d'action sur les prix PA qui utilise la force et le momentum du prix pour trouver un meilleur avantage sur le marché. Équipé de filtres avancés qui aident à éliminer les bruits et les faux signaux, et à
Gold Channel is a volatility-based indicator, developed with a specific timing algorithm for the XAUUSD pair, which consists of finding possible corrections in the market. This indicator shows two outer lines, an inner line (retracement line) and an arrow sign, where the theory of the channel is to help identify overbought and oversold conditions in the market. The market price will generally fall between the boundaries of the channel. If prices touch or move outside the channel it is a tra
Actuellement 20% de réduction ! La meilleure solution pour tout débutant ou trader expert ! Ce logiciel de tableau de bord fonctionne sur 28 paires de devises. Il est basé sur 2 de nos principaux indicateurs (Advanced Currency Strength 28 et Advanced Currency Impulse). Il donne un excellent aperçu de l'ensemble du marché Forex. Il montre les valeurs de l'Advanced Currency Strength, la vitesse de mouvement des devises et les signaux pour 28 paires de devises dans tous les (9) délais. Imagine
PZ Day Trading
PZ TRADING SLU
3.67 (3)
Effortless trading: non-repainting indicator for accurate price reversals Special Offer: Purchase now to receive free bonuses worth $189! (Read more for details) This indicator detects price reversals in a zig-zag fashion, using only price action analysis and a donchian channel. It has been specifically designed for short-term trading, without repainting or backpainting at all. It is a fantastic tool for shrewd traders aiming to increase the timing of their operations. [ Installation Guide | Up
Clear Breakout
Martin Alejandro Bamonte
5 (1)
L'indicateur "Breakout Buy-Sell" est conçu pour identifier et mettre en évidence des opportunités d'achat et de vente potentielles basées sur les ruptures de prix pendant différentes sessions de marché (Tokyo, Londres et New York). Cet indicateur aide les traders à visualiser clairement les zones d'achat et de vente, ainsi que les niveaux de take-profit (TP) et de stop-loss (SL). Stratégie d'utilisation L'indicateur peut être utilisé comme suit : Configuration initiale : Sélectionnez la session
ACTUELLEMENT 26% DE RÉDUCTION La meilleure solution pour tout débutant ou trader expert ! Cet indicateur est un outil de trading unique, de haute qualité et abordable car nous avons incorporé un certain nombre de caractéristiques exclusives et une nouvelle formule. Avec seulement UN graphique, vous pouvez lire la force de la devise pour 28 paires Forex ! Imaginez comment votre trading va s'améliorer parce que vous êtes capable de repérer le point de déclenchement exact d'une nouvelle tendan
Le système PRO Renko est un système de trading très précis spécialement conçu pour le trading de graphiques RENKO. Il s'agit d'un système universel qui peut être appliqué à divers instruments de négociation. Le système neutralise efficacement ce qu'on appelle le bruit du marché en vous donnant accès à des signaux d'inversion précis. L'indicateur est très facile à utiliser et n'a qu'un seul paramètre responsable de la génération du signal. Vous pouvez facilement adapter l'outil à n'importe q
ACTUELLEMENT 31% DE RÉDUCTION ! ! La meilleure solution pour tout débutant ou Expert Trader ! Cet indicateur est un outil de trading unique, de haute qualité et abordable car nous avons incorporé un certain nombre de caractéristiques exclusives et une formule secrète. Avec seulement UN graphique, il donne des alertes pour les 28 paires de devises. Imaginez comment votre trading s'améliorera parce que vous serez capable de repérer le point de déclenchement exact d'une nouvelle tendance ou d'
Advanced Supply Demand
Bernhard Schweigert
4.9 (314)
CURRENTLY 26% OFF !! Best Solution for any Newbie or Expert Trader! This indicator is a unique, high quality and affordable trading tool because we have incorporated a number of proprietary features and a new formula. With this update, you will be able to show double timeframe zones. You will not only be able to show a higher TF but to show both, the chart TF, PLUS the higher TF: SHOWING NESTED ZONES. All Supply Demand traders will love it. :) Important Information Revealed Maximize the potenti
NAM Order Blocks
NAM TECH GROUP, CORP.
5 (1)
MT4 Multi-timeframe Order Blocks detection indicator. Features - Fully customizable on chart control panel, provides complete interaction. - Hide and show control panel wherever you want. - Detect OBs on multiple timeframes. - Select OBs quantity to display. - Different OBs user interface. - Different filters on OBs. - OB proximity alert. - ADR High and Low lines. - Notification service (Screen alerts | Push notifications). Summary Order block is a market behavior that indicates order collection
Enigmera
Ivan Stefanov
5 (4)
ENIGMERA : Le cœur du marché https://www.enigmera.com Introduction Cet indicateur et ce système de trading constituent une approche remarquable des marchés financiers. ENIGMERA utilise les cycles fractals pour calculer avec précision les niveaux de support et de résistance. Il indique la phase d'accumulation authentique et donne une direction et des objectifs.  Un système qui fonctionne que nous soyons dans une tendance ou une correction.  Comment fonctionne-t-il ? ENIGMERA comprend trois l
PZ Trend Trading
PZ TRADING SLU
4.8 (5)
Capture every opportunity: your go-to indicator for profitable trend trading Special Offer: Purchase now to receive free bonuses worth $159! (Read more for details) Trend Trading is an indicator designed to profit as much as possible from trends taking place in the market, by timing pullbacks and breakouts. It finds trading opportunities by analyzing what the price is doing during established trends. [ Installation Guide | Update Guide | Troubleshooting | FAQ | All Products ] Trade financial
TPSpro RFI Levels
Roman Podpora
4.83 (24)
Reversal First Impulse levels (RFI)    INSTRUCTIONS        RUS       -       ENG              R ecommended to use with an indicator   -   TPSpro  TREND PRO -  Version MT5 A key element in trading is zones or levels from which decisions to buy or sell a trading instrument are made. Despite attempts by major players to conceal their presence in the market, they inevitably leave traces. Our task was to learn how to identify these traces and interpret them correctly. Main functions: Displaying activ
Order Block Hunter
Noha Mohamed Fathy Younes Badr
5 (2)
Order block hunter indicator is the best indicator for  hunt the order blocks that area where there has been a large concentration of limit orders waiting to be executed Order blocks are identified on a chart by observing previous price action and looking for areas where the price experienced significant movement or sudden changes in direction .This indicator does that for you by using very complicated codes and helps you to take the best areas To buy and sell because it make marks at the best a
Backtest and Read Overview before purchase. Chart patterns have been a topic of debate among traders; some believe they are reliable signalers, while others do not. Our Chart Patterns All-in-One indicator displays various chart patterns to help you test these theories for yourself. The profitability of these patterns is not a reflection of the indicator's effectiveness but rather an evaluation of the patterns themselves. The Chart Patterns All-in-One indicator is an excellent tool for visualizin
ALERTE D'ACHAT ET DE VENTE MULTIDEVISES et MULTITIMEFRAME. AUTO TRAILING STOP ET RÉCOMPENSE DE RISQUE TAKEPROFIT ! L'INDICATEUR SCANNE ET ANALISE LE MARCHÉ POUR QUE VOUS N'AVEZ RIEN À FAIRE ! NÉGOCIEZ TOUTES VOS DEVISES SUR UN GRAPHIQUE !   Après l'achat veuillez laisser un commentaire, contactez-moi et je vous enverrai l'assistant commercial EA. L'indicateur utilise plusieurs oscillateurs et filtres associés pour trouver les meilleurs points d'entrée CONFIRMÉS afin que vous n'ayez pas à
Connect Indicator
Sukunthakan Ngernbamrung
Connect Indicator is a tool used for connecting indicators between the MQL market and MT4. The connected indicators are made by our group and can be used for other applications, such as sending messages to the Line application or Telegram application. If you have any questions, please don't hesitate to ask us to receive support. Function and indicator buffer Buffer one is the high price of the previous candle. Buffer two is the high price of the previous candle. Usage To connect indicators to fu
Entry Points Pro
Yury Orlov
4.7 (226)
Indicateur supérieur pour MT4 fournissant des signaux précis pour entrer dans un trade sans repeindre ! Il peut être appliqué à tous les actifs financiers : forex, cryptocurrencies, métaux, actions, indices.  La version MT5 est ici Il fournira des signaux de trading assez précis et vous dira quand il est préférable d'ouvrir un trade et de le fermer. Regardez la vidéo (6:22) avec un exemple de traitement d'un seul signal qui a rapporté à l'indicateur ! La plupart des traders améliorent l
Volatility Trend System - un système de trading qui donne des signaux pour les entrées. Le système de volatilité donne des signaux linéaires et ponctuels dans le sens de la tendance, ainsi que des signaux pour en sortir, sans redessiner ni retarder. L'indicateur de tendance surveille la direction de la tendance à moyen terme, montre la direction et son changement. L'indicateur de signal est basé sur les changements de volatilité et montre les entrées sur le marché. L'indicateur est équipé de
TPA True Price Action indicator reveals the true price action of the market makers through 100% non-repainting signals (except early signals mode) strictly at the close of a candle! TPA shows entries and re-entries, every time the bulls are definitely stronger than the bears and vice versa. Not to confuse with red/green candles. The shift of power gets confirmed at the earliest stage and is ONE exit strategy of several. There are available now two free parts of the TPA User Guide for our custo
Currency Strength Exotics
Bernhard Schweigert
4.88 (33)
ACTUELLEMENT 20% DE RÉDUCTION ! La meilleure solution pour tout débutant ou trader expert ! Cet indicateur est spécialisé pour montrer la force de la devise pour tous les symboles comme les paires exotiques, les matières premières, les indices ou les contrats à terme. C'est le premier de son genre, n'importe quel symbole peut être ajouté à la 9ème ligne pour montrer la force réelle de la devise de l'or, l'argent, le pétrole, DAX, US30, MXN, TRY, CNH etc. Il s'agit d'un outil de trading uniq
L'indicateur indique les points d'entrée et de sortie les plus appropriés. Il affiche également des données statistiques sur tous les signaux pour une meilleure analyse du trading. Grâce à cet indicateur, vous pourrez mieux comprendre le marché. Dès que la puissance de la tendance commence à s'affaiblir (ce qui sera indiqué sur le panneau), la ligne de tendance gravitera vers la position horizontale - c'est le signal pour sortir du trade. Vous pouvez également sortir lorsque le niveau de pro
RelicusRoad Pro
Relicus LLC
4.73 (141)
Maintenant 147 $ (augmentant à 499 $ après quelques mises à jour) - Comptes illimités (PCS ou Mac) Manuel d'utilisation RelicusRoad + Vidéos de formation + Accès au groupe Discord privé + Statut VIP UNE NOUVELLE FAÇON DE REGARDER LE MARCHÉ RelicusRoad est l'indicateur de trading le plus puissant au monde pour le forex, les contrats à terme, les crypto-monnaies, les actions et les indices, offrant aux traders toutes les informations et tous les outils dont ils ont besoin pour rester renta
TakePropips Donchian Trend Pro
Eric John Pajarillaga Aldana
4.61 (18)
TakePropips Donchian Trend Pro   (MT4) est un outil puissant et efficace qui détecte automatiquement la direction de la tendance à l'aide du canal Donchian et vous fournit des signaux de trading d'entrée et de sortie ! Cet indicateur multifonction comprend un scanner de tendance, des signaux de trading, un panneau statistique, un filtre, des sessions de trading et un tableau de bord de l'historique des alertes. Il est conçu pour vous fournir des signaux de trading et vous faire gagner des heures
Plus de l'auteur
This indicator provides the ability to recognize the SMC pattern, essentially a condensed version of the Wyckoff model. Once the pattern is confirmed by RTO, it represents a significant investment opportunity.    There are numerous indicators related to SMC beyond the market, but this is the first indicator to leverage patterns to identify specific actions of BigBoy to  navigate the market. Upgrade 2024-03-08: Add TP by RR feature. The SMC (Smart Money Concept)   pattern   is a market analysis m
OVERVIEW A Lorentzian Distance Classifier (LDC) is a Machine Learning classification algorithm capable of categorizing historical data from a multi-dimensional feature space. This indicator demonstrates how Lorentzian Classification can also be used to predict the direction of future price movements when used as the distance metric for a novel implementation of an Approximate Nearest Neighbors (ANN) algorithm. This indicator provide signal as buffer, so very easy for create EA from this in
The liquidity swings indicator highlights swing areas with existent trading activity. The number of times price revisited a swing area is highlighted by a zone delimiting the swing areas. Additionally, the accumulated volume within swing areas is highlighted by labels on the chart. An option to filter out swing areas with volume/counts not reaching a user-set threshold is also included. This indicator by its very nature is not real-time and is meant for descriptive analysis alongside other c
This all-in-one indicator displays real-time market structure (internal & swing BOS / CHoCH), order blocks, premium & discount zones, equal highs & lows, and much more...allowing traders to automatically mark up their charts with widely used price action methodologies. Following the release of our Fair Value Gap script, we received numerous requests from our community to release more features in the same category. //------------------------------------// Version 1.x has missing functions + PDAr
The indicator   returning pivot point based trendlines with highlighted breakouts . Trendline caculated by pivot point and other clue are ATR, Stdev.   The indicator also includes integrated alerts for  trendlines  breakouts   and foward message to Telegram channel or group if you want. Settings ·            Lookback bar: Default 200 is number of bar caculate when init indicator. ·            Length:  Pivot points  period ·            Slope Calculation Method: Determines how this lope is calcula
This indicator builds upon the previously posted Nadaraya-Watson Estimator. Here we have created an envelope indicator based on kernel smoothing with integrated alerts from crosses between the price and envelope extremities. Unlike the Nadaraya-Watson Estimator, this indicator follows a contrarian methodology. Please note that the indicator is subject to repainting. The triangle labels are designed so that the indicator remains useful in real-time applications. Settings Window Size: Dete
This all-in-one indicator displays real-time market structure (internal & swing BOS / CHoCH), order blocks, premium & discount zones, equal highs & lows, and much more...allowing traders to automatically mark up their charts with widely used price action methodologies. Following the release of our Fair Value Gap script, we received numerous requests from our community to release more features in the same category. "Smart Money Concepts" (SMC) is a fairly new yet widely used term amongst price a
This indicator presents an alternative approach to identify Market Structure. The logic used is derived from learning material created by   DaveTeaches (on X) When quantifying Market Structure, it is common to use fractal highs and lows to identify "significant" swing pivots. When price closes through these pivots, we may identify a Market Structure Shift (MSS) for reversals or a Break of Structure (BOS) for continuations. The main difference with this "protected" logic is in how we determine
The ICT Silver Bullet indicator is inspired from the lectures of "The Inner Circle Trader" (ICT) and highlights the Silver Bullet (SB) window which is a specific 1-hour interval where a Fair Value Gap (FVG) pattern can be formed. A detail document about ICT Silver Bullet   here . There are 3 different Silver Bullet windows (New York local time): The London Open Silver Bullet (3 AM — 4 AM ~ 03:00 — 04:00) The AM Session Silver Bullet (10 AM — 11 AM ~ 10:00 — 11:00) The PM Session Silver Bulle
The ICT Concepts indicator regroups core concepts highlighted by trader and educator "The Inner Circle Trader" (ICT) into an all-in-one toolkit. Features include Market Structure (MSS & BOS), Order Blocks, Imbalances, Buyside/Sellside Liquidity, Displacements, ICT Killzones, and New Week/Day Opening Gaps. It’s one kind of Smart money concepts.   USAGE:   Please read this   document  !      DETAILS Market Structure Market structure labels are constructed from price breaking a prior extreme
The Buyside & Sellside Liquidity indicator aims to detect & highlight the first and arguably most important concept within the ICT trading methodology,   Liquidity   levels. SETTINGS Liquidity Levels Detection Length: Lookback period Margin: Sets margin/sensitivity for a liquidity level detection Liquidity Zones Buyside Liquidity Zones: Enables display of the buyside liquidity zones. Margin: Sets margin/sensitivity for the liquidity zone boundaries. Color: Color option
This is a Forex Scalping Trading Sytem based on the Bollinger Bands.  Pairs:Major Time frame: 1M or higher. Spread max:0,0001.  Indicators (just suggestion) Bollinger bands (20, 2); ADX (14 period); RSI   (7 period ). Y ou should only trade this system between 2am to 5am EST, 8am to 12am EST and 7.30pm to 10pm EST. Do not scalp 30 minutes before a orange or red news  report and not for a hour afterwards.   Setup: is for price to move above the lower or lower Bollinger Bands, RSI raise above the
FREE
ICT Concepts
Minh Truong Pham
5 (2)
The ICT Concepts indicator regroups core concepts highlighted by trader and educator "The Inner Circle Trader" (ICT) into an all-in-one toolkit. Features include Market Structure (MSS & BOS), Order Blocks, Imbalances, Buyside/Sellside Liquidity, Displacements, ICT Killzones, and New Week/Day Opening Gaps. It’s one kind of Smart money concepts. USAGE: Please read this document  !    DETAILS Market Structure Market structure labels are constructed from price breaking a prior extreme point. T
The Inversion Fair Value Gaps (IFVG) indicator is based on the inversion FVG concept by ICT and provides support and resistance zones based on mitigated Fair Value Gaps (FVGs). Image 1   USAGE Once mitigation of an FVG occurs, we detect the zone as an "Inverted FVG". This would now be looked upon for potential support or resistance. Mitigation occurs when the price closes above or below the FVG area in the opposite direction of its bias. (Image 2) Inverted Bullish FVGs Turn into P
Detect divergence (classic, hidden) price and all oscillator indicator include: RSI, CCI, MACD, OSMA, Stochastic, Momentum, Awesome Oscillator (AO), Accelerator Oscillator (AC), Williams Percent Range (WPR), Relative Vigor Index (RVI), Rate of Change (ROC). Confirm reversal with dochian channel for to improve signal quality. Divergence is when the price of an asset is moving in the opposite direction of a technical   indicator , such as an oscillator, or is moving contrary to other data. Diverge
This is addition of  Effective SV squeeze momentum  that add bolliger band and Keltner channel to chart window.  Squeeze momentum introduced by “John Carter”, the squeeze indicator for MT5 represents a volatility-based tool. Regardless, we can also consider the squeeze indicator as a momentum indicator, as many traders use it to identify the direction and strength of price moves. In fact, the Tradingview  squeeze indicator shows when a financial instrument is willing to change from a trending ma
FREE
All about Smart Money Concepts Strategy: Market struture: internal or swing BOS, CHoCH; Orderblock; Liquity equal; Fair Value Gap with Consequent encroachment, Balanced price range; Level with Previous month, week, day level or in day level (PMH, PWH, PDH, HOD); BuySell Stops Liquidity (BSL, SSL); Liquidity Void Long Wicks; Premium and Discount; Candle pattern ... "Smart Money Concepts" ( SMC ) is a fairly new yet widely used term amongst price action traders looking to more accurately navigate
A problem when indicator call webrequest is "The WebRequest() function is synchronous, which means its breaks the program execution and waits for the response from the requested server. Since the delays in receiving a response can be large, the function is not available for calls from indicators, because indicators run in a common thread shared by all indicators and charts on one symbol. Indicator performance delay on one of the charts of a symbol may stop updating of all charts of the same symb
FREE
Here’s the problem: the default zigzag indicator given in MT5 trading platform does not really capture the most of the highs and lows on chart do draw zigzags. On chart below, notice that some of ther high, low of price have been missed to draw zigzags by this default zigzag indicator (picture 1). It is not so apparent until you compare default zigzag indicator to this SwingZZ indicator. Have a look on picture 2 and 3. The swing zigzag indicator is best because it captures most of the swing high
The Bheurekso Pattern Indicator for MT5 helps traders automatically identify candlestick pattern that formed on the chart base on some japanese candle pattern and other indicator to improve accurate. This indicator scans all candles, recognizes and then displays any candle patterns formed on the chart. The candle displayed can be Bullish or Bearish Engulfing, Bullish or Bearish Harami, and so on. There are some free version now but almost that is repaint and lack off alert function. With this ve
This script automatically calculates and updates ICT's daily IPDA look back time intervals and their respective discount / equilibrium / premium, so you don't have to :) IPDA stands for Interbank Price Delivery Algorithm. Said algorithm appears to be referencing the past 20, 40, and 60 days intervals as points of reference to define ranges and related PD arrays. Intraday traders can find most value in the 20 Day Look Back box, by observing imbalances and points of interest. Longer term traders c
Introducing the Reversal and Breakout Signals   This innovative tool is crafted to enhance your chart analysis by identifying potential reversal and breakout opportunities directly on your charts. It's designed with both novice and experienced traders in mind, providing intuitive visual cues for better decision-making. Let's dive into the key features and how it operates: ###   Key Features:   Dynamic Period Settings:   Customize the sensitivity of the indicator with use
The ICT Silver Bullet indicator is inspired from the lectures of "The Inner Circle Trader" (ICT) and highlights the Silver Bullet (SB) window which is a specific 1-hour interval where a Fair Value Gap (FVG) pattern can be formed. A detail document about ICT Silver Bullet here . There are 3 different Silver Bullet windows (New York local time): The London Open Silver Bullet (3 AM — 4 AM ~ 03:00 — 04:00) The AM Session Silver Bullet (10 AM — 11 AM ~ 10:00 — 11:00) The PM Session Silver Bullet
Introduction "Smart money" is money invested by knowledgeable individuals at the right time, and this investment can yield the highest returns. The concept we focus on in this indicator is whether the market is in an uptrend or downtrend. The market briefly takes a weak and reversal trend with "Minor BoS" without being able to break the major pivot. In the next step, it returns to its main trend with a strong bullish move and continues its trend with a "Major BoS". The "order bloc
Overview The   Volume SuperTrend AI   is an advanced technical indicator used to predict trends in price movements by utilizing a combination of traditional SuperTrend calculation and AI techniques, particularly the k-nearest neighbors (KNN) algorithm. The Volume SuperTrend AI is designed to provide traders with insights into potential market trends, using both volume-weighted moving averages (VWMA) and the k-nearest neighbors (KNN) algorithm. By combining these approaches, the indicat
Introduction The Price Action, styled as the "Smart Money Concept" or "SMC," was introduced by Mr. David J. Crouch in 2000 and is one of the most modern technical styles in the financial world. In financial markets, Smart Money refers to capital controlled by major market players (central banks, funds, etc.), and these traders can accurately predict market trends and achieve the highest profits. In the "Smart Money" style, various types of "order blocks" can be traded. This indicator
Breaker Blocks with Signals
Minh Truong Pham
3.67 (3)
The Breaker Blocks with Signals indicator aims to highlight a complete methodology based on breaker blocks. Breakout signals between the price and breaker blocks are highlighted and premium/discount swing levels are included to provide potential take profit/stop loss levels. This script also includes alerts for each signal highlighted.   SETTINGS   Breaker Blocks Length: Sensitivity of the detected swings used to construct breaker blocks. Higher values will return longer te
The FollowLine indicator is a trend following indicator. The blue/red lines are activated when the price closes above the upper Bollinger band or below the lower one. Once the trigger of the trend direction is made, the FollowLine will be placed at High or Low (depending of the trend). An ATR filter can be selected to place the line at a more distance level than the normal mode settled at candles Highs/Lows. Some features: + Trend detech + Reversal signal + Alert teminar / mobile app
This indicator shows when user set sessions are active and returns various tools + metrics using the closing price within active sessions as an input. Users have the option to change up to 4 session times. The indicator will increasingly lack accuracy when the chart timeframe is higher than 1 hour. Settings Sessions Enable Session: Allows to enable or disable all associated elements with a specific user set session. Session Time: Opening and closing times of the user set session
The SuperTrend AI indicator is a novel take on bridging the gap between the K-means clustering machine learning method & technical indicators. In this case, we apply K-Means clustering to the famous SuperTrend indicator.   USAGE Users can interpret the SuperTrend AI trailing stop similarly to the regular SuperTrend indicator. Using higher minimum/maximum factors will return longer-term signals. (image 1) The displayed performance metrics displayed on each signal allow for a deeper interpretat
Filtrer:
Aucun avis
Répondre à l'avis
Version 1.6 2024.07.06
Fix typo
Version 1.5 2024.07.01
Add backtest panel
Add FVG valid option:
+ FVG have to overlap with BRK
+ or Closet FVG
Add adjut by point for: (+ show greed, - show fear)
+ Entry
+ SL
+ TP
+++ For example: set Ajust entry = 1, adjust sl=2, adjust tp=4. If market with buy entry at 1.0007, st at 1.0000, tp at 1.0010
+++ THEN real
entry is 1.0007-1=1.0006
sl is 1.0000 +2=1.0002
tp is 1.0010 +4 =1.0014
Version 1.4 2024.02.16
add buffer for historical candle
Version 1.3 2024.02.15
Add buffer as following:

0: buff_buy_entry
1: buff_buy_stoploss
2: buff_buy_take profit
//---
3: buff_sell_ent
4: buff_sell_sl
5: buff_sell_tp

Default value =0. When have unicorn signal, the candle will have buffer value as price.