Liquidation Estimates ICT
- Indicateurs
- Minh Truong Pham
- Version: 1.0
- Activations: 5
The Liquidation Estimates (Real-Time) experimental indicator attempts to highlight real-time long and short liquidations on all timeframes. Here with liquidations, we refer to the process of forcibly closing a trader's position in the market.
By analyzing liquidation data, traders can gauge market sentiment, identify potential support and resistance levels, identify potential trend reversals, and make informed decisions about entry and exit points.
🔶 USAGE
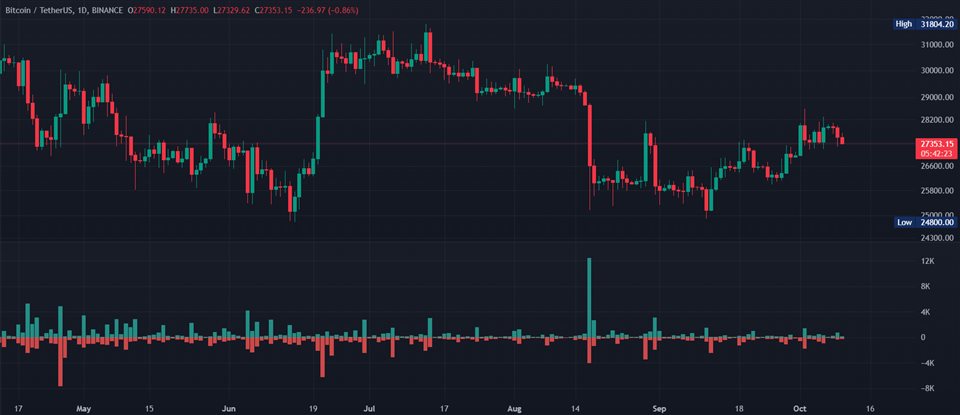
(Img 1) Liquidation refers to the process of forcibly closing a trader's position. It occurs when a trader's margin account can no longer support their open positions due to significant losses or a lack of sufficient margin to meet the maintenance requirements.
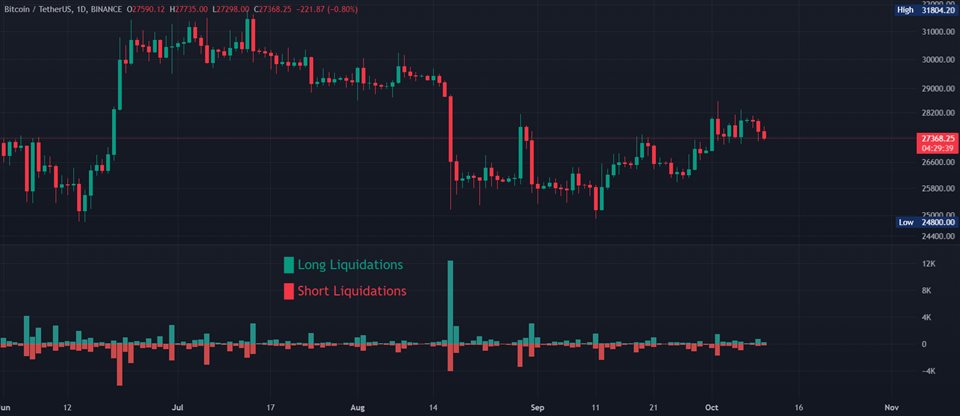
(Img 2) Liquidations can be categorized as either a long liquidation or a short liquidation. A long liquidation is a situation where long positions are being liquidated, while short liquidation is a situation where short positions are being liquidated.
The green bars indicate long liquidations – meaning the number of long positions liquidated in the market. Typically, long liquidations occur when there is a sudden drop in the asset price that is being traded. This is because traders who were bullish on the asset and had opened long positions on the same will now face losses since the market has moved against them.
Similarly, the red bars indicate short liquidations – meaning the number of short positions liquidated in the futures market. Short liquidations occur when there is a sudden spike in the price of the asset that is being traded. This is because traders who were bearish on the asset and had opened short positions will now face losses since the market has moved against them.
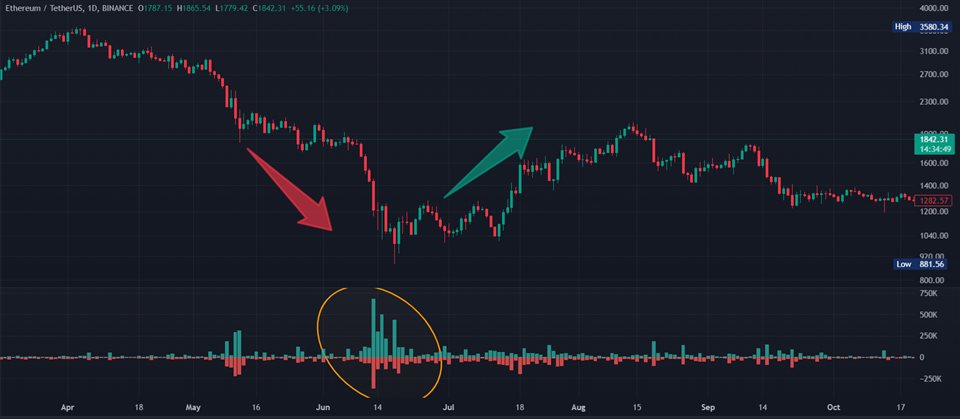
(Img 3) Liquidation patterns or clusters of liquidations could indicate potential trend reversals.
🔹Dominance
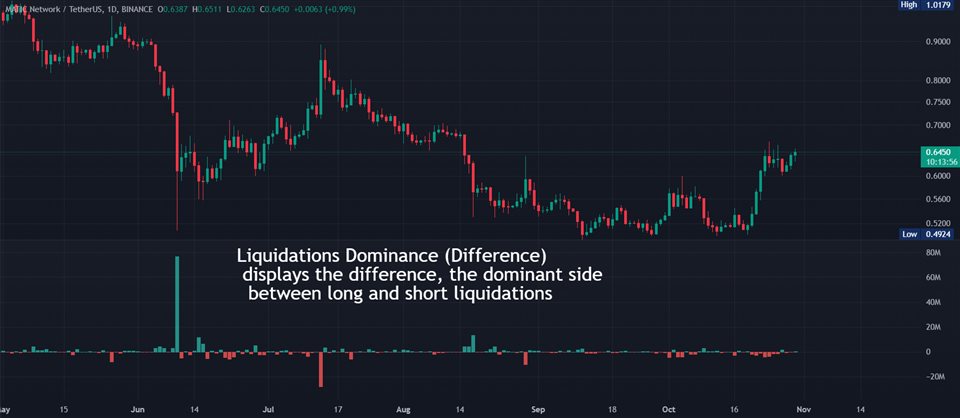
Liquidation dominance (Difference) displays the difference between long and short liquidations, aiming to help identify the dominant side. (img 4)
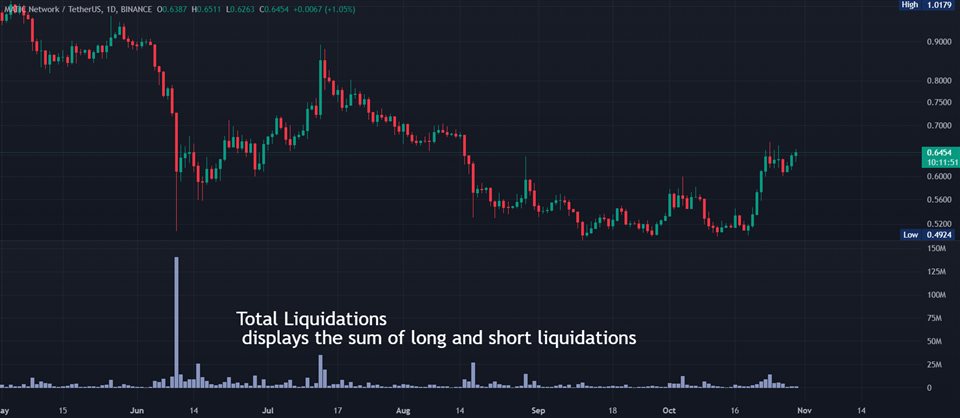
🔹Total Liquidations
Total liquidations display the sum of long and short liquidations. (img 5)
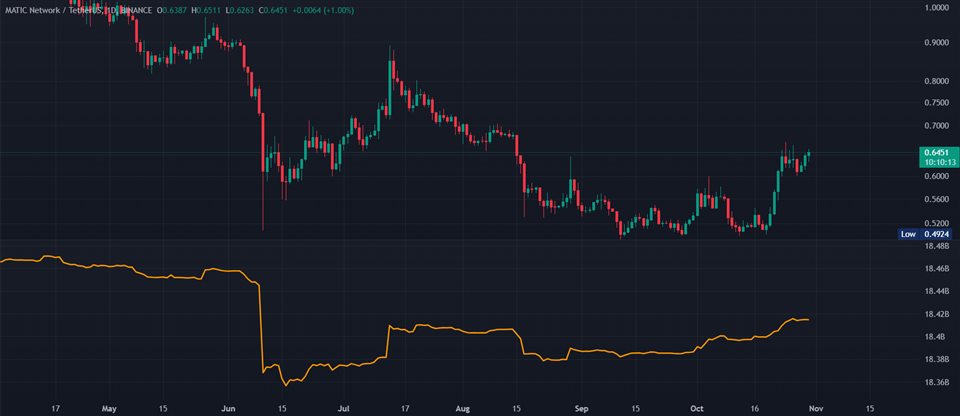
🔹Cumulative Liquidations
Cumulative liquidations are essentially the cumulative sum of the difference between short and long liquidations aiming to confirm the trend and the strength of the trend. (img 6)
Note: default length for cumulative is 100 bar. You can adjust it if needed!
🔶 DETAILS
It's important to note that liquidation data is not provided on the MT platform.
Yet we know that the liquidation data is closely tied in with trading volumes in the market and the movement in the underlying asset’s price. As a result, this script analyzes available data sources extracts the required information, and presents an educated estimate of the liquidation data. This script use tick volume because of forex market.
The data presented does not reflect the actual individual quantitative value of the liquidation data, traders and analysts shall look to the changes over time and the correlation between liquidation data and price movements.
The script's output with the default option values has been visually checked/compared with the liquidation chart presented on coinglass.com.
🔹Liquidations Input
- Mode: defines the presentation of the liquidations chart. Details are given in the tooltip of the option.
- Longs Reference Price: defines the base price in calculating long liquidations.
- Shorts Reference Price: defines the base price in calculating short liquidations.
