ADX Trigger AM
- Indicateurs
- Andriy Matviyevs'kyy
- Version: 26.0
- Mise à jour: 12 septembre 2023
- Activations: 5
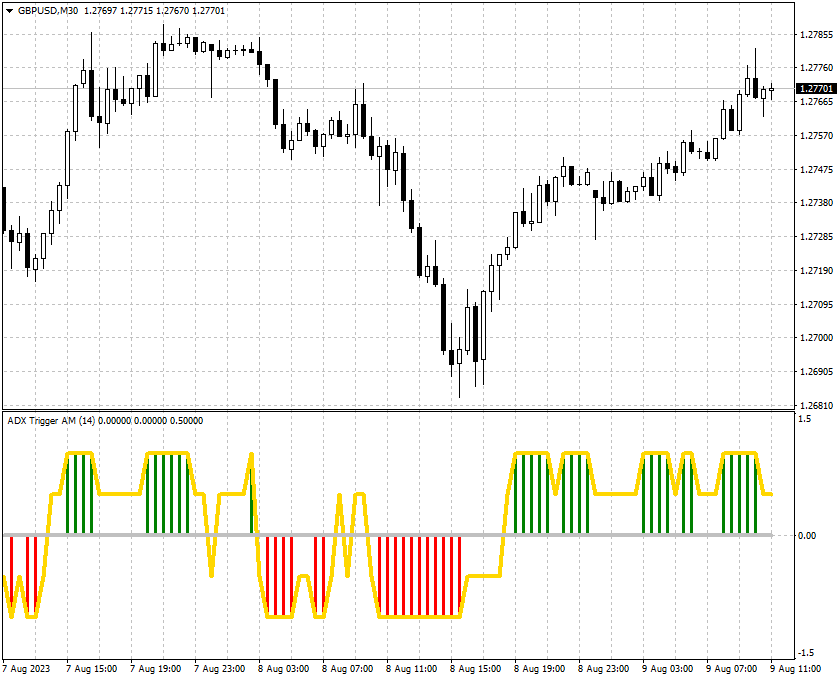
The indicator is an interpretation of the Average Directional Movement Index (ADX) allowing you to determine if there is a price trend. It was developed by Welles Wilder and described in his book "New concepts in technical trading systems".
The indicator determines entry points and uses crossing of ADX +/- lines and growth or fall of the main ADX line. When the indicator crosses the zero line, the trend is changed.
- If the oscillator's value is 1 - the price grows, the trend remains;
- If the oscillator's value is 0.5 - the price grows, the trend is absent;
- If the oscillator's value is -1 - the price falls, the trend remains;
- If the oscillator's value is -0.5 - the price falls, the trend is absent;
The best entry moment is crossing the High/Low of the bar where the indicator has crosses 0.
Settings:
- ADX_Period - ADX period
- ADX_Price - price used to calculate ADX
L'utilisateur n'a laissé aucun commentaire sur la note