• Aperçu
  • Avis
  • Commentaires

MACD ZigZag AI Divergence Alert

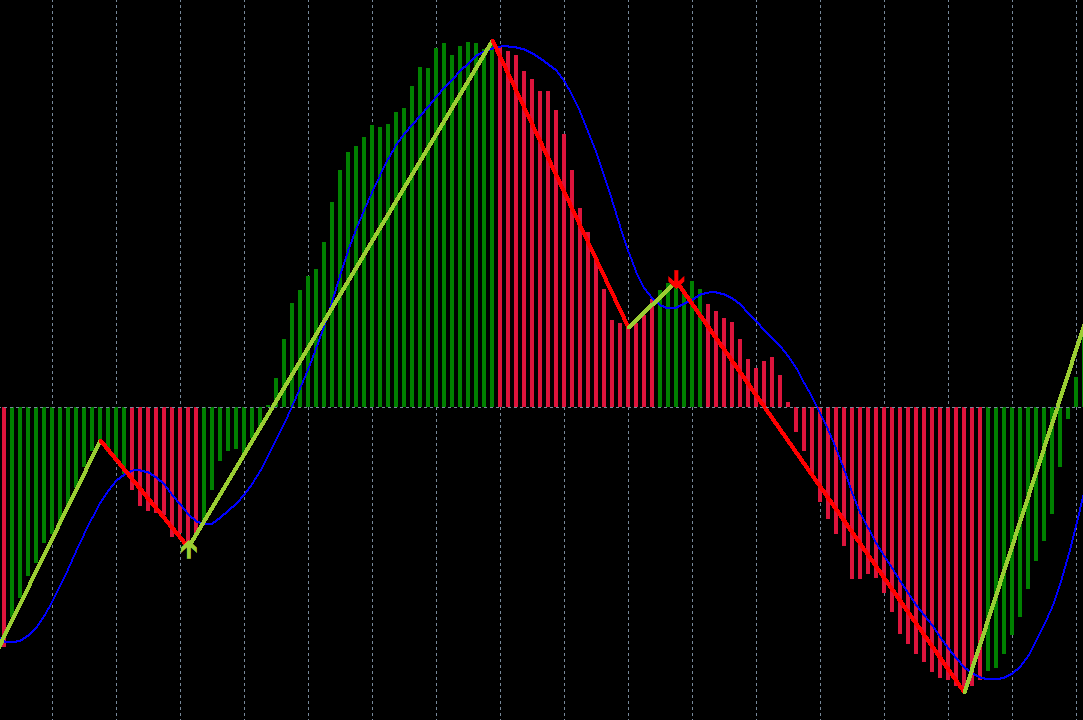
Cet indicateur combine les indicateurs classiques MACD et Zigzag pour détecter la divergence entre le prix et les indicateurs. Il utilise également une technologie avancée d’intelligence artificielle (IA) pour détecter la validité des divergences.

MACD est connu comme le « roi des indicateurs » et Zigzag est également un indicateur très utile. En combinant ces deux indicateurs, cet indicateur exploite les atouts des deux.

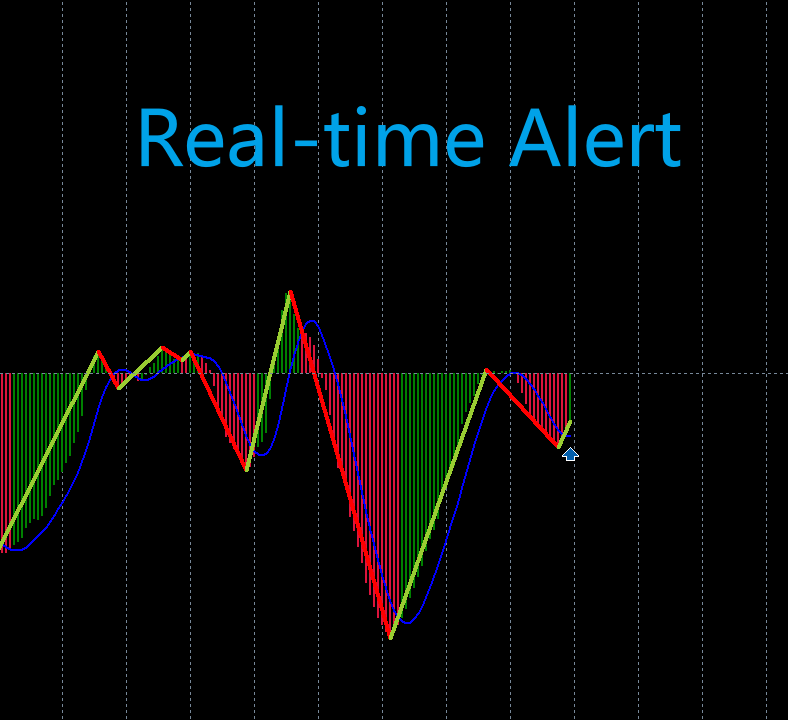
La détection de divergence est un problème probabiliste. Souvent, les divergences se produisent et sont suivies par de nouveaux mouvements de prix dans la même direction. Par conséquent, nous essayons d’utiliser une technologie avancée d’IA pour juger de la validité des divergences, en filtrant les divergences non valides, puis en alertant les utilisateurs de diverses manières.
Prix réduit:59$
Caractéristiques
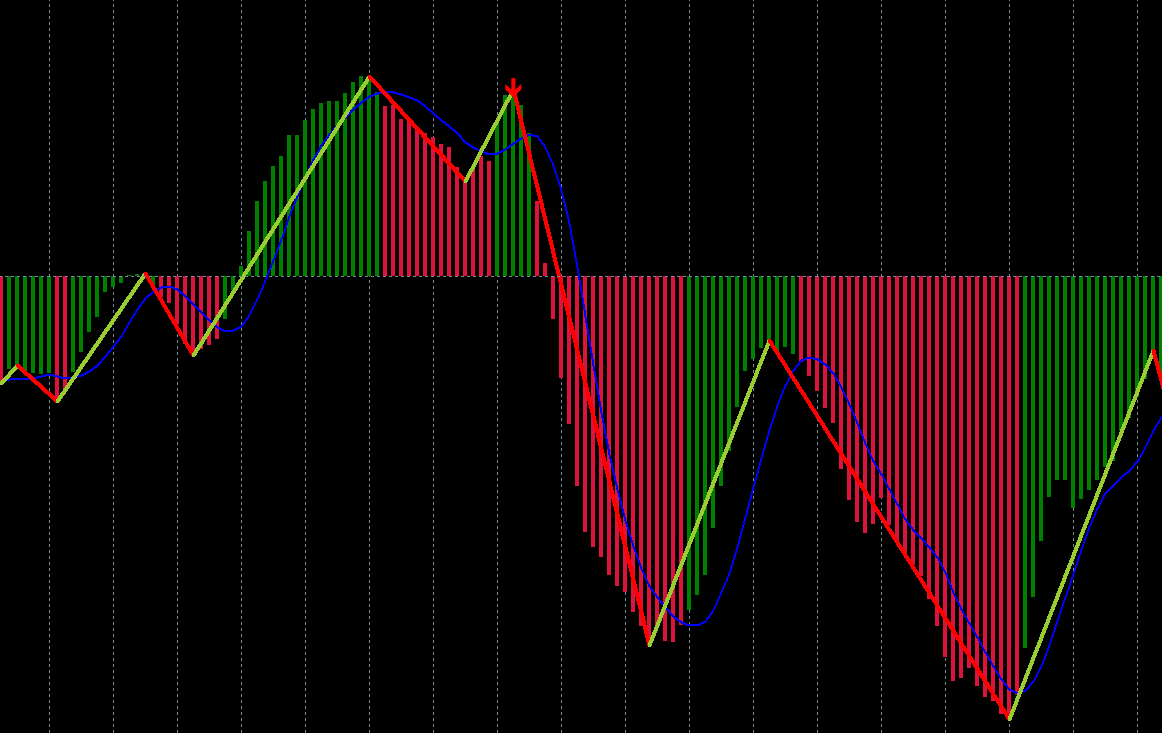
* Indicateur zigzag au format MACD
* Détecte la divergence entre le prix et l'indicateur MACD
* Utilise la technologie IA pour détecter la validité de la divergence
* Alerte les utilisateurs des signaux de divergence
* Alerte les utilisateurs des signaux de divergence via un téléphone mobile
* Alerte les utilisateurs des signaux de divergence par e-mail
* Prend en charge plusieurs délais
* Utilise le puissant format de modèle ONNX (Open Neural Network Exchange)

Usage
Divergence inférieure :
Lorsque le MACD unique passe en dessous, l'indicateur détectera s'il s'agit d'une divergence inférieure. Si tel est le cas, l’indicateur dessinera une flèche vers le haut et alertera l’utilisateur.

Divergence supérieure :
Lorsque le MACD unique passe au-dessus, l'indicateur détectera s'il s'agit d'une divergence supérieure. Si tel est le cas, l’indicateur dessinera une flèche vers le bas et alertera l’utilisateur.

Paramètres d'entrée
Période EMA rapide = 12 ;
Période EMA lente = 26 ;
Période du signal SMA = 9 ;
Prix appliqué = PRICE_CLOSE ;
MaxCalculateBars = 2000 ;
UseAlertNotify = vrai ;
UseMetaQuotesIDNotify = true ;
UseMailNotify = vrai ;
NofityPreMessage = "MACD Zigzig" ;
Sous-fenêtre = 1 ;

Mots clés : divergence supérieure, divergence inférieure, action sur les prix, stratégie de scalping, multi-indicateurs, indicateur intelligent, reconnaissance de divergence, Swing Trading, ONNX
Produits recommandés
MACD Divergence on MT5
KEENBASE SOFTWARE SOLUTIONS
KT MACD Divergence shows the regular and hidden divergences build between the price and oscillator. If your trading strategy anticipates the trend reversal, you can include the MACD regular divergence to speculate the potential turning points. And if your trading strategy based on the trend continuation, MACD hidden divergence would be a good fit. Limitations of KT MACD Divergence Using the macd divergence as a standalone entry signal can be a risky affair. Every divergence can't be interpr
Paula Bollinger Bands Strategy
Francisco Gomes Da Silva
4 (2)
Bollinger bands out/in strategy A strategy created by Joe Ross, and very useful for finding trades when the market is overloaded. Indicator You don't need to find where there are entries on the chart, this indicator shows them for you. The entrance The trade is confirmed when the price closes outside the bollinger bands on a candle and the candle after the price closes inside the bands. comment I want to improve this indicator, so you can help me sending me your reviews and comments, thanks :).
FREE
MACD Intraday Trend PRO est un indicateur développé grâce à une adaptation du MACD original créé par Gerald Appel dans les années 1960. Au fil des années de négociation, il a été observé qu'en modifiant les paramètres du MACD avec les proportions de Fibonacci, nous obtenons une meilleure présentation de la continuité des mouvements de tendance, ce qui permet de détecter plus efficacement le début et la fin d'une tendance de prix. En raison de son efficacité à détecter les tendances de prix,
Unlock hidden profits: accurate divergence trading for all markets Special Offer: Purchase now to receive free bonuses worth $159! (Read more for details) Tricky to find and scarce in frequency, divergences are one of the most reliable trading scenarios. This indicator finds and scans for regular and hidden divergences automatically using your favourite oscillator. [ Installation Guide | Update Guide | Troubleshooting | FAQ | All Products ] Easy to trade Finds regular and hidden divergences
Introducing the Consecutive Green/Red Candle Alert Indicator for MT5 - Your Trend Spotting Companion! Are you ready to take your trading to the next level? We present the Consecutive Green/Red Candle Alert Indicator, a powerful tool designed to help you spot trends and potential reversals with ease. Whether you're a new trader looking for clarity in the market or an experienced pro seeking additional confirmation, this indicator is your trusted companion. Key Features of the Consecutive Gre
The indicator identifies divergences between chart and RSI, with the possibility of confirmation by stochastics or MACD. A divergence line with an arrow appears on the chart when divergence is detected after the current candle has expired. There are various filter parameters that increase the accuracy of the signals. To identify a divergence, point A must be set in the RSI, then point B Value must be edited, which sets the difference between point A and point B. The indicator can be used for tim
Wolfe Wave Scanner MT5
Reza Aghajanpour
5 (4)
**  All Symbols  x  All Timeframes  scan just by pressing scanner button ** *** Contact me after the purchase to send you instructions and add you in "Wolfe Wave Scanner group" for sharing or seeing experiences with other users. Introduction: A Wolfe Wave is created with five-wave patterns in price. It shows supply and demand and a fight towards a balance price. T hese waves of price actions can help traders identify the boundaries of   the trend . Also  It helps forecast how the price will mo
This indicator combines double bottom and double top reversal chart patterns together with detection of divergences between the price chart and the Momentum oscillator. Features Easily detect strong reversal signals Allows to use double top/bottom and Momentum divergence signals combined or independently Get email and/or push notification alerts when a signal is detected Custom colors can be used The indicator is not repainting Can easily be used in an EA (see below) Inputs ENABLE Double Top
MP Impulse MACD for MT5
Pierre Ksachikian
5 (1)
MACD (short for Moving Average Convergence/Divergence) is one of the most famous and oldest indicators ever created and is widely used among   beginners . However, there is a newer version of the MACD that is named   Impulse MACD   which have less false signals than the standard MACD. Classic MACD helps us to identify potential   trends   by displaying   crossovers   between two lines. If MACD line crosses above the Signal line it shows us that the market is potentially   up   trending and that
This indicator combines double bottom and double top reversal chart patterns together with detection of divergences between the price chart and the MACD oscillator. Features Easily detect strong reversal signals Allows to use double top/bottom and MACD divergence signals combined or independently Get email and/or push notification alerts when a signal is detected Custom colors can be used The indicator is not repainting Can easily be used in an EA (see below) Inputs ENABLE Double Top - Botto
MACDivergence MTF MT5
Pavel Zamoshnikov
4.17 (6)
Advanced ideas of the popular MACD indicator: It detects and displays classic and reverse divergences (two methods of detecting divergences). It uses different color to highlight an uptrend and a downtrend. Two methods of determining a trend: а) MACD crosses the 0 level (classic signal); б) MACD crosses its own average (early signal). This is a multi-timeframe indicator: it can display MACD data from other timeframes. Two methods of drawing: classic histogram and line. It generates sound and vis
Created by trader and journalist Larry Williams, Setup 9.1 is a simple strategy that is easy to understand and execute, which is why it is so well known and popular in the world of traders and technical analysis. It is a REVERSION setup, where operations are sought when the moving average changes direction. Setup Logic With the open candlestick chart, at any time chart, it is only necessary to add the 9-period Exponential Moving Average (MME9). That done, we look for assets in which the MME
Binary MACD
Bogdan Kupinsky
Индикатор, показывающий момент преодоления нулевой отметки индикатора MACD.  Подходит для бинарной торговли, т.к. имеется возможность посчитать точность сигналов, в зависимости от времени экспирации. Входные параметры Period of SMA1  - Период 1 скользящей средней Period of SMA2 -  Период 2 скользящей средней Period of SMA3 -  Период 3 скользящей средней Price Type - Тип цены, используемый индикатором MACD Invert signals  - Возможность давать инвертированные сигналы (для работы по тренду) Infor
"Hunttern harmonic pattern finder" base on the dynamic zigzag with the notification and prediction mode This version of the indicator identifies 11 harmonic patterns and predicts them in real-time before they are completely formed. It offers the ability to calculate the error rate of Zigzag patterns depending on a risk threshold. It moreover sends out a notification once the pattern is complete. The supported patterns: ABCD BAT ALT BAT BUTTERFLY GARTLEY CRAB DEEP CRAB CYPHER SHARK THREE
DYJ Super Trend Wave est un système de négociation de crête et de vallée très précis. Cet indicateur recherche les points les plus élevés et les plus bas du fil de bougie en entrant et en sortant du marché. Le prix d'entrée se situe près du point le plus élevé ou le plus bas. Le type de notification du signal a été ajouté à dyj supertrend. Lorsqu'un signal multi-espace est généré, Les types de signaux de notification suivants peuvent être utilisés : Alert mailSend, MobilePush. Input InpSi
Macd Neptuno
Ignacio Agustin Mene Franco
Macd Neptune! It is a modified macd oscillator where it better captures sales and purchases the indicator clearly marks the crossing of moving averages, In addition to that, it marks the purchase and sale with each color, for sale marks the salmon line in the purchase mark the blue line where it gives you the signal changing color is giving you the entrance! It is used in any temporality, used for forex markets and synthetic indices good profit World Investor
"GoldenSwing" is a comprehensive MetaTrader 5 indicator meticulously crafted by Southern Star Trading, designed to enhance your trading strategies with precision swing high and swing low identification. Harnessing the power of swing analysis, this indicator provides traders with invaluable insights into market reversals and trend continuations, enabling them to make informed trading decisions. With its advanced algorithm, GoldenSwing detects significant swing highs and swing lows in real-time
TPM Cross (trend power moving cross) - is a trend following strategy based on custom signal points. Indicator consists from main custom moving chart line and trend power line. Indicator defines up and down movements by it's trend power and custom moving direction. When current market's trend looses it's power and opposite trend starts - power trend line  crosses moving and indicator plots an arrow.  Main indicator's adjustable inputs : movingPeriod - period of moving line  trendPeriod  - period
Buy CTS scalping indicator, provide buying and selling signals, automatic channeling and sending signals to mobile phones Using technical analysis and price action methods and modern methods, CTS indicator can draw price channels and recognize price trends with high accuracy and issue entry and exit signals according to them. Traders can easily fluctuate using this indicator in different time frames and in different markets. With the CTS indicator, you can signal in different ways. This indicat
The standard Bollinger Bands indicator has been improved by integrating additional indications from the Standard Deviation indicator (StdDev), which gives an additional filter for confirming trading signals. In addition, the color of the indicator's lines shows the beginning of a trend, its development and exhaustion. This indicator has a signal block that notifies the trader of the beginning of the trend on any time frame to which it is attached. Settings Type of messages - select the type of
Two Lines MT5
Andrey Kaunov
5 (1)
Индикатор показывает две линии динамики движения двух инструментов. Если один из коррелирующих инструментов убегает, другой будет его догонять. Этот принцип даёт точки входа в сделку по их кроссу или для синхронной покупки и продажи в парном трейдинге. Гистограмма индикатора показывает значение дистанции между   линиями инструментов. При уменьшении и увеличении дистанции гистограмма принимает разные цвета. Треугольный значок показывает текущее состояние линий: расхождение ( Divergence ) или схо
This indicator can automatically scan the RSI values of all varieties on the mt5 and set an alarm. Note that it is fully automatic scanning, you do not need to enter which varieties, do not need to open the variety chart, as long as there are some varieties in the market quotation column, will be automatically scanned to reach the set rsi alarm value, will pop up the alarm, and cycle with the market changes to scan the latest RSI values of all varieties, and alarm. This is very helpful t
HLC bar MT5 Wyckoff
Eduardo Da Costa Custodio Santos
L'indicateur "HLC_bar_MT5 Wyckoff" pour MT5 a été créé pour faciliter l'analyse au moment de la négociation. La barre HLC a été utilisée par Richard Wyckoff et est actuellement largement utilisée dans les opérations "VSA". Wyckoff a découvert que l'utilisation de High, Low et Close rend le graphique beaucoup plus propre et plus facile à analyser. L'indicateur "HLC_bar_MT5 Wyckoff" permet : # Modifiez la largeur de la barre ; # Laissez la barre de la même couleur ; # Et mettez en évidence le bar
Stochastic R
Antony Augustine
Stochastic  Reversal  allows you to recognize reversals professionally. Stochastic Indicator: This technical indicator was developed by George Lane more than 50 years ago. The reason why this indicator survived for so many years is because it continues to show consistent signals even in these current times. The Stochastic indicator is a momentum indicator that shows you how strong or weak the current trend is. It helps you identify overbought and oversold market conditions within a trend.  Rules
MACD Color Histogram
German David Nino Cifuentes
5 (1)
Pour MT4 L'Indicateur MACD Histogram est une version améliorée de l'indicateur MACD traditionnel, offrant une vision supérieure des tendances du marché et des changements de momentum. Contrairement au MACD par défaut dans MT5, cette version inclut un histogramme , ce qui facilite la visualisation et l'interprétation des conditions du marché. Avantages par rapport à l'indicateur MACD par défaut : Visualisations Améliorées : L'histogramme fournit une représentation en barres de la différence en
Your Trend Friend
Luigi Nunes Labigalini
5 (1)
The trend is your friend! Look at the color of the indicator and trade on that direction. It does not  repaint. After each candle is closed, that's the color of the trend. You can focus on shorter faster trends or major trends, just test what's most suitable for the symbol and timeframe you trade. Simply change the "Length" parameter and the indicator will automatically adapt. You can also change the color, thickness and style of the lines. Download and give it a try! There are big movements
This indicator combines double bottom and double top reversal chart patterns together with RSI divergence detection. Features Easily detect strong reversal signals. Allows to use double top/bottom and RSI divergence signals combined or independently. Get email and/or push notification alerts when a signal is detected. Custom colors can be used. The indicator is not repainting. Can easily be used in an EA. (see below) Inputs ENABLE Double Top - Bottom: Enable the double top - bottom indicator
A simple indicator to help showing the remaining time until the candle closes for all pre-defined chart periods with the following formats depending on which timeframe the chart is on. DD:HH:MM:SS - in case of W1, and MN period HH:MM:SS - in case of other periods Included with some of configurations as follows (please see attached inputs screenshot) X/Y distance to the upper right corner of the chart window Text size Text color Show/hide
Multiple Timeframe MACD indicator. This indicator was built for making multiple timeframe analysis possible in MT5 using MACD Indicator. MACD Indicator traditionally shows two lines and one histogram. MACD Line(Yellow) is calculated by subtracting 12period EMA(fast) from 26period EMA (slow). Signal Line(Blue) is created by a 9period EMA from MACD Line. Histogram is just the difference between MACD and Signal lines. Histogram is colored based on the difference between its value and the previous h
Cet indicateur innovant de mesure de la force des devises de INFINITY est une aide indispensable pour les scalpers et les commerçants qui négocient à long terme. Le système d'analyse De la force/faiblesse des devises est connu depuis longtemps et utilisé sur le marché par les principaux traders du monde. Tout commerce d'arbitrage n'est pas complet sans cette analyse. Notre indicateur détermine facilement la force des devises sous-jacentes les unes par rapport aux autres. Il affiche des graphiqu
Les acheteurs de ce produit ont également acheté
Atomic Analyst MT5
Issam Kassas
4.79 (19)
Tout d'abord, il convient de souligner que cet indicateur de trading n'est ni repainting, ni redrawing et ne présente aucun délai, ce qui le rend idéal à la fois pour le trading manuel et automatisé. Manuel de l'utilisateur : réglages, entrées et stratégie. L'Analyste Atomique est un indicateur d'action sur les prix PA qui utilise la force et le momentum du prix pour trouver un meilleur avantage sur le marché. Équipé de filtres avancés qui aident à éliminer les bruits et les faux signaux, et à
Tout d'abord, il convient de souligner que ce système de trading est un indicateur non repeint, non redessiné et non retardé, ce qui le rend idéal pour le trading manuel et automatisé. Cours en ligne, manuel et téléchargement de préréglages. Le "Système de Trading Smart Trend MT5" est une solution de trading complète conçue pour les traders débutants et expérimentés. Il combine plus de 10 indicateurs premium et propose plus de 7 stratégies de trading robustes, ce qui en fait un choix polyvalent
TPSproTREND PrO MT5
Roman Podpora
4.89 (9)
TPSpro TREND PRO  - is a trend indicator that automatically analyzes the market and provides information about the trend and each of its changes, as well as giving signals for entering trades without redrawing! The indicator uses each candle, analyzing them separately. referring to different impulses - up or down impulse. Exact entry points into transactions for currencies, crypto, metals, stocks, indices!  Version MT4               DETAILED DESCRIPTION               R ecommended to use with an
TPSpro RFI Levels MT5
Roman Podpora
4.67 (9)
Reversal First Impulse levels (RFI)      INSTRUCTIONS        RUS       -       ENG              R ecommended to use with an indicator   -   TPSpro  TREND PRO -  Version MT4                 A key element in trading is zones or levels from which decisions to buy or sell a trading instrument are made. Despite attempts by major players to conceal their presence in the market, they inevitably leave traces. Our task was to learn how to identify these traces and interpret them correctly. Main functi
Top indicator for MT5   providing accurate signals to enter a trade without repainting! It can be applied to any financial assets:   forex, cryptocurrencies, metals, stocks, indices .  Watch  the video  (6:22) with an example of processing only one signal that paid off the indicator! MT4 version is here It will provide pretty accurate trading signals and tell you when it's best to open a trade and close it. Most traders improve their trading results during the first trading week with the help of
Quantum Trend Sniper
Bogdan Ion Puscasu
4.92 (48)
Présentation       Quantum Trend Sniper Indicator   , l'indicateur révolutionnaire MQL5 qui transforme la façon dont vous identifiez et négociez les inversions de tendance ! Développé par une équipe de traders expérimentés avec une expérience commerciale de plus de 13 ans,       Indicateur Quantum Trend Sniper       est conçu pour propulser votre parcours de trading vers de nouveaux sommets grâce à sa manière innovante d'identifier les inversions de tendance avec une précision extrêmement élevée
FX Power MT5 NG
Daniel Stein
5 (6)
Obtenez votre mise à jour quotidienne du marché avec des détails et des captures d'écran via notre Morning Briefing ici sur mql5 et sur Telegram ! FX Power MT5 NG est la nouvelle génération de notre très populaire indicateur de force des devises, FX Power. Et qu'est-ce que ce compteur de force de nouvelle génération offre ? Tout ce que vous avez aimé de l'original FX Power PLUS Analyse de la force de l'OR/XAU Des résultats de calcul encore plus précis Périodes d'analyse configurables individuel
FX Volume MT5
Daniel Stein
4.94 (17)
Obtenez votre mise à jour quotidienne du marché avec des détails et des captures d'écran via notre Morning Briefing ici sur mql5 et sur Telegram ! FX Volume est le PREMIER et SEUL indicateur de volume qui fournit un VRAI aperçu du sentiment du marché du point de vue d'un courtier. Il fournit des informations impressionnantes sur la façon dont les acteurs institutionnels du marché, comme les courtiers, sont positionnés sur le marché des changes, bien plus rapidement que les rapports COT. Voir c
XQ Indicator MetaTrader 5
Marzena Maria Szmit
3.5 (2)
Step into the realm of Forex trading with confidence and precision using XQ, a cutting-edge Forex indicator designed to elevate your trading game to unprecedented heights. Whether you're a seasoned trader or just stepping into the world of currency exchange, XQ Forex Indicator empowers you with the insights and signals needed to make informed trading decisions. The signal conditions are a combination of three indicators, and XQ Forex Indicator only display  medium and long-term trends . The ind
Ce tableau de bord affiche les derniers   modèles harmoniques   disponibles pour les symboles sélectionnés, ce qui vous permettra de gagner du temps et d'être plus efficace /   version MT4 . Indicateur gratuit:   Basic Harmonic Pattern Colonnes de l'indicateur Symbol :   les symboles sélectionnés apparaissent Trend   :   haussière ou baissière Pattern :   type de motif (gartley, papillon, chauve-souris, crabe, requin, cypher ou ABCD) Entry:   prix d'entrée SL:   prix du stop loss TP1:   1
TrendMaestro5
Stefano Frisetti
note: this indicator is for METATRADER4, if you want the version for METATRADER5 this is the link:  https://www.mql5.com/it/market/product/108106 TRENDMAESTRO ver 2.4 TRENDMAESTRO recognizes a new TREND in the bud, he never makes mistakes. The certainty of identifying a new TREND is priceless. DESCRIPTION TRENDMAESTRO identifies a new TREND in the bud, this indicator examines the volatility, volumes and momentum to identify the moment in which there is an explosion of one or more of these data a
Gartley Hunter Multi
Siarhei Vashchylka
5 (8)
Gartley Hunter Multi - An indicator for searching for harmonic patterns simultaneously on dozens of trading instruments and on all possible timeframes. Manual (Be sure to read before purchasing) | Version for MT4 Advantages 1. Patterns: Gartley, Butterfly, Shark, Crab. Bat, Alternate Bat, Deep Crab, Cypher 2. Simultaneous search for patterns on dozens of trading instruments and on all possible timeframes 3. Search for patterns of all possible sizes. From the smallest to the largest 4. A
Unlock key market insights with automated support and resistance lines Special Offer: Purchase now to receive free bonuses worth $89! (Read more for details) Tired of plotting support and resistance lines? This is a multi-timeframe indicator that detects and plots supports and resistance lines in the chart with the same precision as a human eye would. As price levels are tested over time and its importance increases, the lines become thicker and darker, making price leves easy to glance and ev
Matrix Arrow Indicator MT5
Juvenille Emperor Limited
5 (14)
Matrix Arrow Indicator MT5   est une tendance unique 10 en 1 suivant un indicateur multi-période   100% non repeint   qui peut être utilisé sur tous les symboles/instruments:   forex ,   matières premières ,   crypto-monnaies ,   indices ,  actions .  Matrix Arrow Indicator MT5  déterminera la tendance actuelle à ses débuts, en rassemblant des informations et des données à partir d'un maximum de 10 indicateurs standard, qui sont: Indice de mouvement directionnel moyen (ADX) Indice de canal de m
Volume by Price MT5
Brian Collard
3.6 (5)
The Volumebyprice.com Indicator for MetaTrader 5 features Volume Profile and Market Profile TPO (Time Price Opportunity). Volume and TPO histogram bar and line charts. Volume Footprint charts. TPO letter and block marker collapsed and split structure charts. Static, dynamic and flexible range segmentation and compositing methods with relative and absolute visualizations. Session hours filtering and segment concatenation with Market Watch and custom user specifications. Graphical layering, posit
Volatility Trend System - est un système commercial qui fournit des signaux pour les entrées. Le système de volatilité donne des signaux linéaires et ponctuels dans le sens de la tendance, ainsi que des signaux pour en sortir, sans redessin ni délai. L'indicateur de tendance surveille la direction de la tendance à moyen terme, montre la direction et son changement. L'indicateur de signal est basé sur les changements de volatilité et montre les entrées sur le marché. L'indicateur est équipé
Blahtech Supply Demand MT5
Blahtech Limited
4.54 (13)
Was: $299  Now: $99   Supply Demand uses previous price action to identify potential imbalances between buyers and sellers. The key is to identify the better odds zones, not just the untouched ones. Blahtech Supply Demand indicator delivers functionality previously unavailable on any trading platform. This 4-in-1 indicator not only highlights the higher probability zones using a multi-criteria strength engine, but also combines it with multi-timeframe trend analysis, previously confirmed swings
Gold TMAF MTF - il s'agit d'un meilleur indicateur technique boursier. L'algorithme de l'indicateur analyse le mouvement du prix d'un actif et reflète la volatilité et les zones d'entrée potentielles. Les meilleurs signaux de l'indicateur: - Pour VENDRE = limite supérieure rouge de la TMA2 au-dessus de la limite supérieure rouge de la TMA1 + indicateur fractal rouge au-dessus + flèche jaune du signal SR dans la même direction. - Pour l'ACHAT = limite inférieure bleue de la TMA2 en desso
Automated Trendlines MT5
Georgios Kalomoiropoulos
Les lignes de tendance sont l'outil d'analyse technique le plus essentiel dans le trading forex. Malheureusement, la plupart des commerçants ne les dessinent pas correctement. L'indicateur Automated Trendlines est un outil professionnel pour les traders sérieux qui vous aide à visualiser le mouvement de tendance des marchés. Il existe deux types de lignes de tendance, les lignes de tendance haussières et les lignes de tendance baissières. Dans la tendance haussière, la ligne de tendance
TPA True Price Action indicator reveals the true price action of the market makers through 100% non-repainting signals strictly at the close of a candle! TPA shows entries and re-entries, every time the bulls are definitely stronger than the bears and vice versa. Not to confuse with red/green candles. The shift of power gets confirmed at the earliest stage and is ONE exit strategy of several. There are available now two free parts of the TPA User Guide for our customers. The first "The Basics"
Présentation       Quantum Breakout PRO   , l'indicateur révolutionnaire MQL5 qui transforme la façon dont vous négociez les zones d'évasion ! Développé par une équipe de traders expérimentés avec une expérience commerciale de plus de 13 ans,       Évasion quantique PRO       est conçu pour propulser votre parcours commercial vers de nouveaux sommets grâce à sa stratégie de zone de discussion innovante et dynamique. Quantum Breakout Indicator vous donnera des flèches de signalisation sur le
Order Block Hunter MT5
Noha Mohamed Fathy Younes Badr
5 (1)
Order block hunter indicator is the best indicator for  hunt the order blocks that area where there has been a large concentration of limit orders waiting to be executed Order blocks are identified on a chart by observing previous price action and looking for areas where the price experienced significant movement or sudden changes in direction .This indicator does that for you by using very complicated codes and helps you to take the best areas To buy and sell because it make marks at the best a
Was: $249  Now: $99   Market Profile defines a number of day types that can help the trader to determine market behaviour. A key feature is the Value Area, representing the range of price action where 70% of trading took place. Understanding the Value Area can give traders valuable insight into market direction and establish the higher odds trade. It is an excellent addition to any system you may be using. Inspired by Jim Dalton’s book “Mind Over Markets”, this indicator is designed to suit the
If you want to find good trading opportunities, then you must trade near the Trend Line. This allows you to have a tighter         stop loss   on your trades — which improves your       risk to reward . But that’s not all… Because if you combine Trend Line with Support and Resistance, that’s where you find the best trading opportunities. Now you might wonder: “So when do I enter a trade?” Well, you can use reversal     candlestick patterns   (like the   Hammer, Bullish Engulfing, etc.) as your e
Owl Smart Levels MT5
Sergey Ermolov
4.31 (39)
Version MT4   |  FAQ L' indicateur Owl Smart Levels est un système de trading complet au sein d'un seul indicateur qui comprend des outils d'analyse de marché populaires tels que les fractales avancées de Bill Williams , Valable ZigZag qui construit la structure d'onde correcte du marché et les niveaux de Fibonacci qui marquent les niveaux exacts d'entrée. sur le marché et les endroits où prendre des bénéfices. Description détaillée de la stratégie Mode d'emploi de l'indicateur Conseiller-Assis
Gold ATR MTF - il s'agit d'un bon indicateur technique boursier. L'algorithme de l'indicateur ATR (Average True Range) analyse l'évolution du prix de l'actif et reflète la volatilité en dessinant les niveaux correspondants dans des pourcentages spécifiés (%) du prix d'ouverture de la période spécifiée (D1). Les indicateurs (rouge et/ou bleu D1 H4) de la direction du mouvement des prix du symbole et les signaux fléchés sont des aides supplémentaires et essentielles pour un trading intrajournalie
Notre tableau de bord innovant " Basic Candlestick Patterns " est spécialement conçu pour identifier automatiquement les modèles de chandeliers rentables sur le graphique. Ce tableau de bord utilise des algorithmes avancés pour analyser les graphiques de prix en temps réel et détecter un large éventail de configurations de chandeliers, des plus classiques aux plus complexes. En outre, il dispose d'une interface facile à utiliser qui vous permet de visualiser les configurations détectées sur dif
Elliot Waves Analyzer Pro
Viktor Weidenthal
3.25 (4)
Elliot Waves Analyzer Pro calculates Elliot Waves to Help Identify Trend direction and Entry Levels. Mainly for Swing Trading Strategies. Usually one would open a Position in trend direction for Wave 3 or a Correction for Wave C . This Indicator draws Target Levels for the current and next wave. Most important Rules for Elliot Wave Analysis are verified by the Indicator.  The Pro version analyzes Multiple Timeframes and shows the Subwaves and Target-Levels.   For an Overview  " Elliot Waves Anal
Bill Williams Advanced
Siarhei Vashchylka
5 (7)
Bill Williams Advanced is designed for automatic chart analysis using Bill Williams' "Profitunity" system. The indicator analyzes four timeframes at once. Manual (Be sure to read before purchasing) Advantages 1. Automatically analyzes the chart using the "Profitunity" system of Bill Williams. The found signals are placed in a table in the corner of the screen. 2. Equipped with a trend filter based on the Alligator indicator. Most of the system signals are recommended to be used only accordi
Trend Master Pro MT5
Tatiana Zyrianova
4.67 (3)
MT5 trend indicator with a probability of reaching a profit of 70-90%! Works without redrawing and delays. Trend Master PRO shows good results on all trading instruments: currencies, metals, indices, stocks, cryptocurrencies. Recommended timeframe: H1-H4. More information about the indicator is here :  https://www.mql5.com/en/blogs/post/744748 Recommendations for use Use automatic period detection           The main feature of the indicator is the self-optimization function.             Th
Plus de l'auteur
Smart Peak Bottom
Xiaoyu Huang
5 (2)
Il s'agit d'un indicateur clair pour juger des hauts et des bas, et cela fonctionne bien pour le marché oscillant. Prix promotionnel 49$ → 59$ caractéristiques bon pour juger des hauts et des bas Pas de redessin, pas de dérive Calcul rapide, pas de décalage Mode de rappel riche Plusieurs paramètres et couleurs peuvent être ajustés paramètre "======== Principal ========" HighLowPeriod1 = 9 HighLowPeriod2 = 60 HighLowPeriod3 = 34 HighLowEMAPeriod = 4 MASignalPeriod = 5 "======== Notifier ==
King of Dragon Channel, Indicateur King of Dragon, Système King of Dragon, King of Dragon MT5, Indicateur classique King of Dragon, Système de balayage King of Dragon, Roi du Dragon tout en un Le système de trading de canaux King of Dragon, qui est un système de trading de canaux classique, de nombreux utilisateurs demandent fortement la version MT5. Ce programme a été optimisé pour les performances dans plusieurs versions, et c'est déjà un système relativement fluide. 49$ → 59$ Zone rouge, t
Système Martin semi-automatique introduire Cet outil est utilisé pour le trading Martin semi-automatique, cliquez sur le panneau pour passer une commande et l'EA gérera la position Décidez simplement de la direction de la transaction et laissez le reste à la direction d'EA Martin automatique, ajoutez un entrepôt selon la grille définie, vous pouvez également désactiver cette fonction Liquidation en un clic Une fonction de verrouillage à clé contrôle du temps Invite sonore d'avertissement
Parler de l'indicateur Zen MACD MACD quatre couleurs à deux fils Afficher la somme de l'aire de la colonne InpFastMA=12 ; // Période EMA rapide InpSlowMA=26 ; // Période EMA lente InpSignalMA=9 ; // Période SMA du signal InpAppliedPrice=PRICE_CLOSE;// Prix appliqué InpMaMethod=MODE_EMA ; //Ma_Method input bool ChArea = false; //chzhshch Area Paramètres de ligne rapide de la période EMA rapide Paramètres de ligne lente de la période EMA lente Paramètres de ligne de signal d
présenter Il s'agit d'un EA pour le trading de nuit, entre 21h00 et 22h00 Les offres fermes à long terme sont rentables N'échangez qu'une commande à la fois et ne causera pas de grosse perte Définissez un stop loss et prenez des bénéfices pour chaque ordre, n'utilisez pas de grille, Martin ou autre gestion de fonds à haut risque Peut être utilisé pour plusieurs devises en même temps Définir le fuseau horaire automatiquement par défaut caractéristique Graphique de trading : M15 Devises négociab
EEVCC Hedge Prix ​​promotionnel : 59 $ Activation : 10 introduction Il s'agit d'une EA de trading de couverture de grille bidirectionnelle (achat et vente en même temps) Les offres fermes à long terme sont rentables Peut être utilisé dans plusieurs devises en même temps Méthode de calcul du profit en toute sécurité caractéristique Graphique de trading : H1 Devise recommandée : EURGBP, EURUSD Dépôt minimum : 3000USD, recommandé 10000USD, 100USD pour les comptes en centimes Courtiers recommandés :
1 day Promotional price: $49 Activation: 30 10 days promotional price: $59 activation: 20 Introduction Quick View Quickly check the profitability for a period of time and display the statistics Quickly filter historical transactions and make statistics based on time, magic number, currency, and comments Statistics include Net Profit, LotTotal, Profit Factor, Short Trades (win %), Long Trades (win %), Average Profit Trade, etc. Refresh statistical data in real time Calculation time is
Introduction This is an indicator of daily profitability Characteristic Statistics can be based on currency, magic number, and notes Statistics can be based on time Available for all currencies, all periods There are white and black themes Reverse sort The refresh rate can be adjusted You can set the refresh time to the latest Parameter nD                     =  30;                                     // Number of days StartTime          =  D'2021.06.01 00:00:00';       //  StartTime EndTi
Introduce This is a trading assistant, information panel indicators, aggregate currency statistics, account statistics, position information, server and local time, currency strength, K-line remaining time, support and resistance lines, server time offset, currency fluctuations Rate and other functions. Can be used for all types of accounts and currencies. Excellent performance, very few resources You can customize the position, color, font size Any module can be individually displayed or disab
Index de type fractal CZSC Caractéristiques: Réaliser un traitement approfondi de la relation d'inclusion Il est pratique d'utiliser l'appel EA pour juger s'il s'agit d'une classification de haut en bas, et le statut dans "Teaching You to Stock 93: The Relationship between the Two Tables and the Inside of the Trend Structure 2" Afficher la classification de haut en bas avec des flèches Afficher les stylos possibles dans différentes couleurs La relation d'inclusion de deux lignes K a
Cette bibliothèque est utilisée pour trier des tableaux de clés et de valeurs, nous avons souvent besoin de trier des valeurs. comme dans le langage python sorted(key_value.items(), key = lambda kv:(kv[ 1 ], kv[ 0 ])) fonction d'importation Exemple de scénarios d'utilisation 1. Les commandes Grid EA sont triées en fonction du prix d'ouverture void SortedByOpenPride()   {    long     OrderTicketBuffer[];    double   OpenPriceBuffer[];    for ( int i = PositionsTotal ()- 1 ; i>= 0 ; i--)
Gold Digger AI
Xiaoyu Huang
4.8 (5)
Il s'agit d'un EA de trading d'or stable et rentable à long terme, utilisant des indicateurs techniques traditionnels et utilisant l'IA pour un EA adaptatif. Nouveau prix de la promotion EA : 199 $   →   $ 249 Caractéristique une commande à la fois stop loss fixe adaptatif commerce de nuit Optimiser le glissement filtre de nouvelles Convient pour passer FTMO, DARWINEX Zero Peut être utilisé avec d'autres EA Programmation orientée objet, le cadre du programme a été testé pendant 5 ans Signal htt
Introduction Il s'agit d'une EA de retrait conçue pour détecter les divergences de tendance, ce qui correspond au premier type d'arguments d'achat et de vente de la théorie du « Zhan Zhong Shuo Chan ». Avec un facteur de profit exceptionnellement élevé, cette EA offre une rentabilité constante à long terme. Il utilise un trading en grille dynamique, lui permettant de s'adapter de manière transparente aux diverses conditions du marché. Nouveau prix promotionnel EA : 99 $ → 149 $ Signal en dire
Indicateur de force monétaire L’indicateur de force monétaire est un outil puissant pour identifier les tendances. Il compare la force et la faiblesse des différentes devises et facilite la recherche de paires de devises tendances. Prix ​​de vente : 49 $ Caractéristiques Distingue efficacement les monnaies fortes et faibles Identifie automatiquement les devises tendance Multi-périodes Charge 28 paires de devises Performances optimisées Utilisation des indicateurs Monnaies fortes : Les
Filtrer:
Aucun avis
Répondre à l'avis