Market Noise
- Indicateurs
- Ivan Butko
- Version: 1.2
- Mise à jour: 30 mai 2024
- Activations: 20
Market Noise
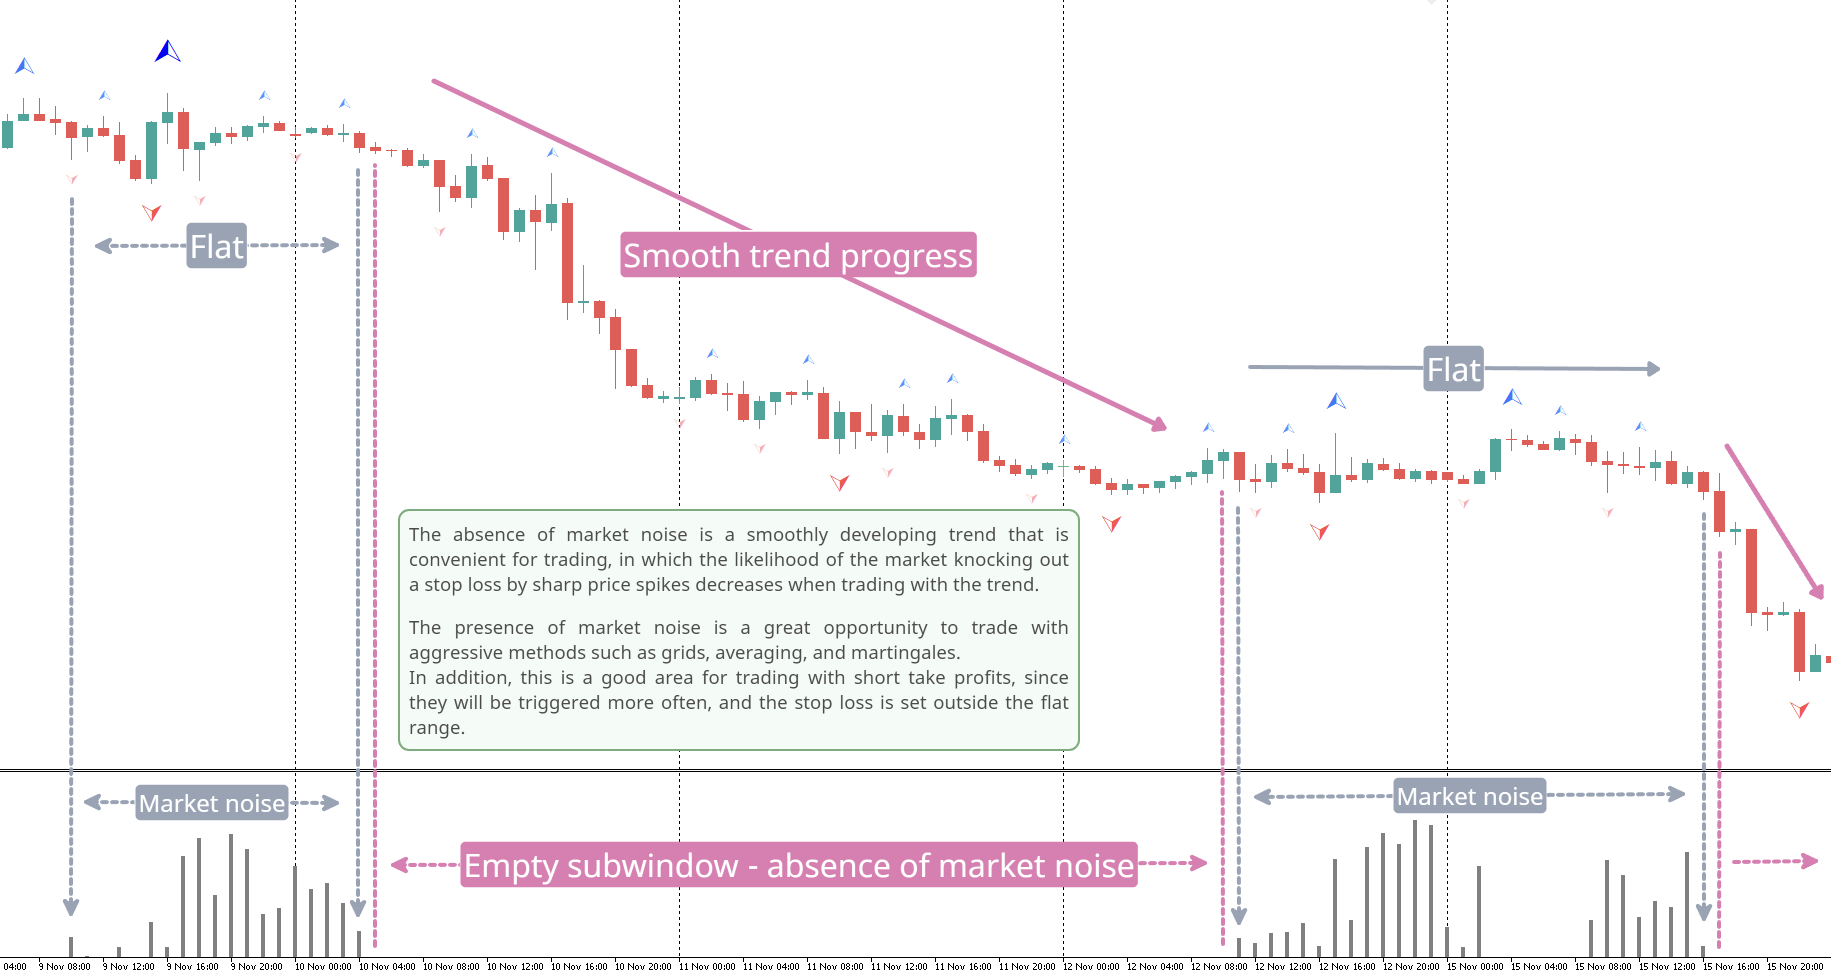
Le bruit du marché est un indicateur qui détermine les phases du marché sur un graphique de prix et distingue également les mouvements de tendance clairs et fluides des mouvements plats et bruyants lorsqu'une phase d'accumulation ou de distribution se produit.
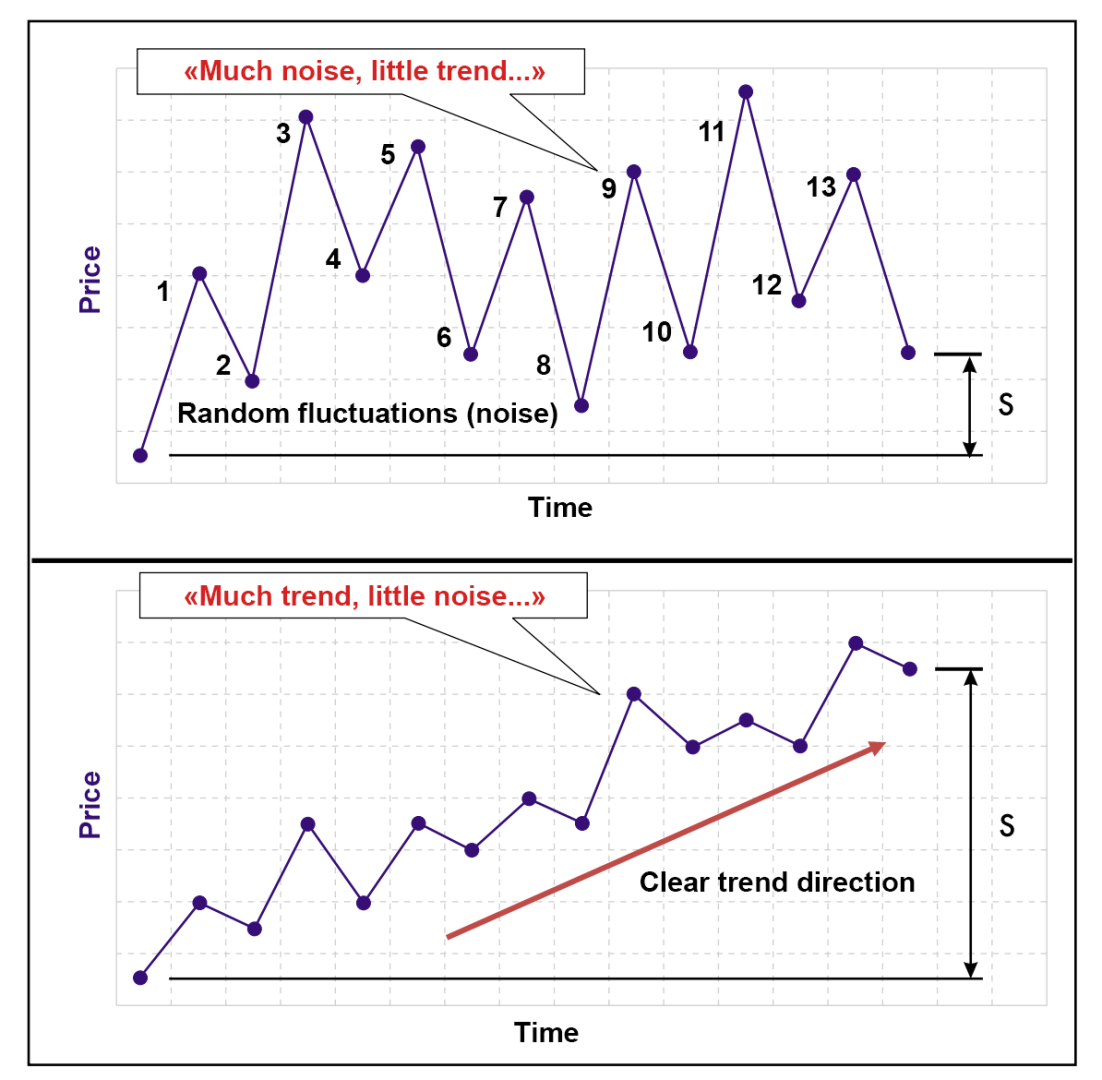
Chaque phase est bonne pour son propre type de trading : tendance pour les systèmes qui suivent les tendances et plate pour les systèmes agressifs. Lorsque le bruit du marché commence, vous pouvez décider de quitter les transactions. De la même manière, et vice versa, dès que le bruit cesse, vous devez désactiver les systèmes de trading agressifs. Quelqu'un peut échanger les deux types de stratégies de trading, en passant de l'une à l'autre. Par conséquent, cet indicateur joue le rôle d’un bon assistant dans le domaine des décisions commerciales. Tout mouvement de prix peut être divisé en deux éléments : le mouvement général des prix sur une période de temps sélectionnée et le bruit sous la forme de fluctuations de prix au cours de cette période. Dans le même temps, différents marchés à différentes périodes peuvent démontrer un large éventail de relations mutuelles entre les composantes de bruit et de tendance (Fig. 1). Plus le niveau de bruit des mouvements de prix est élevé, plus il est difficile de discerner la direction et la force de la tendance sous-jacente. Par conséquent, dans ce cas, il est nécessaire d’utiliser des méthodes d’identification de tendances plus lentes. D'un autre côté, sur les marchés avec de faibles niveaux de bruit, la tendance principale est déterminée assez facilement et des méthodes plus rapides de détermination des tendances sont raisonnables, garantissant un décalage minimum des signaux de trading par rapport aux changements de direction des prix. Pour déterminer l'état du marché, un ratio d'efficacité avancé (ER) est utilisé, basé sur une comparaison exponentielle de l'évolution totale des prix et de la somme des mouvements du marché du bruit sur une certaine période. Le ratio d'efficacité (ER) peut varier de 0 à 1. La valeur ER sera nulle lorsque le marché ne présente aucun mouvement directionnel, seulement du bruit. La valeur ER sera égale à un lorsque le marché évolue dans une direction, avec une absence totale de bruit.
Avantages
- Définir une tendance claire pour les systèmes de trading de tendance
- Détermination plate pour les systèmes agressifs (grilles, moyenne, martingale, sit-out) ou les systèmes de trading avec un SL élevé et un TP faible
- Peu de réglages - uniquement la période de calcul en barres
Utilisez l'indicateur Market Noise en complément de votre système de trading
Essayez également mes autres produits sur le marché https://www.mql5.com/ru/users/capitalplus/seller