• Aperçu
  • Avis
  • Commentaires

T3 Heiken Ashi AM

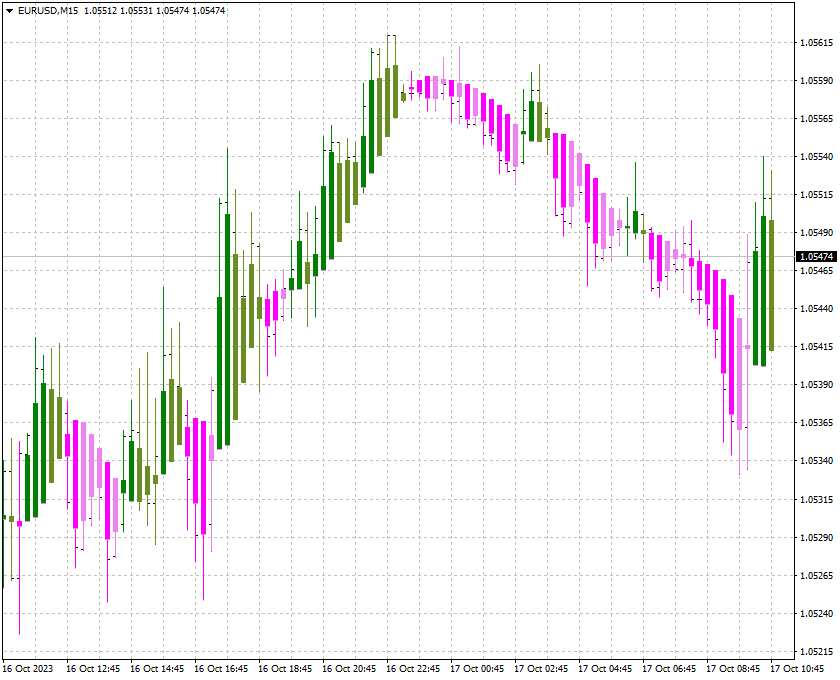
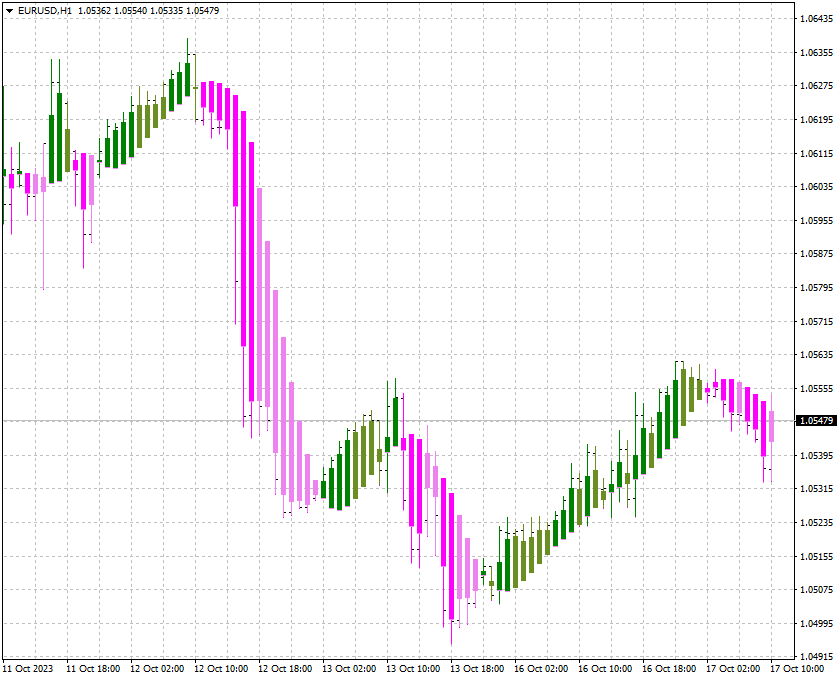
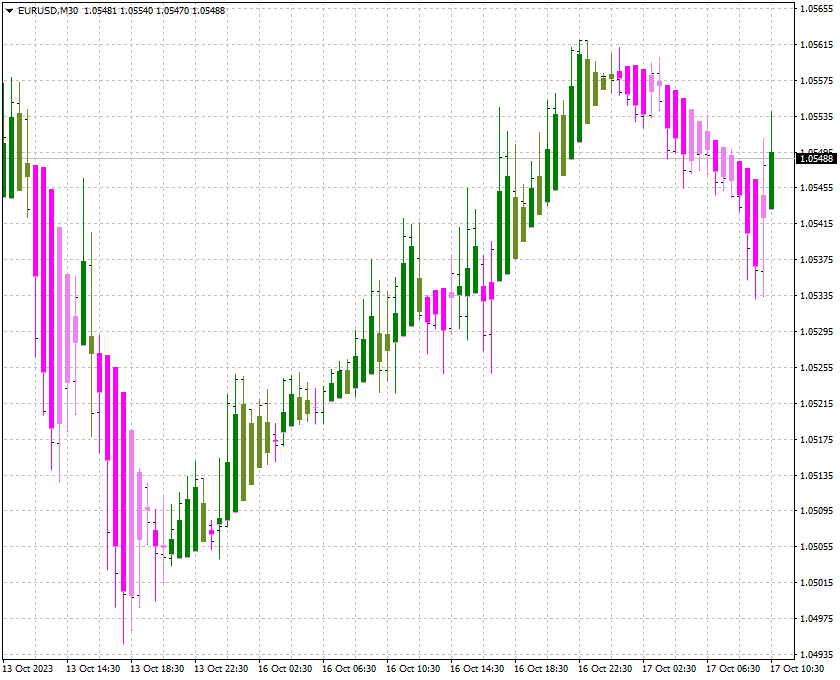
Implementation of the classic Heiken Ashi indicator using the T3 smoothing method.

The indicator allows you to select the smoothing depth and the smoothing shift relative to the current price.

The indicator also allows you to select the price at which the data will be smoothed, as well as the control price with which comparison is made.

The proposed approach allows you to visualize the trend and simplify trading decisions.


Produits recommandés
Un indicateur technique qui calcule ses lectures sur les volumes de transactions. Sous forme d'histogramme, il montre l'accumulation de la force de mouvement de l'instrument de trading. Il dispose de systèmes de calcul indépendants pour les directions haussières et baissières. Fonctionne sur tous les instruments de trading et délais. Peut compléter n’importe quel système commercial. L'indicateur ne redessine pas ses valeurs, les signaux apparaissent sur la bougie actuelle. Il est facile à util
BoxChart MT4
Evgeny Shevtsov
4.4 (5)
The market is unfair if only because 10% of participants manage 90% of funds. An ordinary trader has slim changes to stand against these "vultures". This problem can be solved. You just need to be among these 10%, learn to predict their intentions and move with them. Volume is the only preemptive factor that faultlessly works on any timeframe and symbol. First, the volume appears and is accumulated, and only then the price moves. The price moves from one volume to another. Areas of volume accumu
Blahtech Market Profile
Blahtech Limited
4.46 (13)
Was: $249  Now: $99   Market Profile defines a number of day types that can help the trader to determine market behaviour. A key feature is the Value Area, representing the range of price action where 70% of trading took place. Understanding the Value Area can give traders valuable insight into market direction and establish the higher odds trade. It is an excellent addition to any system you may be using. Blahtech Limited presents their Market Profile indicator for the MetaTrader community. Ins
Indicateur Profil de Volume pour MT4 Obtenez un avantage en trading avec l'indicateur "Profil de Volume" pour MetaTrader 4 (MT4). Cet outil avancé d'analyse technique vous permet d'identifier avec précision les niveaux clés de support et de résistance basés sur le volume des transactions. Visualisez facilement les zones d'intérêt du marché, où les volumes d'échange sont les plus élevés, et utilisez ces informations pour prendre des décisions de trading plus éclairées. Caractéristiques principale
FATL Candles 2 AM
Andriy Matviyevs'kyy
This indicator displays candle prices on the chart, colored in accordance with the data of the FATL digital filter built on closing prices. The indicator has no configurable parameters. Allows you to effectively follow the short-term trend. Usage: After the full formation of a candle colored in the opposite color to the previous candle, place a stop order at the high / low of such a candle. When the price overcomes such a high/low, a position will be opened. With the full formation of a candle p
Introduction It is common practice for professional trades to hide their stop loss / take profit from their brokers. Either from keeping their strategy to the themselves or from the fear that their broker works against them. Using this indicator, the stop loss / take profit points will be drawn on the product chart using the bid price. So, you can see exactly when the price is hit and close it manually.  Usage Once attached to the chart, the indicator scans the open orders to attach lines fo
Daily Candle Predictor est un indicateur qui prédit le cours de clôture d'une bougie. L'indicateur est principalement destiné à être utilisé sur les graphiques D1. Cet indicateur convient à la fois au trading forex traditionnel et au trading d'options binaires. L'indicateur peut être utilisé comme un système de trading autonome, ou il peut servir de complément à votre système de trading existant. Cet indicateur analyse la bougie actuelle, calcule certains facteurs de force à l'intérieur du corps
Market Profile 3
Hussien Abdeltwab Hussien Ryad
1 (1)
Market Profile 3 MetaTrader 4 indicator  — is a classic Market Profile implementation that can show the price density over time, outlining the most important price levels, value area, and control value of a given trading session. This indicator can be attached to timeframes between M1 and D1 and will show the Market Profile for daily, weekly, monthly, or even intraday sessions. Lower timeframes offer higher precision. Higher timeframes are recommended for better visibility. It is also possible t
FREE
L'unicité de cet indicateur réside dans l'algorithme de comptabilisation des volumes : l'accumulation se fait directement pour la période sélectionnée sans référence au début de la journée. Les dernières barres peuvent être exclues du calcul, alors les données courantes auront moins d'influence sur les niveaux significatifs (volumes) formés précédemment. Pour un calcul plus précis, les données du graphique M1 sont utilisées par défaut. L'étape de répartition des volumes de prix est réglementée.
The indicator allows you to trade binary options. The recommended time frame is М1 and the expiration time is 1,2,3 minutes. The indicator suitable for auto and manual trading. A possible signal is specified as a arrows above/under a candle. You should wait until the candle closes! Arrows are not re-painted Trade sessions: TOKYO section (Half-end) Currency pairs: USD/JPY Working time frame: M1 Expiration time: 1,2,3 minutes. The indicator also shows good results when using the martingale strateg
FREE
Simply The Best Pro
Szymon Palczynski
5 (1)
This indicator displays the histogram and arrows on chart. When Simple The Best Pro are placed on a chart, they identify the trend.  The color of may be blue or red. The blue color stands for upside moves and the red color stands for downside trends. The indicator offers to set Stop Loss (SL) and  Take Profit (TP)  setting. The default value is ATR. Indicator has automatic optimization. The STB is a unique indicator that shows the tendency (button Bars) of a particular signals. The STB tells us
The Penta-O is a 6-point retracement harmonacci pattern which usually precedes big market movements. Penta-O patterns can expand and repaint quite a bit. To make things easier this indicator implements a twist: it waits for a donchian breakout in the right direction before signaling the trade. The end result is an otherwise repainting indicator with a very reliable trading signal. The donchian breakout period is entered as an input. [ Installation Guide | Update Guide | Troubleshooting | FAQ | A
The   VWAP indicator   is our version of the popular Volume-Weighted Average Price indicator. The VWAP is the ratio between the value traded (price multiplied by the number of volume traded) and the total volume traded over a specific time period. As a result, it measures the average price of the instrument much better than the simple moving average. Although there are many ways to use the VWAP, most investors use it to calculate the daily average.  The indicator works in five modes: Moving  
The Visual Volatility Clustering indicator clusters the market based on volatility. The indicator does not redraw and gives accurate data, does not use closing prices. Uses the opening prices or the highs or lows of the previous completed bar. Therefore, all information will be clear and unambiguous. The essence of the indicator is to divide the price market into certain areas according to a similar type of volatility. This can be done in any way. In this example, the indicator is configured fo
VolumeProfile
Robert Hess
3.8 (5)
Descption: The Volume Profile displays detailed informations of historical trading activities at certain price levels (Market Profile). So you can locate the areas with the best prices in the market and get an advantage about other market participants. Features: Customizable Volume Profile / Market Profile Shows the "fair" Value Area with 70% of all Volume Shows critical low volume zones Shows VPOC, VAL and VAH Points Works on all timeframes Also available for MT5 ( https://www.mql5.com/en/m
CyberZingFx Trend Reversal
Afsal Meerankutty
4.07 (14)
Indicator captures the trend reversals with no-repaint Buy and Sell Arrow signals. CyberZingFx Trend Reversal Indicator - your go-to solution for accurate and reliable trend reversal signals. With its  advanced trading strategy , the indicator offers you Buy and Sell Arrow signals that do not repaint, making it a reliable tool for catching Swing Highs and Swing Lows in any market and any time frame. Indicator works on  any market  and  any time frames . __________________________________________
Blahtech Supply Demand
Blahtech Limited
4.57 (30)
Was: $299  Now: $99   Supply Demand uses previous price action to identify potential imbalances between buyers and sellers. The key is to identify the better odds zones, not just the untouched ones. Blahtech Supply Demand indicator delivers functionality previously unavailable on any trading platform. This 4-in-1 indicator not only highlights the higher probability zones using a multi-criteria strength engine, but also combines it with multi-timeframe trend analysis, previously confirmed swings
Forex Indicator  " ATR Trailing Stop"  for MT4 Upgrade   your trading methods with great auxiliary ATR Trailing Stop  indicator for MT4. This indicator is perfect for     Trailing Stop purpose ATR Trailing Stop   is  automatically adaptive   to market volatility No delays and easy set up This indicator is excellent to combine with price action entries into the direction of main trend // More great Expert Advisors and Indicators are available here:  https://www.mql5.com/en/users/def1380/seller It
The Chaikin Oscillator is a technical indicator developed by Marc Chaikin that combines price and volume data to measure the accumulation and distribution of a financial instrument. It aims to identify potential buying and selling opportunities in the market. The Chaikin Oscillator is calculated by subtracting a 10-day exponential moving average of the Accumulation Distribution Line (ADL) from a 3-day exponential moving average of the ADL. Here's how to use the Chaikin Oscillator indicator in tr
Zig Zag 123
Stephen Reynolds
Zig Zag 123 tells us when a reversal or continuation is more likely by looking at the shift in supply and demand. When this happens a signature pattern appears known as 123 (also known ABC) will often break out in direction of higher low or lower high. Stop loss and take profit levels have been added. There is a panel that shows the overall performance of your trades for if you was to use these stop loss and take profit levels.  We get alerted if a pattern 123 appears and also if the price
Displays the local time with the time difference you set. (It does not correspond to the time difference in 30-minute increments.) It also displays a price line with a good price, such as 100.000 .100 or .200. The standard gridlines are displayed with the time and price by MT4, but they are very confusing as they become the broker's time and are displayed at the halfway point along with the price. It hides them and displays gridlines at user-defined time differences and prices in easy-to-und
The   Visual Volatility Clustering   indicator clusters the market based on volatility. The indicator does not redraw and gives accurate data, does not use closing prices. Uses the opening prices or the highs or lows of the previous completed bar. Therefore, all information will be clear and unambiguous. The essence of the indicator is to divide the price market into certain areas according to a similar type of volatility. This can be done in any way. In this example, the indicator is configure
Time Bubble ***Specialized for GBPJPY 1H time frame*** (tested for two years with success rates about 82%) Time Circle's smart algorithm detects the price circles with time . give strong signals at the right time as result of combine the price and time. our team spent months to develop this indicator specially for GBPJPY ..with high success rates about 82% win trades over two years .tested from December 2016 to November 2018. *** in last two years total signals 1012 with 829 Wins and
Trend Bilio - an arrow indicator without redrawing shows potential market entry points in the form of arrows of the corresponding color: upward red arrows suggest opening a buy, green down arrows - selling. The entrance is supposed to be at the next bar after the pointer. The arrow indicator Trend Bilio visually "unloads" the price chart and saves time for analysis: no signal - no deal, if an opposite signal appears, then the current deal should be closed. It is Trend Bilio that is considered
Magic Filter MTF is perfect for any strategy. you do not need to load the chart with extra indicators like this one indicator will replace all additional filters for you it can also be a great strategy. it combines well with trading at local minima and maximums (resistance levels) multi-timeframe-multi-currency indicator 4 screen system is used 4 rows of arrows UTB indicators adjusted for different periods when two arrows pointing in the same direction on the same timeframe coincide
MarketProfile EForex
Veridiana Adorno Kendrick
Market Profile Shows where the price has spent more time, highlighting important levels that can be used in trading. It is a powerful tool which is designed to take the fundamental components which comprise every market; price/volume/time, and visually display their relationship in real-time as the market develops for a pre-determined time period. Very powerful tool!
Lisek Weis Wave
Darius Hans Lischka
5 (3)
This Weis Wave Volume indicator is a tool to help traders identify the current price trend.  Understanding volume can provide insight into a market's behavior to help you determine its overall health. The most important rule is this: volume precedes price. Typically, before a market price moves, volume comes into play. It has 2 main colors histogram which are green and red. – Green indicates an upward wave. The more the price increases, the bigger the green volume gets. – The red color shows a d
FREE
Volume by Price MT4
Brian Collard
4.6 (10)
The Volumebyprice.com Indicator for MetaTrader 4 features Volume Profile and Market Profile TPO (Time Price Opportunity). Volume and TPO histogram bar and line charts. Volume Footprint charts. TPO letter and block marker collapsed and split structure charts. Static, dynamic and flexible range segmentation and compositing methods with relative and absolute visualizations. Session hours filtering and segment concatenation with Market Watch and custom user specifications. Graphical layering, posit
SATL Candles 2 AM
Andriy Matviyevs'kyy
This indicator displays candle prices on the chart, colored in accordance with the data of the SATL digital filter built on closing prices. The indicator has no configurable parameters. Allows you to effectively follow a long-term trend. Usage: After the full formation of a candle colored in the opposite color to the previous candle, place a stop order at the high / low of such a candle. When the price overcomes such a high/low, a position will be opened. With the full formation of a candle pain
This is a new strategy for SUPPLY DEMAND areas It is based on a calculation using the tick volume to detect the big price action in market for both bear /bull actions this smart volume action candles are used to determine the supply and demand areas prices in between main supply and demand lines indicate sideway market  up arrows will be shown when prices moves above the main supply and the secondary supply lines Down arrows will be shown when prices moves below the main demand and the secondary
Les acheteurs de ce produit ont également acheté
Gann Made Easy
Oleg Rodin
4.84 (58)
Gann Made Easy est un système de trading Forex professionnel et facile à utiliser qui est basé sur les meilleurs principes de trading en utilisant la théorie de mr. WD Gann. L'indicateur fournit des signaux d'ACHAT et de VENTE précis, y compris les niveaux Stop Loss et Take Profit. Vous pouvez échanger même en déplacement en utilisant les notifications PUSH. S'il vous plaît contactez-moi après l'achat! Je partagerai avec vous mes astuces de trading et d'excellents indicateurs bonus gratuitement!
Atomic Analyst
Issam Kassas
5 (2)
Tout d'abord, il convient de souligner que cet indicateur de trading n'est ni repainting, ni redrawing et ne présente aucun délai, ce qui le rend idéal à la fois pour le trading manuel et automatisé. Manuel de l'utilisateur : réglages, entrées et stratégie. L'Analyste Atomique est un indicateur d'action sur les prix PA qui utilise la force et le momentum du prix pour trouver un meilleur avantage sur le marché. Équipé de filtres avancés qui aident à éliminer les bruits et les faux signaux, et à
TPSpro RFI Levels
Roman Podpora
4.8 (20)
Reversal First Impulse levels (RFI)    INSTRUCTIONS        RUS       -       ENG              R ecommended to use with an indicator   -   TPSpro  TREND PRO -  Version MT5 A key element in trading is zones or levels from which decisions to buy or sell a trading instrument are made. Despite attempts by major players to conceal their presence in the market, they inevitably leave traces. Our task was to learn how to identify these traces and interpret them correctly. Main functions: Displaying activ
Scalper Inside PRO
Alexey Minkov
4.69 (49)
An exclusive indicator that utilizes an innovative algorithm to swiftly and accurately determine the market trend. The indicator automatically calculates opening, closing, and profit levels, providing detailed trading statistics. With these features, you can choose the most appropriate trading instrument for the current market conditions. Additionally, you can easily integrate your own arrow indicators into Scalper Inside Pro to quickly evaluate their statistics and profitability. Scalper Inside
Trend Punch
Mohamed Hassan
5 (13)
This indicator is unstoppable when combined with our other indicator called  Support & Resistance . After purchase, send us a message and you will get it   for  FREE as a BONUS! Introducing Trend Punch , the revolutionary forex trend indicator that will transform the way you trade! Trend Punch is uniquely designed to provide precise buy and sell arrows during strong market trends, making your trading decisions clearer and more confident. Whether you're trading major currency pairs or exotic sym
Gold Stuff
Vasiliy Strukov
4.89 (202)
Gold Stuff est un indicateur de tendance conçu spécifiquement pour l'or et peut également être utilisé sur n'importe quel instrument financier. L'indicateur ne se redessine pas et ne traîne pas. Délai recommandé H1. Au niveau de l'indicateur de travail, l'Expert Advisor EA Gold Stuff est entièrement automatique. Vous pouvez le trouver sur mon profil. Vous pouvez obtenir une copie gratuite de notre indicateur Strong Support et Trend Scanner, veuillez envoyer un message privé. moi! Contactez
Trend Screener
STE S.S.COMPANY
4.79 (81)
Indicateur de tendance, solution unique révolutionnaire pour le trading et le filtrage des tendances avec toutes les fonctionnalités de tendance importantes intégrées dans un seul outil ! Il s'agit d'un indicateur multi-période et multi-devises 100 % non repeint qui peut être utilisé sur tous les symboles/instruments : forex, matières premières, crypto-monnaies, indices et actions. OFFRE À DURÉE LIMITÉE : L'indicateur Support and Resistance Screener est disponible pour seulement 100 $ et à vie.
Trend Pulse
Mohamed Hassan
5 (2)
Please contact me after purchase to immediately get your PDF strategy + documentation for Trend Pulse !  Official release price of $89  (3 /50 copies left). Next price is $199 . Introducing Trend Pulse , a unique and robust indicator capable of detecting bullish, bearish, and even ranging trends! Trend Pulse uses a special algorithm to filter out market noise with real precision. If the current symbol is moving sideways, Trend Pulse will send you a ranging signal, letting you know that it'
TPSproTREND PrO
Roman Podpora
4.79 (19)
TPSpro TREND PRO   est un indicateur de tendance qui analyse automatiquement le marché et fournit des informations sur la tendance et chacun de ses changements, ainsi que des signaux pour entrer dans des transactions sans redessiner ! L'indicateur utilise chaque bougie et les analyse séparément. faisant référence à différentes impulsions - impulsion ascendante ou descendante. Points d'entrée précis dans les transactions sur les devises, les crypto-monnaies, les métaux, les actions, les indices 
FX Power MT4 NG
Daniel Stein
5 (12)
Obtenez votre mise à jour quotidienne du marché avec des détails et des captures d'écran via notre Morning Briefing ici sur mql5 et sur Telegram ! FX Power MT4 NG est la nouvelle génération de notre très populaire indicateur de force des devises, FX Power. Et qu'est-ce que ce compteur de force de nouvelle génération offre ? Tout ce que vous avez aimé de l'original FX Power PLUS Analyse de la force de l'OR/XAU Des résultats de calcul encore plus précis Périodes d'analyse configurables individuel
ACTUELLEMENT 26% DE RÉDUCTION La meilleure solution pour tout débutant ou trader expert ! Cet indicateur est un outil de trading unique, de haute qualité et abordable car nous avons incorporé un certain nombre de caractéristiques exclusives et une nouvelle formule. Avec seulement UN graphique, vous pouvez lire la force de la devise pour 28 paires Forex ! Imaginez comment votre trading va s'améliorer parce que vous êtes capable de repérer le point de déclenchement exact d'une nouvelle tendan
Advanced Supply Demand
Bernhard Schweigert
4.9 (271)
CURRENTLY 26% OFF !! Best Solution for any Newbie or Expert Trader! This indicator is a unique, high quality and affordable trading tool because we have incorporated a number of proprietary features and a new formula. With this update, you will be able to show double timeframe zones. You will not only be able to show a higher TF but to show both, the chart TF, PLUS the higher TF: SHOWING NESTED ZONES. All Supply Demand traders will love it. :) Important Information Revealed Maximize the potenti
Présentation       Quantum Trend Sniper Indicator   , l'indicateur révolutionnaire MQL5 qui transforme la façon dont vous identifiez et négociez les inversions de tendance ! Développé par une équipe de traders expérimentés avec une expérience commerciale de plus de 13 ans,       Indicateur Quantum Trend Sniper       est conçu pour propulser votre parcours de trading vers de nouveaux sommets grâce à sa manière innovante d'identifier les inversions de tendance avec une précision extrêmement élevée
Actuellement 20% de réduction ! La meilleure solution pour tout débutant ou trader expert ! Ce logiciel de tableau de bord fonctionne sur 28 paires de devises. Il est basé sur 2 de nos principaux indicateurs (Advanced Currency Strength 28 et Advanced Currency Impulse). Il donne un excellent aperçu de l'ensemble du marché Forex. Il montre les valeurs de l'Advanced Currency Strength, la vitesse de mouvement des devises et les signaux pour 28 paires de devises dans tous les (9) délais. Imagine
ACTUELLEMENT 31% DE RÉDUCTION ! ! La meilleure solution pour tout débutant ou Expert Trader ! Cet indicateur est un outil de trading unique, de haute qualité et abordable car nous avons incorporé un certain nombre de caractéristiques exclusives et une formule secrète. Avec seulement UN graphique, il donne des alertes pour les 28 paires de devises. Imaginez comment votre trading s'améliorera parce que vous serez capable de repérer le point de déclenchement exact d'une nouvelle tendance ou d'
Bomb Bank Signal
Igor Pereira Calil
Signal Bomb Bank : votre indicateur de confiance dans MetaTrader 4 Bomb Bank Signal est un indicateur puissant pour MetaTrader 4, conçu pour identifier les tendances les plus pertinentes du marché financier. Si vous recherchez un outil qui anticipe avec précision les mouvements, la Bomb Bank est l’alliée qu’il vous faut. Comment ça marche : Cet indicateur combine trois méthodes distinctes – analyse de volume, clôture de bougie et tendance symétrique – pour détecter et signaler les opportu
- Real price is 80$ - 40% Discount ( It is 49$ now ) Contact me for instruction, any questions! Related EA Product: Bitcoin Expert Introduction The breakout and retest strategy is traded support and resistance levels. it involves price breaking through a previous level.  The break and retest strategy is designed to help traders do two main things, the first is to avoid false breakouts. Many false breakouts start with a candlestick that breaks out of a level but ends with an immediate candlestic
Tout d'abord, il convient de souligner que cet outil de trading est un indicateur non repeint, non redessiné et non retardé, ce qui le rend idéal pour le trading professionnel. Cours en ligne, manuel utilisateur et démonstration. L'indicateur Smart Price Action Concepts est un outil très puissant à la fois pour les nouveaux et les traders expérimentés. Il regroupe plus de 20 indicateurs utiles en un seul, combinant des idées de trading avancées telles que l'analyse du trader Inner Circle et les
Currency Strength Wizard est un indicateur très puissant qui vous offre une solution tout-en-un pour un trading réussi. L'indicateur calcule la puissance de telle ou telle paire de devises en utilisant les données de toutes les devises sur plusieurs périodes. Ces données sont représentées sous la forme d'un indice de devise facile à utiliser et de lignes électriques de devise que vous pouvez utiliser pour voir la puissance de telle ou telle devise. Tout ce dont vous avez besoin est d'attacher l'
Order Block Hunter
Noha Mohamed Fathy Younes Badr
5 (1)
Order block hunter indicator is the best indicator for  hunt the order blocks that area where there has been a large concentration of limit orders waiting to be executed Order blocks are identified on a chart by observing previous price action and looking for areas where the price experienced significant movement or sudden changes in direction .This indicator does that for you by using very complicated codes and helps you to take the best areas To buy and sell because it make marks at the best a
Scalper Vault
Oleg Rodin
5 (22)
Scalper Vault est un système de scalpage professionnel qui vous fournit tout ce dont vous avez besoin pour un scalpage réussi. Cet indicateur est un système de trading complet qui peut être utilisé par les traders de forex et d'options binaires. Le délai recommandé est M5. Le système vous fournit des signaux fléchés précis dans le sens de la tendance. Il vous fournit également des signaux supérieurs et inférieurs et des niveaux de marché Gann. Les indicateurs fournissent tous les types d'alertes
Découvrez le secret pour réussir le trading Forex avec notre indicateur MT4 personnalisé! Vous êtes-vous déjà demandé comment réussir sur le marché du Forex, gagnant régulièrement des bénéfices tout en minimisant les risques? Voici la réponse que vous avez recherchée! Permettez-nous d'introduire notre indicateur MT4 propriétaire qui révolutionnera votre approche du trading. Polyvalence unique Notre indicateur est spécialement conçu pour les utilisateurs qui préfèrent les formations de bou
TakePropips Donchian Trend Pro
Eric John Pajarillaga Aldana
5 (11)
TakePropips Donchian Trend Pro   (MT4) est un outil puissant et efficace qui détecte automatiquement la direction de la tendance à l'aide du canal Donchian et vous fournit des signaux de trading d'entrée et de sortie ! Cet indicateur multifonction comprend un scanner de tendance, des signaux de trading, un panneau statistique, un filtre, des sessions de trading et un tableau de bord de l'historique des alertes. Il est conçu pour vous fournir des signaux de trading et vous faire gagner des heures
VEUILLEZ LIRE LES INFORMATIONS CI-DESSOUS AVANT D'ACHETER LE PRODUIT! Apollo Pips PLUS SP est un produit unique! C'EST POUR CEUX QUI VEULENT OBTENIR MON NOUVEL INDICATEUR "APOLLO PIPS" PLUS BONUS "SUPER PACK" AVEC ACCÈS À TOUS MES INDICATEURS DE TRADING! En achetant le produit Apollo Pips PLUS SP, vous achetez en fait une toute nouvelle version de mon indicateur Apollo Pips. Cette version de l'indicateur dispose d'un algorithme amélioré et d'un paramètre facile à utiliser qui vous donne la possi
FX Volume
Daniel Stein
4.48 (27)
Obtenez votre mise à jour quotidienne du marché avec des détails et des captures d'écran via notre Morning Briefing ici sur mql5 et sur Telegram ! FX Volume est le PREMIER et SEUL indicateur de volume qui fournit un VRAI aperçu du sentiment du marché du point de vue d'un courtier. Il fournit des informations impressionnantes sur la façon dont les acteurs institutionnels du marché, comme les courtiers, sont positionnés sur le marché des changes, bien plus rapidement que les rapports COT. Voir c
Currency Strength Exotics
Bernhard Schweigert
4.86 (29)
ACTUELLEMENT 20% DE RÉDUCTION ! La meilleure solution pour tout débutant ou trader expert ! Cet indicateur est spécialisé pour montrer la force de la devise pour tous les symboles comme les paires exotiques, les matières premières, les indices ou les contrats à terme. C'est le premier de son genre, n'importe quel symbole peut être ajouté à la 9ème ligne pour montrer la force réelle de la devise de l'or, l'argent, le pétrole, DAX, US30, MXN, TRY, CNH etc. Il s'agit d'un outil de trading uniq
IX Power MT4
Daniel Stein
5 (5)
IX Power apporte enfin la précision imbattable de FX Power aux symboles non-Forex. Il détermine avec précision l'intensité des tendances à court, moyen et long terme de vos indices, actions, matières premières, ETF et même crypto-monnaies préférés. Vous pouvez analyser tout ce que votre terminal a à offrir. Essayez-le et découvrez comment votre timing s'améliore considérablement lors de vos transactions. Caractéristiques principales d'IX Power Résultats de calcul précis à 100 %, sans ré
Entry Points Pro
Yury Orlov
4.55 (143)
Indicateur supérieur pour MT4 fournissant des signaux précis pour entrer dans un trade sans repeindre ! Il peut être appliqué à tous les actifs financiers : forex, cryptocurrencies, métaux, actions, indices.  La version MT5 est ici Il fournira des signaux de trading assez précis et vous dira quand il est préférable d'ouvrir un trade et de le fermer. Regardez la vidéo (6:22) avec un exemple de traitement d'un seul signal qui a rapporté à l'indicateur ! La plupart des traders améliorent l
M1 Arrow
Oleg Rodin
4.67 (12)
Une stratégie intraday basée sur deux principes fondamentaux du marché. L'algorithme est basé sur l'analyse des volumes et des vagues de prix à l'aide de filtres supplémentaires. L'algorithme intelligent de l'indicateur ne donne un signal que lorsque deux facteurs de marché se combinent en un seul. L'indicateur calcule les vagues d'une certaine plage sur le graphique M1 en utilisant les données de la période la plus élevée. Et pour confirmer la vague, l'indicateur utilise une analyse en volume.
You will get Huge Bonus in case of Full Purchase (not for Rent) contact me after purchase, Leave comment or DM me. Backtest and Read Overview Before buying Chart patterns have been a topic of debate among traders; some believe they are reliable signalers, while others do not. Our Chart Patterns All-in-One indicator displays various chart patterns to help you test these theories for yourself. The profitability of these patterns is not a reflection of the indicator's effectiveness but rather an ev
Plus de l'auteur
TTF Candles AM
Andriy Matviyevs'kyy
This indicator displays the moment when the TTF oscillator crosses the zero value, and the moment when the TTF oscillator crosses its smoothed value. Crossing the zero value by the TTF oscillator is a buy/sell signal. If the TTF oscillator crosses its smoothed value, it is a signal of a trend change. The signal is given after the end of the formation of the candle. The signal is confirmed when the price crosses the high/low of the bar on which the signal was given. The indicator does not redraw.
TTF Osc AM
Andriy Matviyevs'kyy
This indicator displays the moment when the TTF oscillator crosses the zero value, and the moment when the TTF oscillator crosses its smoothed value. Crossing the zero value by the TTF oscillator is a buy/sell signal. If the TTF oscillator crosses its smoothed value, it is a signal of a trend change. The signal is given after the end of the formation of the candle. The signal is confirmed when the price crosses the high/low of the bar on which the signal was given. The indicator does not redraw.
FATL Momentum AM
Andriy Matviyevs'kyy
This technical indicator is a Momentum indicators built using a fast adaptive digital filter - FATL. In a simplified sense, an adaptive digital filter is a moving average with effective smoothing. Using a digital filter allows you to smooth out sharp fluctuations with minimal signal delay. Using the indicator: It should be taken into account that the values ​​of the indicator on the zero bar (which has not finished forming yet) may change, so decisions should be made after the end of the bar for
Zone Trade AM
Andriy Matviyevs'kyy
The indicator is based on the elements of Bill Williams' trading system. Sell signals are formed when MACD and OsMA values are falling simultaneously (Bill Williams calls these indicators АО and АС in his book), while buy signals appear when both indicators are rising. Thick and thin colored histograms match MACD and OsMA values. If the histogram is greater than 0, the indicator value is rising. Otherwise, it is falling. Positions should be opened when the price exceeds the bar's high or low, at
ADX Trigger AM
Andriy Matviyevs'kyy
The indicator is an interpretation of the Average Directional Movement Index (ADX) allowing you to determine if there is a price trend. It was developed by Welles Wilder and described in his book "New concepts in technical trading systems". The indicator determines entry points and uses crossing of ADX +/- lines and growth or fall of the main ADX line. When the indicator crosses the zero line, the trend is changed. If the oscillator's value is 1 - the price grows, the trend remains; If the oscil
BarLineBreak AM
Andriy Matviyevs'kyy
The indicator detects the current trend using the following definition: A trend is a market situation when each subsequent peak is higher/lower than the previous one, as well as each subsequent bottom is higher/lower than the previous one. Exceeding all previous peaks/bottoms on the specified amount of bars by the current peak/bottom is considered to be a beginning of a new trend. The indicator paints bars according to an identified trend. The indicator does not repaint. Settings: Lines_Bre
RSI Signal AM
Andriy Matviyevs'kyy
This indicator displays the signals based on the values of the classic RSI indicator on the price chart. The RSI can be used for determining the overbought or oversold areas on the chart. Reaching these levels means that the market can soon turn around, but it does not give signal, as in a strong trend the market can stay in the overbought or oversold state for quite a long time. As with most oscillators, the signals are generated when leaving these areas. This indicator allows to display three
WPR Signal AM
Andriy Matviyevs'kyy
This indicator displays the signals based on the values of the classic WPR indicator. The WPR indicator can be used for determining the overbought or oversold areas on the chart. Reaching these levels means that the market can soon turn around, but it does not give signal, as in a strong trend the market can stay in the overbought or oversold state for quite a long time. As with most oscillators, the signals are generated when leaving these areas. This indicator allows to display three types of
CCI Signal AM
Andriy Matviyevs'kyy
This indicator displays the signals based on the values of the classic CCI indicator on the price chart. The CCI can be used for determining the overbought or oversold areas on the chart. Reaching these levels means that the market can soon turn around, but it does not give signal, as in a strong trend the market can stay in the overbought or oversold state for quite a long time. As with most oscillators, the signals are generated when leaving these areas. This indicator allows to display three
DeM Signal AM
Andriy Matviyevs'kyy
This indicator displays the moment when the DeMarker oscillator crosses its smoothed value. If the DeMarker oscillator crosses its smoothed value, it is a signal of a trend change. The signal is given after the end of the formation of the candle. The signal is confirmed when the price crosses the high/low of the bar on which the signal was given. The indicator does not redraw. Custom Parameters: DeM_Period (>1) - DeMarker indicator period; MA_Period - period for smoothing DeMarker indicator va
ADX Signal AM
Andriy Matviyevs'kyy
The indicator is an interpretation of the Average Directional Movement Index (ADX) allowing you to determine if there is a price trend. It was developed by Welles Wilder and described in his book "New concepts in technical trading systems". The indicator shows signals on the price chart when +DI и -DI intersect and when an ADX value rises or falls relative to the +DI и -DI positional relationship. The indicator's buy signals work just like a support level, while the sell signals work like a resi
Impulsive Trade AM
Andriy Matviyevs'kyy
This indicator displays elements of the trading system described by Alexander Elder. This indicator uses the idea of opening sell deals in the period of MACD (or OsMA) falling below zero and opening buy deals when the indicator values rise above zero, in case this fall or rise coincide with the Moving Average direction. The thick and thin histograms correspond to the values of MACD and OsMA. If a histogram is above 0, the indicator value is greater than 0. If it is below, the indicator value is
FATL Arrows AM
Andriy Matviyevs'kyy
This indicator generates signals when the close price values ​​go beyond the channel built using the FATL fast digital filter. Application is extremely simple: The up arrow is a buy signal. Down arrow - sell signal. The signal must be confirmed by the price breaking the high/low of the bar on which the signal was given. The indicator is effective for trend trading. Thus, to open a position, it is necessary to take into account the trend of a higher period. Signals against the trend of a higher p
RSX Signal AM
Andriy Matviyevs'kyy
The indicator displays the signals of the RSX oscillator. The main type of signal is given when the oscillator exceeds the 0 value. If the "Sensitivity" parameter increases above zero, the main signal will also be given when overbought/oversold levels are overcome, defined as zero plus sensitivity and zero minus sensitivity. An additional signal is given when the direction of the oscillator line changes. It is optimal to use the indicator signals as signals to open a trade when the price overcom
Stop Bar AM
Andriy Matviyevs'kyy
The indicator accurately identifies a short-term trend both on trend and flat markets. The confirmation of the signal is the overcoming by the price of the high/low of the bar on which the signal was given. Signals are given on fully formed bars and are not redrawn. Calculations are based on the system of Moving Averages. The indicator is highly sensitive. Use it together with other technical analysis indicators. Settings: Sensitivity - amount of bars for the indicator calculation (1 or higher
MFI Signal AM
Andriy Matviyevs'kyy
5 (1)
This indicator displays the signals based on the values of the classic Money Flow Index (MFI) indicator on the price chart. The volume is considered during the calculation of the MFI values. The MFI can be used for determining the overbought or oversold areas on the chart. Reaching these levels means that the market can soon turn around, but it does not give signal, as in a strong trend the market can stay in the overbought or oversold state for quite a long time. As with most oscillators, the s
ADX Candles AM
Andriy Matviyevs'kyy
This indicator colors candles in accordance with the projected price movement. The analysis is based on the values of the classic ADX. If the DMI+ line is above the DMI- line - the candlestick is painted in color that signals a price growth; If the DMI+ line is below the DMI- line - the candlestick is painted in color that signals a price fall. The indicator does not redraw on completed candlesticks. The forming candlestick can change its color depending on the current data. Thus, it is recommen
SuperTrend AM
Andriy Matviyevs'kyy
SuperTrend AM is an indicator that allows you to open a position at the very beginning of a significant price movement. The second most important quality of the indicator is the ability to follow the trend as long as possible in order to obtain all potential profits while minimizing potential losses. This indicator does not repaint or not recalculate. A version of this indicator with advanced settings and signal notifications is  SuperTrend 3 AM . Signal of the indicator: red arrow appearing a
HyperSignal AM
Andriy Matviyevs'kyy
The  indicator generates signals for opening positions. The principle of operation is to compare the current average price with a range of average prices over a longer period. The signals are confirmed when the price exceeds the High/Low of the bar where the indicator generated the signal.  Maintenance of an open position is carried out on a smaller TF. Indicator signals to open an opposite position on a smaller TF are a signal to close the deal. This indicator does not repaint or not recalculat
EasyTrend AM
Andriy Matviyevs'kyy
EasyTrend AM is an indicator that allows you to open a position at the very beginning of a significant price movement. The second most important quality of the indicator is the ability to follow the trend as long as possible in order to obtain all potential profits while minimizing potential losses. This indicator does not repaint or not recalculate. A version of this indicator with advanced settings and signal notifications is EasyTrend 3 AM . Signal of the indicator: red arrow appearing abov
FATL Line AM
Andriy Matviyevs'kyy
The presented indicator is a moving average based on the fast digital filter (FATL) data. Using the indicator is similar to using a standard moving average: For small values ​​of the period of the moving average (1-10): Buying/selling is carried out at the moment of changing the direction of the moving average (after the price has overcome the high/low of the bar on which the change of direction occurred). For large values ​​of the period of the moving average: Buying / selling is carried out de
ZT Signal AM
Andriy Matviyevs'kyy
The indicator displays elements of the trading system, name trading in the zone, described by Bill Williams. Sell signals are formed when MACD and OsMA values are falling simultaneously (Bill Williams calls these indicators АО and АС in his book), while buy signals appear when both indicators are rising. The indicator has no configurable parameters. (Indicator variant in which MACD and OsMA parameters can be changed - ZT Signal 2 AM ). The indicator signals are confirmed when the price exceeds t
Fine Trade AM
Andriy Matviyevs'kyy
Not all price changes can be used for trading, as small price fluctuations do not allow you to make a profit. The presented indicator with high efficiency gives signals about the moments of a significant change in the direction of price movement. The indicator is intuitive and easy to use. The indicator signal is generated after the completion of the bar, where the indicator changes its position relative to zero. Never repaints signal. The indicator signals must be confirmed by the price exceedi
TTF Line AM
Andriy Matviyevs'kyy
The indicator analyzes TTF and ATR data to define the current trend and allow traders to gain maximum profit from strong price movements. The indicator is intuitively clear: line direction change - trend direction change. Change of the line color warns of a coming direction change. Customized parameters: Ind_Period (>1) - TTF calculation period; Sensitivity (>1) - ATR sensitivity. Alerts - show a dialog box containing user data; Send_Mail - sends an email using an address specified on the Em
Step RSI AM
Andriy Matviyevs'kyy
This indicator is an interpretation of the values of the classic indicator - RSI. A filter is used to smooth the sharp fluctuations of the indicator values, eliminating the weak changes and focusing the trader's attention on strong fluctuations of values. The indicator is not redrawn on completed bars. For greater efficiency of this indicator, it should be used in conjunction with the indicators that identify the trend direction, as well as support/resistance levels. Signals: Histogram crossing
ADX Line AM
Andriy Matviyevs'kyy
The indicator analyzes ADX and ATR data to define the current trend and allow traders to gain maximum profit from strong price movements. The indicator is intuitively clear: line direction change - trend direction change. Change of the line color warns of a coming direction change. Extended version of this indicator - Line on Osc . Customized parameters: Ind_Period (>1) - ADX calculation period; Sensitivity (>1) - ATR sensitivity. Alerts - show a dialog box containing user data; Send_Mail - send
FATL cci AM
Andriy Matviyevs'kyy
The product combines the best features of the standard CCI oscillator with the adaptive digital filter. The indicator allows entering and exiting the market at the very beginning and end of a trend. The indicator generates high-probability signals while retaining high sensitivity. The indicator does not repaint on fully formed bars. Options: Ind_Price - price used for the indicator calculation; Ind_Period - indicator period. Application rules: A big red dot - a strong bearish trend, if the price
FATL Alligator AM
Andriy Matviyevs'kyy
This indicator is a combination of classic trend indicator and signals of the fast digital filter. The indicator has no configurable parameters. The signals are displayed on completed bars and are not redrawn. It shows high efficiency on periods greater than 1 hour. The usage principle is intuitive - trade in the direction shown by the fan of moving averages. Enter once the price exceeds the High/Low of the bar where the signal was formed. Exit on the opposite conditions.
SATL Alligator AM
Andriy Matviyevs'kyy
This indicator is a combination of classic trend indicator and signals of the slow digital filter. The indicator has no configurable parameters. The signals are displayed on completed bars and are not redrawn. It shows high efficiency on periods less than 1 hour. The usage principle is intuitive - trade in the direction shown by the fan of moving averages. Enter once the price exceeds the High/Low of the bar where the signal was formed. Exit on the opposite conditions.
Laguerre Osc 2 AM
Andriy Matviyevs'kyy
The presented indicator uses the Laguerre filter to build an oscillator. The indicator has the possibility of double additional smoothing, which can be useful for small values ​​of the Gamma parameter. The indicator gives three types of signals: Exit of the oscillator from the overbought / oversold zone; The oscillator crossing the middle of the value between the overbought/oversold zones; The oscillator enters the overbought/oversold zone. On fully formed candles, the indicator does not redraw.
Filtrer:
Aucun avis
Répondre à l'avis