KT Momentum Histogram MT4
- Indicateurs
- KEENBASE SOFTWARE SOLUTIONS
- Version: 1.0
- Activations: 5
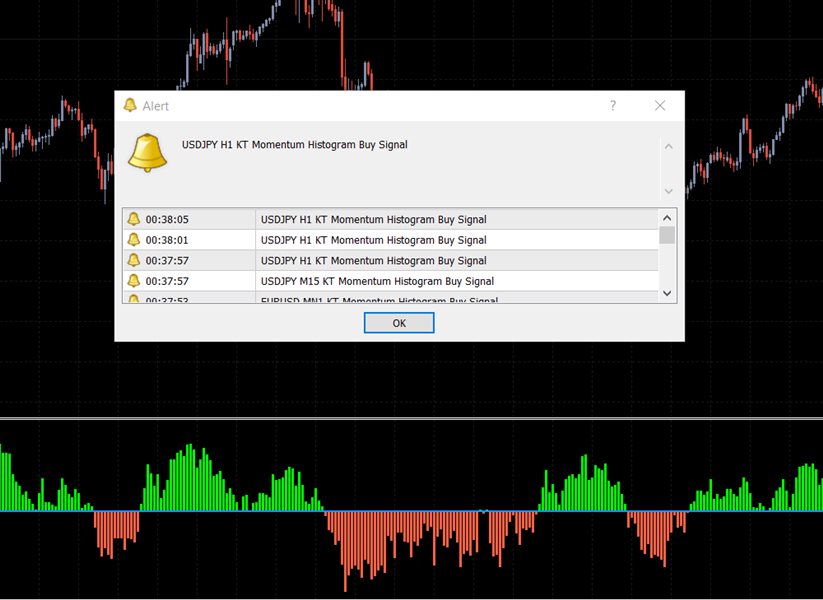
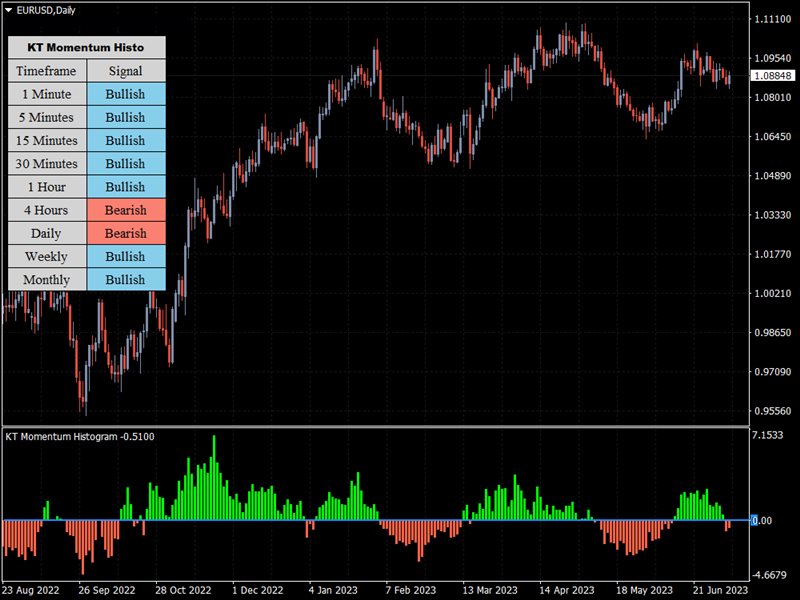
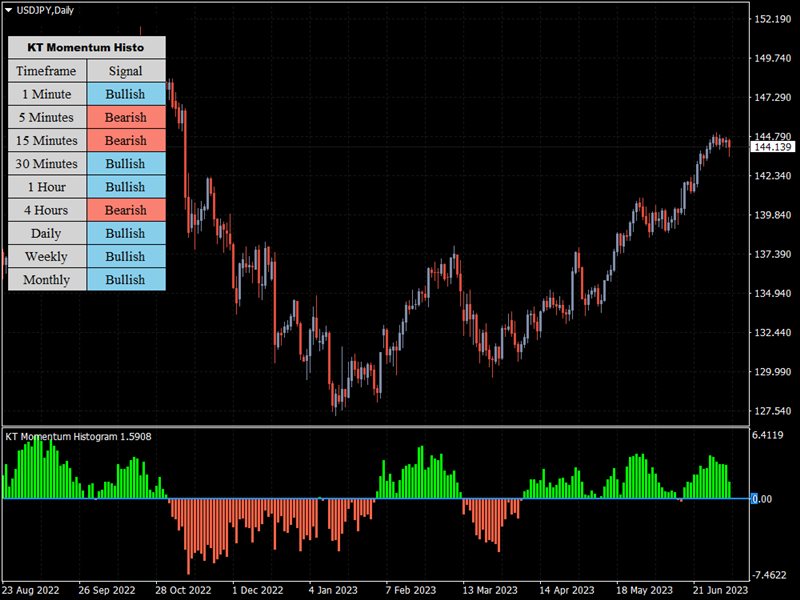
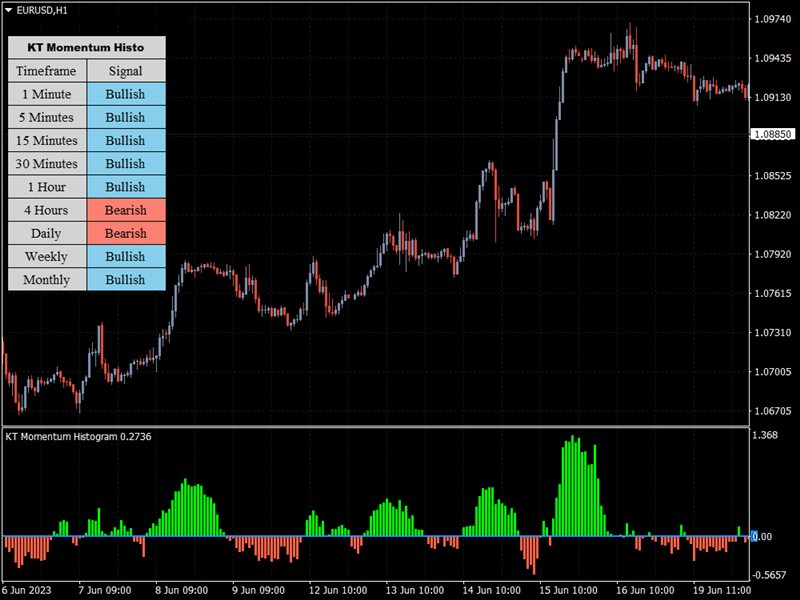
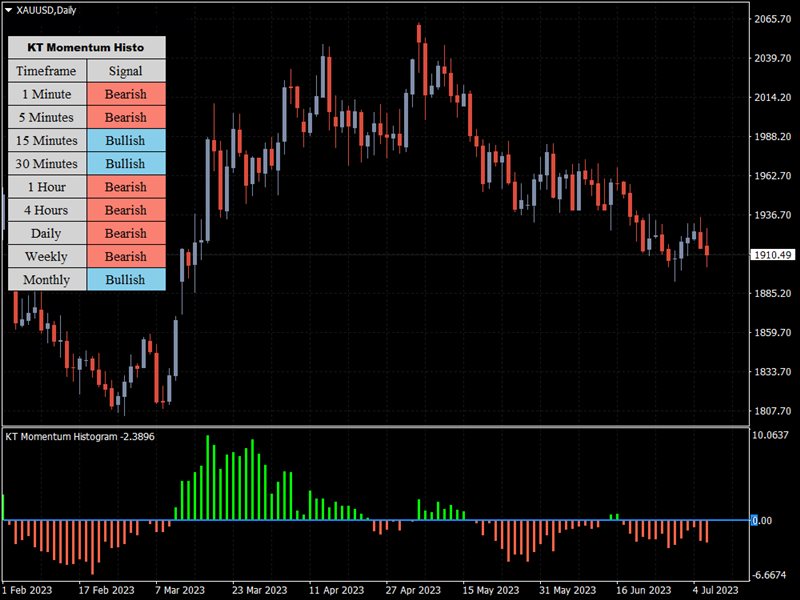
KT Momentum Histogram provides traders with a visualization of the momentum of a particular asset, which helps determine the strength and potential direction of a market trend. The indicator calculates and operates based on momentum in trading.
What Exactly is a Momentum Histogram
Momentum is the rate of acceleration of an asset's price or volume. In other words, it measures the speed at which the price of an asset is moving in a particular direction over a specific period of time. Positive momentum indicates rising prices, while negative momentum signifies falling prices. The momentum histogram is a series of vertical bars (histogram) oscillating around a zero line.
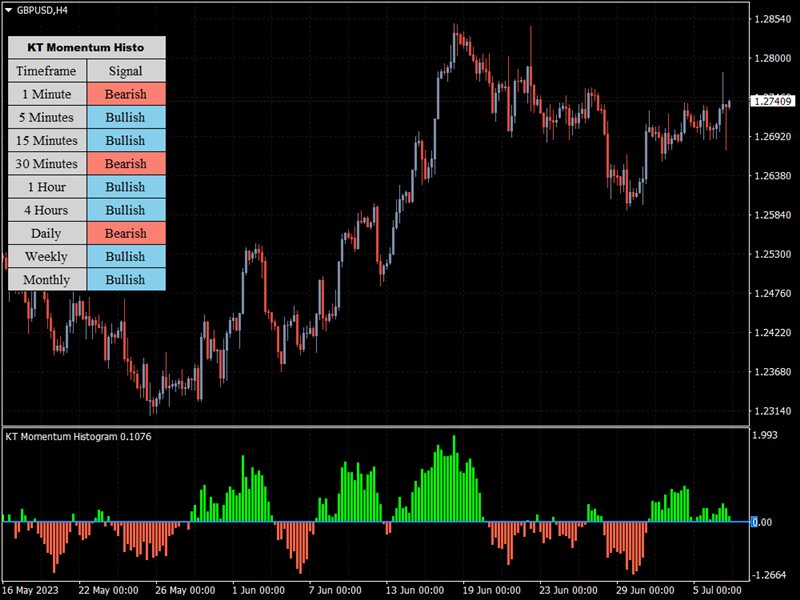
When the bars are above the zero line, it's generally seen as bullish momentum, and when they are below, you can consider that as a bearish momentum alert. The higher or lower the bars, the stronger the momentum.
Features
- Trend Identification: It's a fantastic tool for identifying the prevailing trend of an asset. When the histogram bars cross above the zero line, it may indicate initiating a bullish trend. When the bars cross below, it could suggest a bearish trend.
- Momentum Magnitude: Larger bars indicate stronger momentum, and smaller bars imply weaker momentum. This can assist traders in determining the force behind a trend and potentially predict how long it might last.
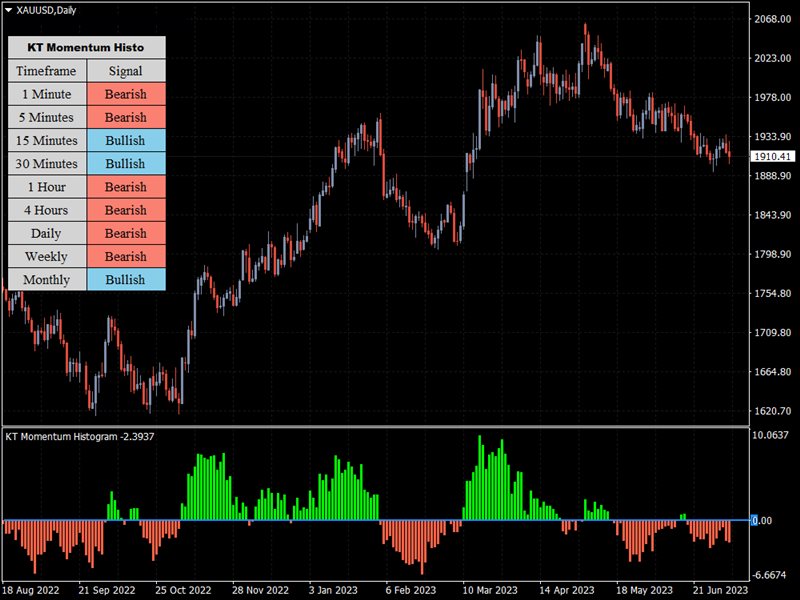
- Overbought/Oversold Conditions: When the histogram bars reach extreme positive values, it may indicate an overbought condition, implying a potential price drop. Conversely, when bars reach extreme negative values, it might suggest an oversold condition, implying a potential price increase.
- Divergence Detection: If the price is making higher highs, but the histogram is making lower highs, it's a bearish divergence. Conversely, if the price is making lower lows, but the histogram is making higher lows, it's a bullish divergence.
Pro-Tips
- Understand Market Context: For instance, strong bearish momentum confirmation during a broader uptrend could merely be a retracement rather than a complete trend reversal.
- Looks for Divergences: Divergences between the Momentum Histogram and price can strongly signal potential reversals.
- Overbought/Oversold is not Always Reversal Signals: While extreme readings might indicate overbought or oversold conditions, they are not necessarily immediate signals for a reversal. Sometimes, strong bullish or bearish momentum can continue for an extended period.
- Use Risk Management: Always use appropriate risk management techniques like setting stop losses and take profit levels, and never risk more than a small percentage of your trading capital on a single trade.
