RelicusRoad MACD v2 MT5
- Indicateurs
- Relicus LLC
- Version: 2.0
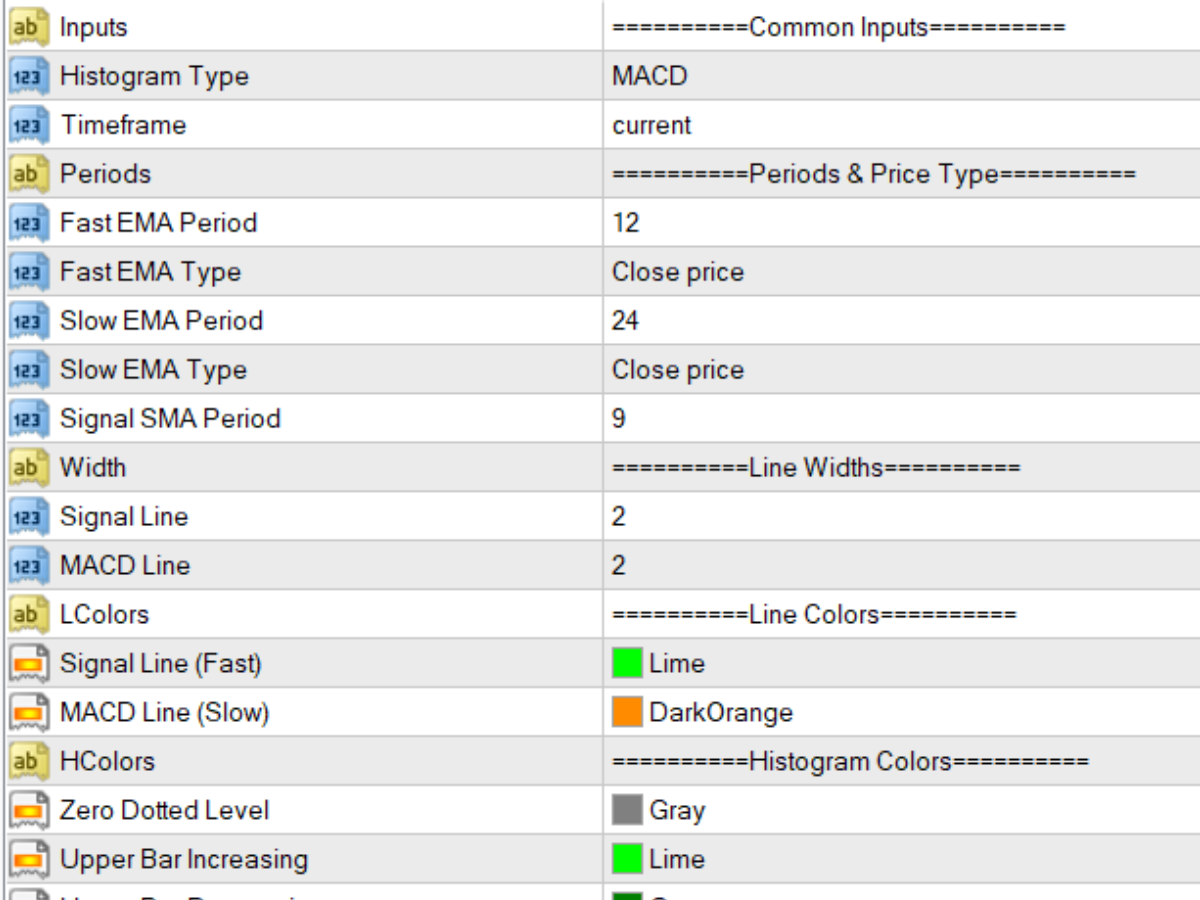
La stratégie de trading Moving Average Convergence Divergence (MACD) est un outil d'analyse technique populaire utilisé pour identifier les changements de momentum et de direction de tendance. Le MACD est calculé en soustrayant la moyenne mobile exponentielle (EMA) sur 26 périodes de la EMA sur 12 périodes. Une EMA sur 9 périodes, appelée "ligne de signal", est ensuite tracée sur le MACD pour agir comme déclencheur des signaux d'achat et de vente.
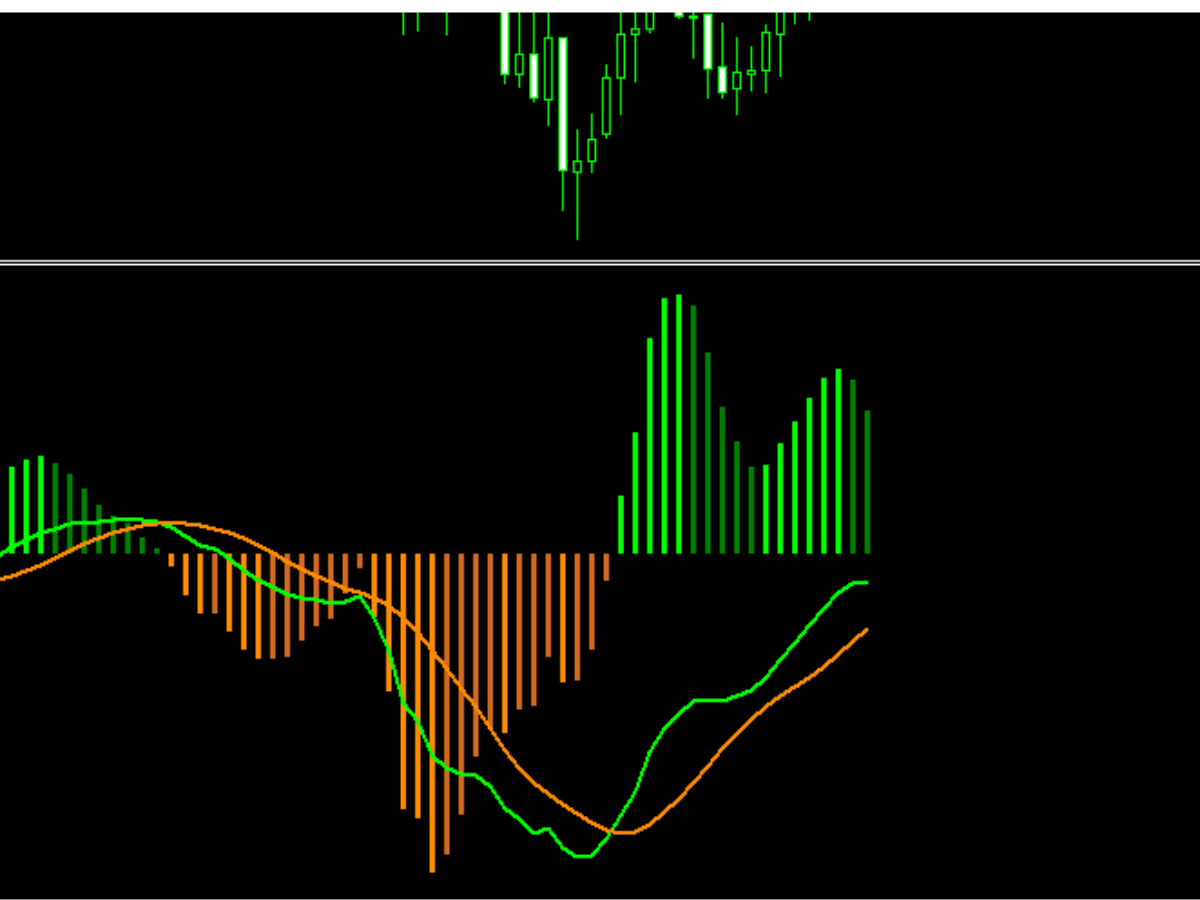
Le MACD est considéré comme étant en territoire haussier lorsque la ligne MACD est au-dessus de la ligne de signal et en territoire baissier lorsqu'elle est en dessous. Les traders utilisent souvent cette information pour identifier les opportunités d'achat et de vente potentielles.
Le MACD est un indicateur polyvalent et peut être utilisé de plusieurs façons, les plus courantes sont :
- Croisement : Un croisement haussier se produit lorsque la ligne MACD croise la ligne de signal vers le haut et un croisement baissier se produit lorsque la ligne MACD croise la ligne de signal vers le bas.
- Divergence : Une divergence haussière se produit lorsque le MACD atteint de nouveaux sommets alors que le titre sous-jacent ne le fait pas, et une divergence baissière se produit lorsque le MACD atteint de nouveaux creux alors que le titre sous-jacent ne le fait pas.
- Suivi de tendance : Une tendance haussière se produit lorsque le MACD est au-dessus de la ligne zéro et une tendance baissière se produit lorsque le MACD est en dessous de la ligne zéro.
Il est important de noter que le MACD est un indicateur retardé et doit être utilisé en conjonction avec d'autres indicateurs techniques et analyses pour prendre une décision de trading.


Great indicator