• Aperçu
  • Avis (1)
  • Commentaires
  • Nouveautés

ON Trade Pulse Cycle

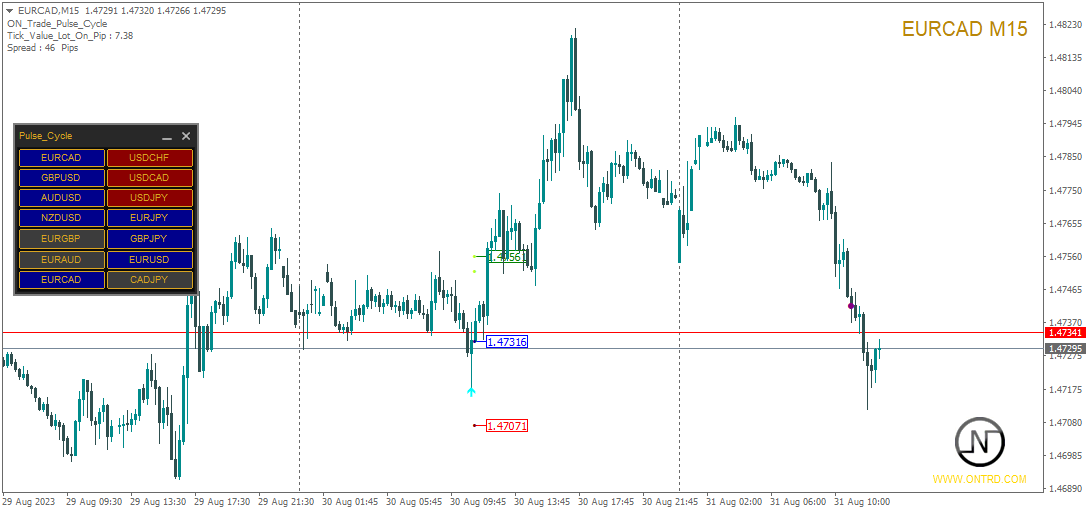
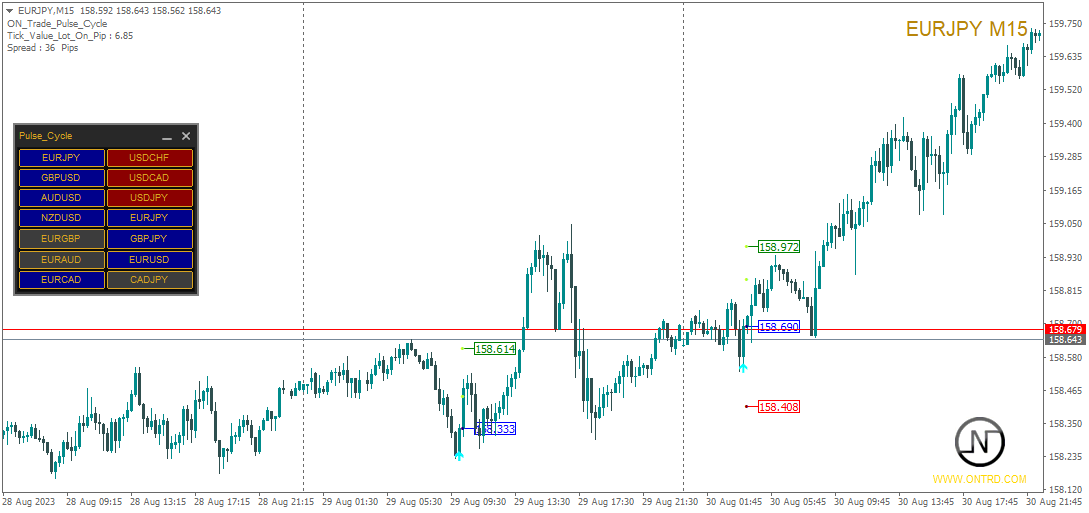
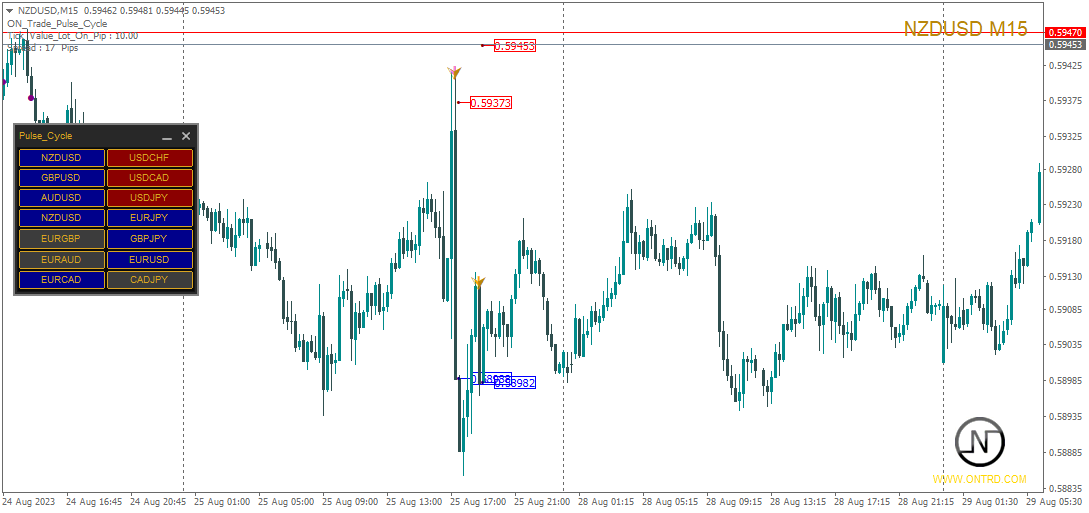
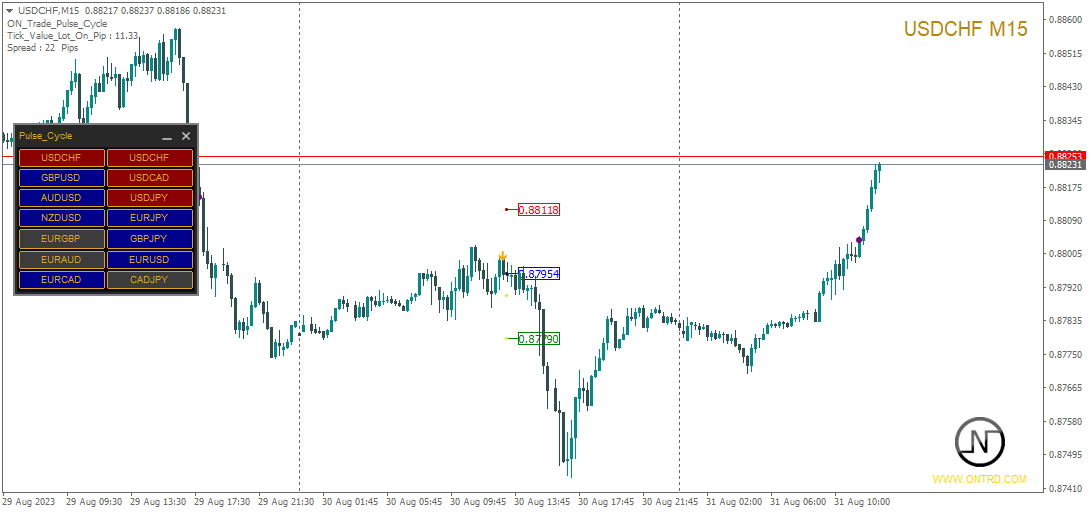
This indicator will give you entries as result of scalping strategy that will be applied on 14 symbols in same time and you are able to be notified with this entries 


Note :  

This indicator for scalping on 5 minutes timeframe only .


How to use it :

1-Open chart and adjust settings (edit symbols names as your platform names , activate the alert system if you need it .

2-Wait for any signal you have it from this scanner you will have it as alert and as notification and you will see it on board ,

3- There is 2 signals types the first one is the trend side if it will go upper or lower and you can enter market depend on it with SL with space of 2 points of latest support or resistance and it will appear as button color on board if the trend is for buy the button color will blue and red for sell , the second signal is for entries while trend is running (if indicator find good entry while there is a trend running on a symbol it will notify you also and you will see the symbol name colored also )

4-Open order after you have the alert or notify from indicator with money management as we said Sl point will be in space of 2 points over or lower latest support or resistant and the first target 15 points the second target is 2*SL space 

Parameters:

Use_System_Theme- Enable Or Disable Using of indicator themes;

Symbols_Names - Names of symbols you need to scan you can edit them if they are different of what you have in your platform if they have prefix or suffix

Alerts_for_Signal - Enable/Disable The Signal alert System .

Alerts_for_Trend  Enable/Disable The Trend alert System .

Use_Time_Filter  Enable/Disable The Time Filter System .

Start_Hour - Before This Hour You will have no scanning and no alerts 

End_Hour  - After This Hour You will have no scanning and no alerts 


Produits recommandés
ADR Alert Dashboard
LEE SAMSON
3.92 (13)
Le tableau de bord d'alerte ADR vous montre en un coup d'œil où se négocie actuellement le prix par rapport à sa fourchette quotidienne moyenne normale. Vous recevrez des alertes instantanées par pop-up, e-mail ou push lorsque le prix dépasse sa fourchette moyenne et les niveaux supérieurs de votre choix afin que vous puissiez sauter rapidement dans les reculs et les inversions. Le tableau de bord est conçu pour être placé sur un tableau vierge et s'asseoir simplement en arrière-plan et vous al
Market Steps MT4
Mahdi Ebrahimzadeh
5 (1)
L'indicateur Market Steps est conçu et construit sur la base des corrélations temps/prix de Gann et optimisé par des règles de Price Action spécifiques au marché Forex. Il utilise les concepts de flux d'ordres du marché pour prédire les zones de prix potentielles pour un volume élevé d'ordres.  L'indicateur Levels peut être utilisé pour le trading lui-même ou comme une combinaison pour filtrer les signaux erronés d'autres stratégies/indicateurs. Chaque trader a besoin d'un outil aussi puissan
My indicator is 1000%, it never repaints, it works in every time period, there is only 1 variable, it sends notifications to your phone even if you are on vacation instead of at work, in a meeting, and there is also a robot version of this indicator With a single indicator you can get rid of indicator garbage It is especially suitable for scalping in the m1 and m5 time frames on the gold chart, and you can see long trends in the h1 time frame.
MartingaleArrow
Abdulkarim Karazon
Martingale Arrow est un indicateur mt4 de type flèche conçu pour le trading d'options binaires martingale, cette flèche s'imprime sur la barre ouverte/intra barre et donne une alerte. COMMENT UTILISER : ouvrez le commerce dès que la flèche apparaît, si le commerce est gagné, attendez le prochain signal et négociez le même lot. Si le commerce perd le double lot au signal suivant et continuez ainsi jusqu'à ce qu'un signal gagne, réinitialisez et négociez avec le premier lot commercial. DÉLAI RECO
HeikenashiSmoothing
Rodolfo Leonardo De Morais
Heiken ashi Smoothing in separate window MTF The color of the Heiken-Ashi candles depend on their shadows. The advantage of the Heiken-Ashi chart is that the trend is determined very simply, the upward-facing sails are blue, and the downward-tendency sails are red. For profitable trading it is necessary to use it with the standard candles (make analyzes) and with the other indicators. Indicator Parameters TimeFrame - Graphic time being 0 = Current graph time, 1 = M1, 5 = M5, 15 = M15, 30 = M30
Rhino NW
Sergei Shishaev
Нестандартный индикатор определения текущего тренда. Альтернативный подход к определению текущей рыночной тенденции. В основе лежит уникальный алгоритм. Не используются   скользящие средние , осцилляторы , супер-тренды и прочие стандартные индикаторы. Для таймфреймов:   от M15 до D1 . Для стилей торговли:  интрадэй, свинг, долгосрок . Может стать готовой торговой стратегией совместно с любым канальным индикатором. Например таким, как индикатор   "Snake" . Внимание! Это индикатор, а не советни
Cet indicateur fonctionne en conjonction avec la théorie des vagues d'Elliott de deux manières : Mode automatique : Dans ce mode, l'indicateur détectera automatiquement les cinq vagues motrices sur le graphique conformément à la théorie des vagues d'Elliott. Il fournira des prédictions et identifiera les zones potentielles de retournement. De plus, il a la capacité de générer des alertes et des messages push pour informer les traders des développements importants. Cette fonctionnalité automatiqu
Kill Zones MT4
Diego Arribas Lopez
MT5 Version Kill Zones Kill Zones allows you to insert up to 3 time zones in the chart. The visual representation of the Kill Zones in the chart together with an alert and notification system helps you to ignore fake trading setups occurring outside the Kill Zones or specific trading sessions. Using Kill Zones in your trading will help you filter higher probability trading setups. You should select time ranges where the market usually reacts with high volatility. Based on EST time zone, followi
Dark Sniper
Dmitriy Kashevich
Dark Sniper pointer indicator.  Complete absence of redrawing   The percentage of correct indicator forecasts depends on your settings; the default is period 7 (performed better) The arrow indicates the direction of the next candle and the possible direction of the trend in the future.  Suitable for small timeframes m1 and m5  It is recommended to open transactions from 1 to 2 candles.  The signal appears on the current candle. Open a trade on the next one since the signal is being ge
Market Profile
Artem Titarenko
5 (1)
The "Market Profile" indicator displays the profiles and volumes of periods – weekly, daily, session (8-hour), 4-hour, hour, summary. The VAH/VAL price area is automatically highlighted by a dotted line for each profile (except for the summary). The indicator includes chroma Delta, which colors the profile areas. The areas of prevailing Buys is colored in green, that of Sells - in red. The intensity histogram features blue/red respectively. In the filter mode, the indicator displays the volume a
Nobilis AI. Интеллектуальная торговая система. это готовая торговая система для работы на любом инструменте и любом таймфрейме. Полностью готова для ручной торговли и использовании в роботах Канал не перерисовывается Сигналы не перерисовываются Интеллектуальный расчет сигналов под каждый инструмент и таймфрейм Рассчитывает и показывает торговые позиции Подбирает наилучшие торговые параметры 10000 активаций Удобно работать на всех таймфреймах от M1 до W1. Протестировано на металлах, валю
Note : The slow loading of the indicator issue has been addressed . This new version loads fast and does not slow the platform. Version 1.3 : We have updated the indicator to include an historical bar scanning option . So instead of scanning all bars in the history (which can make the indicator slow sometimes ) , you can select the maximum number of bars it can scan which can increase the performance and make the indicator faster. This indicator scans the 1-3 Trendline pattern . The indic
Contact me for instruction, any questions! Introduction Triangle chart patterns are used in   technical analysis , which is a trading strategy that involves charts and patterns that help traders identify trends in the market to make predictions about future performance.   Triangle Pattern Scanner Indicator It is usually difficult for a trader to recognize classic patterns on a chart, as well as searching for dozens of charts and time frames will take time, and there is also a possibility of a
Strong Pairs
Angelico Jurado
5 (1)
This indicator calculates the strength of the major currencies (EUR, USD, CAD, GBP, CHF, NZD, USD, JPY) and shows the top 4 strongest currency pairs that are currently in a high probability trend for the day or for the week. Usage The indicator displays 8 currency pairs with a trend direction (e.g. "EURUSD-DOWN") and ranked according to strength, with 1 being ths strongest. There will be 4 pairs for intraday and 4 pairs for intraweek If a currency pair is present in the top 4 intraday, it is i
The Power calculates the strength of the long and short forces by the ratio of the price breakthrough to the average amplitude of the previous market. When the intensity is strong, the signal appears on the chart to estimate the direction of the next wave. There is no future function for the indicator. All signals will not move or disappear after they appear, and have a good real-world reference value. The indicator parameters allow the user to make individual adjustments. More EA and Indicators
The Momentum Standard/Hidden Divergence indicator will plot the momentum, and will also identify and plot standard (regular) divergences between the indicator and the price action, OR it can be set to identify and plot hidden (reverse) divergences between the indicator and the price action. The divergences themselves are implemented as lines (default green for bullish divergence and red for bearish divergence) drawn in the indicator pane. If activated via the Inputs dialog, alerts will be genera
Mr Beast MIN Max indicator
Luis Mariano Vazquez Marcos
Asesor Experto "MR BEAST MIN MAX Price Extremes Master": Potencia tu Trading con Precisión en Mínimos y Máximos El asesor experto "Price Extremes Master" redefine la toma de decisiones en el trading al basarse en los precios mínimos y máximos del mercado. Este innovador asesor utiliza algoritmos avanzados para identificar oportunidades estratégicas en los puntos extremos de precios, permitiendo a los traders capitalizar las fluctuaciones del mercado de manera eficaz. Características Destacadas:
The Trap Play MT4
Carl Gustav Johan Ekstrom
5 (3)
Trap Play  refers to a market situation where price initially makes a new high or low, luring traders into believing a strong trend is forming. However, the price quickly reverses and invalidates the breakout, trapping those traders who entered positions based on the initial move. This sudden reversal often results in a rapid exit of positions, leading to significant price movement in the opposite direction.  Trap plays  can occur in various financial markets and timeframes and are characterized
M W Scanner
Reza Aghajanpour
5 (11)
**   All Symbols   x   All Timeframes   scan just by pressing scanner button ** *** Contact me after the purchase to send you instructions and add you in "M W Scanner group" for sharing or seeing experiences with other users. Introduction: Double Top(M) and Double Bottom(W) is a very repetitive common type of price reversal patterns. Double Top resembles M pattern and indicates bearish reversal whereas Double Bottom resembles W pattern and indicates a bullish reversal that they have  high win  r
The CCI Dashboard is an information panel which allows you to have a global market vision through a Commodity Channel Index. CCI Dashboard analyzes and tracks all the actives you want to invest in. Take advantage of this useful dashboard where you can open in a few seconds the chart and quickly invest on it. Main Features of CCI Dashboard Graphic panel that allows you to know the situation of many assets. 7 Different Commodity Channel Index situations to discover when an asset is overbought or
Global Trend
Vitalii Zakharuk
Global Trend Indicator, shows the signals for entry. Displays both entry points and the trend itself. Shows statistically calculated moments for entering the market with arrows. When using the indicator, the risk factor can be optimally distributed. Settings: Uses all one parameter for settings. Choosing a parameter, it is necessary to visually resemble it so that the appropriate graph has a projection of extremes. Parameters: Length - the number of bars for calculating the indicator.
"Stratégie de trading scalping" - l'indicateur a été créé pour le trading en utilisant le système de scalping. "Scalping trading strategy" indique sur le graphique avec une flèche où le prix ira maintenant. Une fois que l'indicateur a dessiné une flèche, le prix ira dans le sens de la flèche d'au moins 20 points. Cela nous suffit pour commercer efficacement. "Scalping trading strategy" ne redessine pas ses signaux. L'indicateur a de nombreux modes de fonctionnement différents. Il peut dessiner
This is indicator for checking your trades. Please see the pictures attachment, the indicator show info about: - Breakeven Level; - Margin Call Level; - Two volume info, past and current (With color exchange base on the past volume); - Spreads; - Swap Long and Swap Short (With color change, positive and negative swap); - Running Price; -Today High Low Pips; - Today Open to Current Running Price pips. This indicator not for trading entry, only to assist your trade management Regards
The Arrow Scalper
Fawwaz Abdulmantaser Salim Albaker
1 (2)
Dear Friend..  I share with you this simple Expert Adviser .. it is full automatic  this Expert Adviser following the trend of the pair you install on or any stocks or indices , it is works like that: - when the trend on H4 chart show a start of up trend the expert will wait till the 15M & 1H charts show an up trend the EA will open a buy order directly , and do the same for down trend and open a sell order the buy or sell  order lot size and take profit and stop loss will measured manually  by
FREE
Rira Renko
Vitor Palmeira Abbehusen
RENKO on Time Chart This indicator is an enhanced Renko, so you can watch the Renko bricks on the chart to understand price movement more clearly the other improvement is automated box size according to ATR (Average True Range) period you can set the ATR number as you want and the box size of Renko changes automatically based on price movement Inputs Mode: Box size is the input to specify the size of the Renko box you want to print on the chart. This input lets you choose the fixed b
The Market Sentiment Meter indicator calculates the saturation levels of the price chart. A signal to exit the oversold zone indicates a buying opportunity, and a signal to exit the overbought zone indicates a selling opportunity. Typically, for this indicator you need to set relative values for the overbought (Top) and oversold (Bottom) levels. Often a good trend can be seen visually on the price chart. However, an experienced trader must clearly understand the current distribution of forces
Binary Options Support Resistance Indicator This indicator is designed for binary options trading and effectively shows retracements from support and resistance levels. Signals appear on the current candle. A red arrow pointing downwards indicates a potential selling opportunity, while a blue arrow pointing upwards suggests buying opportunities. All that needs adjustment is the color of the signal arrows. It is recommended to use it on the M1-M5 timeframes as signals are frequent on these timef
Trade Stats
Johannes Schoeman
Does your trading consist of Multiple EA's, Multiple time frames an no clear indication of how each individual strategy or time frame is performing, then this indicator will help. Assign the EA Magic number to this indicator and track it's performance on the chart by selecting on chart the period, today, week, month year or all history to view. Easy visual colour changing header to display the performance of the EA for the respective periods.    Minimize the panel to reduce chart clutter. Add yo
Some informations on the chart with the single attachment. RangeBorder Buy Sell (RBBS) Non Repaint Indicator will provide trend line, buy sell arrows,reversal arrows, range channel, order exit area,high average price line and low average price line.All arrows and lines don't repaint and not lagging. Once candle closed it won't  repaint. Reading Indicator: 1. Small Stars , Indicates oversold and overbought with certain logic and price may reverse when this small star triggers. Useful to identif
Market Session Pro MT4
Kambiz Shahriarynasab
5 (1)
The  Market Sessions Indicator for MT5 helps you  predict market turnarounds  by detecting major supply and demand areas. These pivot points tend to occur after a new session has started and the previous one is still open. It is also used to gauge how many points or pips the market moves on average during a session. This helps us to place better our take profits and stop losses. The indicator works on all forex pairs, gold, silver, commodities, stocks, indices and any other instrument that your
Les acheteurs de ce produit ont également acheté
Gann Made Easy
Oleg Rodin
4.92 (77)
Gann Made Easy est un système de trading Forex professionnel et facile à utiliser qui est basé sur les meilleurs principes de trading en utilisant la théorie de mr. WD Gann. L'indicateur fournit des signaux d'ACHAT et de VENTE précis, y compris les niveaux Stop Loss et Take Profit. Vous pouvez échanger même en déplacement en utilisant les notifications PUSH. S'il vous plaît contactez-moi après l'achat! Je partagerai avec vous mes astuces de trading et d'excellents indicateurs bonus gratuitement!
TPSpro RFI Levels
Roman Podpora
4.85 (20)
Reversal First Impulse levels (RFI)    INSTRUCTIONS        RUS       -       ENG              R ecommended to use with an indicator   -   TREND PRO -  Version MT5 A key element in trading is zones or levels from which decisions to buy or sell a trading instrument are made. Despite attempts by major players to conceal their presence in the market, they inevitably leave traces. Our task was to learn how to identify these traces and interpret them correctly. Main functions: Displaying active zones
Atomic Analyst
Issam Kassas
5 (3)
Tout d'abord, il convient de souligner que cet indicateur de trading n'est ni repainting, ni redrawing et ne présente aucun délai, ce qui le rend idéal à la fois pour le trading manuel et automatisé. Manuel de l'utilisateur : réglages, entrées et stratégie. L'Analyste Atomique est un indicateur d'action sur les prix PA qui utilise la force et le momentum du prix pour trouver un meilleur avantage sur le marché. Équipé de filtres avancés qui aident à éliminer les bruits et les faux signaux, et à
TPSproTREND PrO
Roman Podpora
4.78 (18)
TPSpro TRENDPRO  - is a trend indicator that automatically analyzes the market and provides information about the trend and each of its changes, as well as giving signals for entering trades without redrawing! The indicator uses each candle, analyzing them separately. referring to different impulses - up or down impulse. Exact entry points into transactions for currencies, crypto, metals, stocks, indices!  -  Version MT5               DETAILED DESCRIPTION                R ecommended to use with
Trend Punch
Mohamed Hassan
5 (14)
Manual guide:   Click here WEEKEND SALE PROMO:   $65 ONLY!  -- Next price is  $120 .  This indicator is unstoppable when combined with our other indicator called  Support & Resistance . After purchase, send us a message and you will get it   for  FREE as a BONUS! I like to use Trend Punch on XAUUSD on the M1 timeframe & higher ones!  Introducing Trend Punch , the revolutionary forex trend indicator that will transform the way you trade! Trend Punch is uniquely designed to provide
ACTUELLEMENT 26% DE RÉDUCTION La meilleure solution pour tout débutant ou trader expert ! Cet indicateur est un outil de trading unique, de haute qualité et abordable car nous avons incorporé un certain nombre de caractéristiques exclusives et une nouvelle formule. Avec seulement UN graphique, vous pouvez lire la force de la devise pour 28 paires Forex ! Imaginez comment votre trading va s'améliorer parce que vous êtes capable de repérer le point de déclenchement exact d'une nouvelle tendan
Scalper Inside PRO
Alexey Minkov
4.74 (58)
An exclusive indicator that utilizes an innovative algorithm to swiftly and accurately determine the market trend. The indicator automatically calculates opening, closing, and profit levels, providing detailed trading statistics. With these features, you can choose the most appropriate trading instrument for the current market conditions. Additionally, you can easily integrate your own arrow indicators into Scalper Inside Pro to quickly evaluate their statistics and profitability. Scalper Inside
Legacy of Gann
Pavel Zamoshnikov
4.83 (12)
The indicator very accurately determines the levels of the possible end of the trend and profit fixing. The method of determining levels is based on the ideas of W.D.Gann, using an algorithm developed by his follower Kirill Borovsky. Extremely high reliability of reaching levels (according to K. Borovsky  - 80-90%) Indispensable for any trading strategy – every trader needs to determine the exit point from the market! Precisely determines targets on any timeframes and any instruments (forex, met
Advanced Supply Demand
Bernhard Schweigert
4.92 (313)
CURRENTLY 26% OFF !! Best Solution for any Newbie or Expert Trader! This indicator is a unique, high quality and affordable trading tool because we have incorporated a number of proprietary features and a new formula. With this update, you will be able to show double timeframe zones. You will not only be able to show a higher TF but to show both, the chart TF, PLUS the higher TF: SHOWING NESTED ZONES. All Supply Demand traders will love it. :) Important Information Revealed Maximize the potenti
Actuellement 20% de réduction ! La meilleure solution pour tout débutant ou trader expert ! Ce logiciel de tableau de bord fonctionne sur 28 paires de devises. Il est basé sur 2 de nos principaux indicateurs (Advanced Currency Strength 28 et Advanced Currency Impulse). Il donne un excellent aperçu de l'ensemble du marché Forex. Il montre les valeurs de l'Advanced Currency Strength, la vitesse de mouvement des devises et les signaux pour 28 paires de devises dans tous les (9) délais. Imagine
M1 Arrow
Oleg Rodin
5 (14)
Une stratégie intraday basée sur deux principes fondamentaux du marché. L'algorithme est basé sur l'analyse des volumes et des vagues de prix à l'aide de filtres supplémentaires. L'algorithme intelligent de l'indicateur ne donne un signal que lorsque deux facteurs de marché se combinent en un seul. L'indicateur calcule les vagues d'une certaine plage sur le graphique M1 en utilisant les données de la période la plus élevée. Et pour confirmer la vague, l'indicateur utilise une analyse en volume.
FX Volume
Daniel Stein
4.6 (35)
Obtenez votre mise à jour quotidienne du marché avec des détails et des captures d'écran via notre Morning Briefing ici sur mql5 et sur Telegram ! FX Volume est le PREMIER et SEUL indicateur de volume qui fournit un VRAI aperçu du sentiment du marché du point de vue d'un courtier. Il fournit des informations impressionnantes sur la façon dont les acteurs institutionnels du marché, comme les courtiers, sont positionnés sur le marché des changes, bien plus rapidement que les rapports COT. Voir c
Enigmera
Ivan Stefanov
5 (3)
ENIGMERA : Le cœur du marché https://www.enigmera.com Introduction Cet indicateur et ce système de trading constituent une approche remarquable des marchés financiers. ENIGMERA utilise les cycles fractals pour calculer avec précision les niveaux de support et de résistance. Il indique la phase d'accumulation authentique et donne une direction et des objectifs.  Un système qui fonctionne que nous soyons dans une tendance ou une correction.  Comment fonctionne-t-il ? ENIGMERA comprend trois l
FX Power MT4 NG
Daniel Stein
5 (11)
Obtenez votre mise à jour quotidienne du marché avec des détails et des captures d'écran via notre Morning Briefing ici sur mql5 et sur Telegram ! FX Power MT4 NG est la nouvelle génération de notre très populaire indicateur de force des devises, FX Power. Et qu'est-ce que ce compteur de force de nouvelle génération offre ? Tout ce que vous avez aimé de l'original FX Power PLUS Analyse de la force de l'OR/XAU Des résultats de calcul encore plus précis Périodes d'analyse configurables individuel
GOLD Impulse with Alert
Bernhard Schweigert
4.56 (9)
Cet indicateur est une super combinaison de nos 2 produits Advanced Currency IMPULSE with ALERT  +   Currency Strength Exotics . Il fonctionne pour tous les cadres temporels et montre graphiquement l'impulsion de force ou de faiblesse pour les 8 principales devises plus un symbole ! Cet indicateur est spécialisé pour montrer l'accélération de la force des devises pour tout symbole comme l'or, les paires exotiques, les matières premières, les indices ou les contrats à terme. C'est le premi
TakePropips Donchian Trend Pro
Eric John Pajarillaga Aldana
4.82 (17)
TakePropips Donchian Trend Pro   (MT4) est un outil puissant et efficace qui détecte automatiquement la direction de la tendance à l'aide du canal Donchian et vous fournit des signaux de trading d'entrée et de sortie ! Cet indicateur multifonction comprend un scanner de tendance, des signaux de trading, un panneau statistique, un filtre, des sessions de trading et un tableau de bord de l'historique des alertes. Il est conçu pour vous fournir des signaux de trading et vous faire gagner des heures
Découvrez le secret pour réussir le trading Forex avec notre indicateur MT4 personnalisé! Vous êtes-vous déjà demandé comment réussir sur le marché du Forex, gagnant régulièrement des bénéfices tout en minimisant les risques? Voici la réponse que vous avez recherchée! Permettez-nous d'introduire notre indicateur MT4 propriétaire qui révolutionnera votre approche du trading. Polyvalence unique Notre indicateur est spécialement conçu pour les utilisateurs qui préfèrent les formations de bou
Le système PRO Renko est un système de trading très précis spécialement conçu pour le trading de graphiques RENKO. Il s'agit d'un système universel qui peut être appliqué à divers instruments de négociation. Le système neutralise efficacement ce qu'on appelle le bruit du marché en vous donnant accès à des signaux d'inversion précis. L'indicateur est très facile à utiliser et n'a qu'un seul paramètre responsable de la génération du signal. Vous pouvez facilement adapter l'outil à n'importe q
Tout d'abord, il convient de souligner que cet outil de trading est un indicateur non repeint, non redessiné et non retardé, ce qui le rend idéal pour le trading professionnel. Cours en ligne, manuel utilisateur et démonstration. L'indicateur Smart Price Action Concepts est un outil très puissant à la fois pour les nouveaux et les traders expérimentés. Il regroupe plus de 20 indicateurs utiles en un seul, combinant des idées de trading avancées telles que l'analyse du trader Inner Circle et les
Présentation de l'indicateur astronomique pour MT4 : Votre compagnon de trading céleste ultime Êtes-vous prêt à élever votre expérience de trading à des hauteurs célestes ? Ne cherchez pas plus loin que notre indicateur astronomique révolutionnaire pour MT4. Cet outil innovant transcende les indicateurs de trading traditionnels en exploitant des algorithmes complexes pour vous fournir des aperçus astronomiques inégalés et des calculs de précision. Un univers d'informations à portée de main : Con
Please send me Direct message on MQL5 CHAT after purchasing the Indicator for Training and Installation Support There are some additional files that is important to use with the Indicator . So be sure to contact me after purchasing the Indicator So that I can add you for training and support . If you find any difficulty with installation then send me Direct message here So that I can connect with you via Anydesk or Teamview for the product installation. " Smart Order Block Indicator " to find
Currency Strength Exotics
Bernhard Schweigert
4.88 (33)
ACTUELLEMENT 20% DE RÉDUCTION ! La meilleure solution pour tout débutant ou trader expert ! Cet indicateur est spécialisé pour montrer la force de la devise pour tous les symboles comme les paires exotiques, les matières premières, les indices ou les contrats à terme. C'est le premier de son genre, n'importe quel symbole peut être ajouté à la 9ème ligne pour montrer la force réelle de la devise de l'or, l'argent, le pétrole, DAX, US30, MXN, TRY, CNH etc. Il s'agit d'un outil de trading uniq
ICT, SMC, SMART MONEY CONCEPTS, SMART MONEY, Smart Money Concept, Support and Resistance, Trend Analysis, Price Action, Market Structure, Order Blocks, BOS/CHoCH,   Breaker Blocks ,  Momentum Shift,   Supply&Demand Zone/Order Blocks , Strong Imbalance, HH/LL/HL/LH,    Fair Value Gap, FVG,  Premium  &   Discount   Zones, Fibonacci Retracement, OTE, Buy Side Liquidity, Sell Side Liquidity, BSL/SSL Taken, Equal Highs & Lows, MTF Dashboard, Multiple Time Frame, BigBar, HTF OB, HTF Market Structure, 
Currency Strength Wizard est un indicateur très puissant qui vous offre une solution tout-en-un pour un trading réussi. L'indicateur calcule la puissance de telle ou telle paire de devises en utilisant les données de toutes les devises sur plusieurs périodes. Ces données sont représentées sous la forme d'un indice de devise facile à utiliser et de lignes électriques de devise que vous pouvez utiliser pour voir la puissance de telle ou telle devise. Tout ce dont vous avez besoin est d'attacher l'
ECM Channel MT4
Paulo Rocha
5 (1)
ECM Elite Channel is a volatility-based indicator, developed with a specific time algorithm, which consists of finding possible corrections in the market. This indicator shows two outer lines, an inner line (retracement line) and an arrow sign, where the channel theory is to help identify overbought and oversold conditions in the market. The market price will generally fall between the boundaries of the channel. If prices touch or move outside the channel, it's a trading opportunity. The
TrendDecoder Premium
Christophe Pa Trouillas
5 (6)
Identifiez les ranges et les prochaines tendances fortes   |  Obtenez les premiers signaux et la force des tendances   |  Obtenez des TP clairs et RR favorable   |  Repérer les niveaux Fibo que le prix va tester Indicateur qui ne retrace pas, non retardé - idéal pour le trading manuel et automatisé - adapté à tous les actifs et à toutes les unités de temps Pour une durée limitée >>   -50% de réduction Après votre achat,   contactez-moi sur ce canal  pour obtenir les réglages recommandés. Version
Indicator : RealValueIndicator Description : RealValueIndicator is a powerful tool designed specifically for trading on the EURUSD pair. This indicator analyzes all EUR and USD pairs, calculates their real currency strength values, and displays them as a single realistic value to give you a head start on price. This indicator will tell you moves before they happen if you use it right. RealValueIndicator allows you to get a quick and accurate overview of the EURUSD currency pair tops and bottoms,
ACTUELLEMENT 31% DE RÉDUCTION ! ! La meilleure solution pour tout débutant ou Expert Trader ! Cet indicateur est un outil de trading unique, de haute qualité et abordable car nous avons incorporé un certain nombre de caractéristiques exclusives et une formule secrète. Avec seulement UN graphique, il donne des alertes pour les 28 paires de devises. Imaginez comment votre trading s'améliorera parce que vous serez capable de repérer le point de déclenchement exact d'une nouvelle tendance ou d'
Up down v6T
Guner Koca
5 (1)
Thise indicator is up down v6  comes with tradingwiev pinescript. purchased people, after installed on terminal ,contact me on mql5  to get BONUS  TradingView pinescript. up-down indicator is no repaint and works all pairs and lower than weekly time frames charts. it is suitable also 1 m charts for all pairs. and hold long way to signal. dont gives too many signals. when red histogram cross trigger line that is up signal.and price probably will down when blue histogram cross trigger line that
Italo Levels Indicator
Italo Santana Gomes
5 (8)
BUY INDICATOR AND GET EA FOR FREE AS A BONUS + SOME OTHER GIFTS! ITALO LEVELS INDICATOR  is the best levels indicator ever created, and why is that? Using high volume zones on the market and Fibonacci the Indicator works on all time-frames and assets, indicator built after 7 years of experience on forex and many other markets. You know many levels indicators around the internet are not complete, does not help, and it's difficult to trade, but the   Italo Levels Indicator is different , the Ital
Plus de l'auteur
Présentation de l'indicateur astronomique pour MT4 : Votre compagnon de trading céleste ultime Êtes-vous prêt à élever votre expérience de trading à des hauteurs célestes ? Ne cherchez pas plus loin que notre indicateur astronomique révolutionnaire pour MT4. Cet outil innovant transcende les indicateurs de trading traditionnels en exploitant des algorithmes complexes pour vous fournir des aperçus astronomiques inégalés et des calculs de précision. Un univers d'informations à portée de main : Con
Shepherd Harmonic Pattern
Abdullah Alrai
4.68 (59)
Cet indicateur détectera des motifs harmoniques dessinés sur le graphique par des méthodes manuelles et automatiques. Vous pouvez consulter le manuel d'utilisateur à partir de ce lien: Ajoutez votre avis et contactez-nous pour l'obtenir. Il existe une version gratuite pour essayer ce produit sur MT4. Vous pouvez l'utiliser pour détecter les motifs Gartley et Nenstar: https://www.mql5.com/en/market/product/30181 Vous pouvez acheter la version complète de MT4 à partir de: https://www.mql5.com/en/m
Cet indicateur fonctionne en conjonction avec la théorie des vagues d'Elliott de deux manières : Mode automatique : Dans ce mode, l'indicateur détectera automatiquement les cinq vagues motrices sur le graphique conformément à la théorie des vagues d'Elliott. Il fournira des prédictions et identifiera les zones potentielles de retournement. De plus, il a la capacité de générer des alertes et des messages push pour informer les traders des développements importants. Cette fonctionnalité automatiqu
L'indicateur de Carré Gann est un puissant outil d'analyse du marché basé sur l'article "Formule Mathématique pour les Prédictions de Marché" écrit par W.D. Gann. Cet outil utilise des concepts mathématiques et des théories de Gann pour réaliser une analyse précise du marché. Il utilise les carrés de 144, 90, 52 et aussi le carré de 9. De plus, il intègre la méthode du  pour le carré de 9 et sa relation avec les canaux et le modèle en étoile de ce carré. Manuel d'Utilisateur et Application : Ava
Shepherd Gann Squares Free
Abdullah Alrai
4.86 (37)
Cet indicateur est une méthode d'analyse de marché basée sur l'article "Formule mathématique pour les prédictions de marché" écrit par W.D. Gann en fonction du carré de neuf et du carré de 144 méthodes. Manuel de l'Utilisateur: Add Your review And contact us to get it Vous pouvez acheter la version complète MT5 à partir de : https://www.mql5.com/en/market/product/28669 Vous pouvez tester gratuitement sur MT4 : https://www.mql5.com/en/market/product/15316 Ce produit peut dess
FREE
This indicator will detect harmonic patterns that are drawn on the chart by manual and automatic methods. You can see user manual from this link: https://www.mql5.com/en/blogs/post/719257 There is a free version (it detect only Gartley and Nenstar Patterns) to try this product. You can buy the full MT4 version from: https://www.mql5.com/en/market/product/104689 Notes When you use this indicator and change the settings, add indicators like Moving Average or Bollinger Bands, this indicator will
FREE
Indicateur de Motif de Bougie Marubozu par ON Trade Le motif de bougie Marubozu est un motif de bougie puissant et direct qui peut fournir des informations précieuses sur le sentiment du marché et les éventuels renversements de tendance. Il se caractérise par une bougie avec une très petite ou inexistante ombre (mèche) à une extrémité et un long corps s'étendant dans la direction de la tendance dominante. Ce motif représente un déséquilibre fort entre les acheteurs et les vendeurs, suggérant que
FREE
ON Trade Pivoteer
Abdullah Alrai
4 (1)
Introducing the Pivot Point Selector Indicator: Your Ultimate Tool for Custom Pivot Levels Are you ready to take your trading to the next level? Say hello to the Pivot Point Selector Indicator, a game-changing tool that puts you in control of your pivot levels. This innovative indicator empowers you to choose three specific points that will determine the pivot level calculations, giving you unparalleled customization and precision in your trading strategy. Key Features and Benefits: Custom Pivo
FREE
L'indicateur de motif de chandelier japonais Hikkake est un outil spécialisé conçu pour identifier et détecter les motifs d'action des prix Hikkake qui se forment sur un graphique. Ces motifs sont basés sur le concept d'une fausse rupture à partir d'une barre intérieure, ce qui conduit souvent à des opportunités de trading potentielles. La principale fonction de l'indicateur est d'analyser les cinq dernières bougies sur le graphique et de déterminer si elles présentent les caractéristiques du mo
Présentation de l'indicateur Calculateur de Prix du Gramme d'Or Vous souhaitez être constamment informé du prix de l'or dans votre devise locale ? Ne cherchez plus, l'indicateur Calculateur de Prix du Gramme d'Or vous offre un outil novateur qui vous permet de calculer en temps réel le prix par gramme d'or dans votre devise locale préférée. Avec cet indicateur, vous pouvez exploiter les informations financières pour prendre des décisions éclairées. Caractéristiques Principales : Prix Localisé de
FREE
Cet indicateur a pour but de représenter visuellement le canal Donchian sur votre graphique de trading. Le canal Donchian est un outil technique simple utilisé pour représenter la plage entre le plus haut et le plus bas sur une période spécifiée. Cet indicateur améliore l'analyse visuelle des mouvements de prix en offrant des indications sur les points potentiels de rupture et de continuation de tendance. Le canal Donchian peut être appliqué aussi bien sur l'unité de temps actuelle que sur une u
FREE
This indicator offers a comprehensive and efficient solution for traders seeking optimal entries in scalping strategies. Leveraging moving averages and stochastic indicators, it employs a systematic approach to identify favorable trade opportunities. The indicator goes beyond mere analysis, actively drawing clear and actionable entry points on your chart, denoted by arrows. Moreover, it provides the convenience of alerts to ensure you never miss these potential setups. Key Features and Benefits:
FREE
ON Trade Pivots is A technical indicator that Draws all Pivot levels depending on time frame that defined in settings. Notes It will be good tool for all traders who use pivot levels in their trades. Let me inform you that this indicator draw this level as buffers not as objects then you can connect it easily to EA. This indicator allow you to find pivots levels for any time frame not only daily you are free to choose time frame from settings. Parameters Use_System_Visuals - Enable /Disable
FREE
"Cet indicateur est un outil simple de détection de tendance. Vous pouvez l'utiliser avec votre stratégie pour obtenir de bonnes entrées, comme en mode scalping. Il dessinera un canal autour du prix, qui s'étendra à mesure que le temps augmente. Pendant les périodes personnalisées, il reviendra au point de départ de l'expansion en fonction d'un algorithme qui prend en compte le temps et le prix ensemble. Vous pouvez acheter à la limite inférieure du canal après l'apparition de signes de retourne
Rsi Channel
Abdullah Alrai
5 (1)
This indicator displays the channel of Relative Strength Index. When you see that the price touches the red line and retreats from it many times, then you will know that the general trend is down. When it retreats from the blue line many times, that means that the general trend is up. This lines express the RSI values attributed to the price values on the main chart. You can add this indicator to your strategy, it will help you. This indicator will work best on 5 minutes and higher time frames.
Cet indicateur propose une méthode robuste d'analyse de marché centrée autour du concept de "l'outil de canal de régression". En utilisant cet outil, les traders peuvent obtenir un contrôle exceptionnel sur le canal de régression de leur graphique, ce qui leur permet de prendre des décisions de trading plus éclairées. L'outil de canal de régression est un instrument puissant dans la boîte à outils d'un trader. Il est conçu pour fournir des informations précieuses sur les tendances des prix et le
"Nous vous présentons notre puissant indicateur Forex conçu pour améliorer votre stratégie de trading et vous fournir des informations précises sur les tendances du marché. Cet outil innovant utilise un algorithme personnalisé sophistiqué qui analyse minutieusement les mesures des bougies, en effectuant des ajustements pour obtenir une précision optimale. Le résultat ? Un ensemble de flèches précisément tracées sur votre graphique, indiquant des points d'entrée stratégiques. La génialité derrièr
Shepherd Gann Squares
Abdullah Alrai
4.9 (10)
Cet indicateur est une méthode d'analyse de marché basée sur l'article "Formule mathématique pour les prédictions de marché" écrit par W.D. Gann en fonction du carré de neuf et du carré de 144 méthodes. Manuel de l'Utilisateur: Add Your review And contact us to get it Vous pouvez acheter la version complète MT5 à partir de : https://www.mql5.com/en/market/product/28669 Vous pouvez tester gratuitement sur MT4 : https://www.mql5.com/en/market/product/15320?source=Site +Profile+Seller#
Cet indicateur a été conçu pour détecter et visualiser les vagues diamant de Gann, un modèle spécifique dérivé de la théorie de Gann. Il offre aux traders des informations sur les potentielles inverses de marché en traçant des points (P) basés sur les points ABC du modèle. De plus, l'indicateur trace des lignes verticales à partir des points prédits (P) pour aider les traders à identifier plus facilement les points potentiels d'inversion. Fonctionnalités de l'indicateur : Use_System_Visuals : Ce
"Cet indicateur détecte les entrées basées sur la théorie du motif Bystra et fournit les valeurs d'entrée pour placer des ordres limités avec des niveaux cibles et des niveaux de stop. Cela vous permet de calculer votre pourcentage de risque. Notes : Cet indicateur dispose de tampons qui permettent son utilisation dans les Expert Advisors (EAs). Il est important de pratiquer une bonne gestion de l'argent en travaillant avec ce produit. Lorsque vous changez votre cadre temporel, L'indicateur sauv
L'indicateur "Fibo Star" a été conçu pour tracer les éventails de Fibonacci sous forme d'étoiles sur votre graphique. Ces éventails de Fibonacci sont un outil puissant pour analyser les mouvements de prix et peuvent fournir des aperçus des niveaux potentiels de support et de résistance. Cet indicateur est équipé d'un panneau de contrôle convivial qui vise à simplifier le processus de dessin et de configuration des éventails, permettant ainsi d'économiser du temps et des efforts. Mode d'emploi :
L'indicateur de "Force des Devises" est un outil puissant conçu pour fournir aux traders des informations sur la force relative de différentes devises sur le marché des changes. En calculant et en représentant la force de chaque devise en fonction de son intervalle de temps spécifié, cet indicateur offre aux traders la possibilité d'identifier des opportunités de trading potentielles, notamment lorsque des divergences significatives ou des croisements sont observés. Principales caractéristiques
L'indicateur de Carré Gann est un puissant outil d'analyse du marché basé sur l'article "Formule Mathématique pour les Prédictions de Marché" écrit par W.D. Gann. Cet outil utilise des concepts mathématiques et des théories de Gann pour réaliser une analyse précise du marché. Il utilise les carrés de 144, 90, 52 et aussi le carré de 9. De plus, il intègre la méthode du  pour le carré de 9 et sa relation avec les canaux et le modèle en étoile de ce carré. Manuel d'Utilisateur et Application : Ava
Cet indicateur détectera les motifs harmoniques tracés sur le graphique à l'aide de méthodes manuelles et automatiques. Ajoutez votre avis, s'il vous plaît. Notes: Cet indicateur dispose d'un panneau de contrôle et il enregistrera chaque réglage (graphique et unité de temps). Vous pouvez le réduire pour avoir plus d'espace sur le graphique et vous pouvez appuyer sur le bouton de fermeture pour masquer toutes les données de l'indicateur sur le graphique si vous préférez travailler avec d'autres o
Indicateur technique pour détecter de forts schémas d'action sur les prix : Pin Bar, Inside Bar et Outside Bar Introduction : Dans le domaine de l'analyse technique, les schémas d'action sur les prix servent d'indicateurs essentiels des mouvements potentiels du marché. Nous avons développé un indicateur technique sophistiqué qui simplifie l'identification de solides schémas d'action sur les prix sur les graphiques. Notre indicateur est spécialisé dans la détection de trois schémas essentiels : l
Indicateur de Support et Résistance Basé sur la Numérologie pour MetaTrader Introduction : Découvrez une nouvelle dimension dans l'analyse technique avec notre Indicateur de Support et Résistance Basé sur la Numérologie pour MetaTrader. Cet outil unique exploite la puissance de la numérologie pour identifier des niveaux clés de support et de résistance sur vos graphiques, vous offrant des informations précieuses sur les mouvements potentiels des prix. Concepts Clés : La Numérologie dans le Tradi
Unlock Hidden Insights with the Numerokh Indicator: Your Numerology-Based Support and Resistance Tool Introducing the Numerokh indicator, a revolutionary tool that brings the mystical world of numerology into the realm of trading. Imagine having the power to identify key support and resistance levels on your charts using the age-old wisdom of numerology. This indicator takes trading to a new dimension, offering you a unique way to analyze price movements and make informed trading decisions. Key
Découvrez une approche révolutionnaire du trading avec l'indicateur Shepherd Numerology Levels. Cet outil innovant combine la sagesse ancienne de la numérologie avec les techniques de trading modernes pour vous aider à identifier des niveaux de support et de résistance clés sur vos graphiques. En utilisant la méthode du carré de neuf, cet indicateur offre une perspective unique sur les mécanismes du marché et vous permet de prendre des décisions de trading plus éclairées. Principales caractérist
Présentation de l'indicateur ON Trade Numerology Mirror : Découvrez les motifs inverses cachés grâce à la numérologie Explorez une nouvelle dimension dans l'analyse technique avec l'indicateur ON Trade Numerology Mirror. Cet outil innovant exploite la sagesse ancienne de la numérologie pour identifier des niveaux clés de retournement dans vos graphiques. En reconfigurant les chiffres dans des positions inversées, cet indicateur révèle des motifs cachés qui ont le potentiel d'indiquer des retourn
Présentation de l'indicateur Maravilla Square : Votre Assistant pour le Trading Prédictif Découvrez l'indicateur Maravilla Square, votre clé pour le trading prédictif. Cet outil unique offre des aperçus sur les renversements de prix et présente une ligne de tendance qui peut être ajustée entre les points hauts et bas. Dynamique de la Ligne de Tendance : L'indicateur Maravilla Square introduit la ligne de tendance, que vous pouvez adapter aux points hauts et bas du graphique. Cette fonctionnalité
Filtrer:
Sameer Haque
498
Sameer Haque 2023.10.21 16:06 
 

L'utilisateur n'a laissé aucun commentaire sur la note

Abdullah Alrai
42059
Réponse du développeur Abdullah Alrai 2023.10.21 18:06
Thanks mr sameer
Répondre à l'avis
Version 1.1 2023.10.21
- improvements