FATL Signal AM
- Indicateurs
- Andriy Matviyevs'kyy
- Version: 26.3
- Mise à jour: 22 octobre 2023
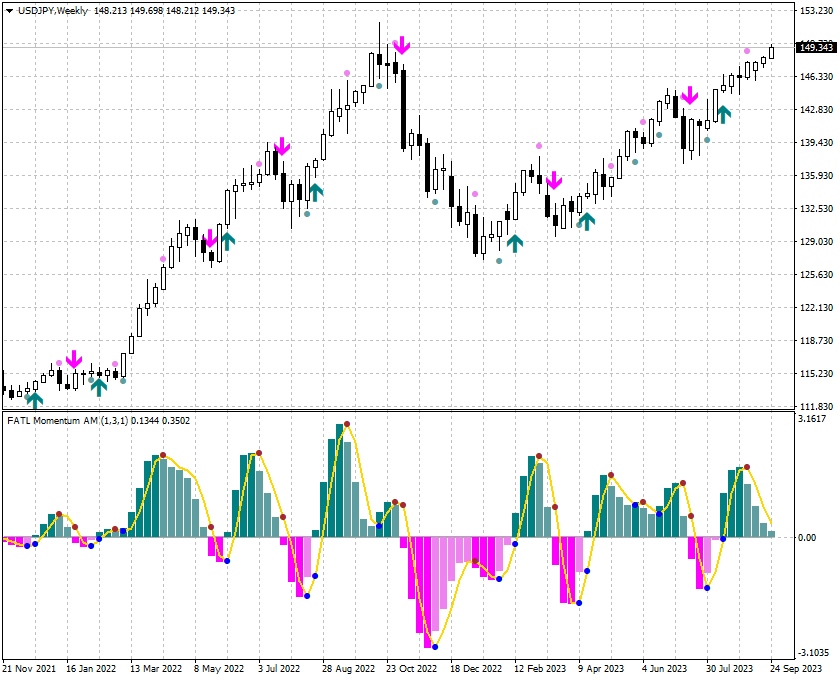
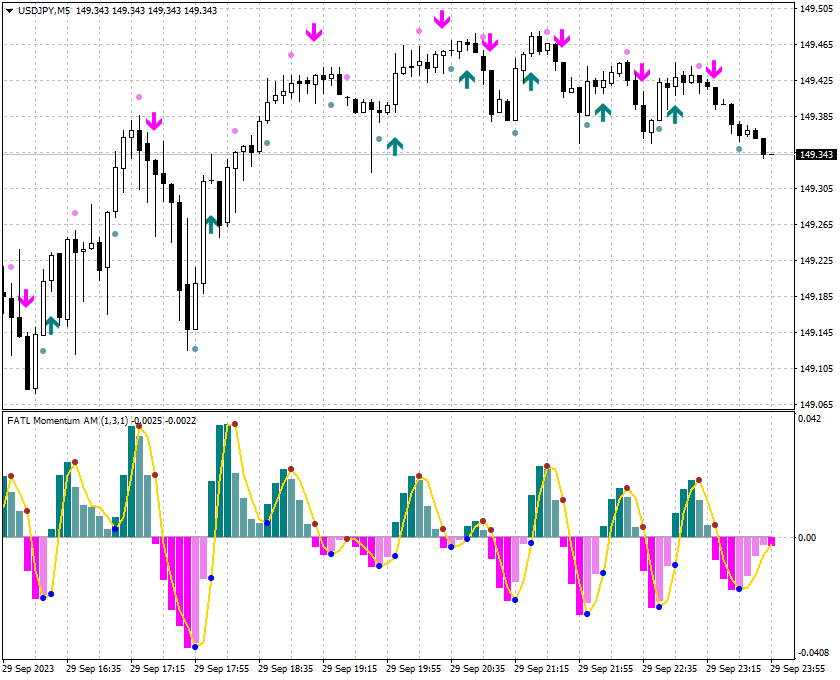
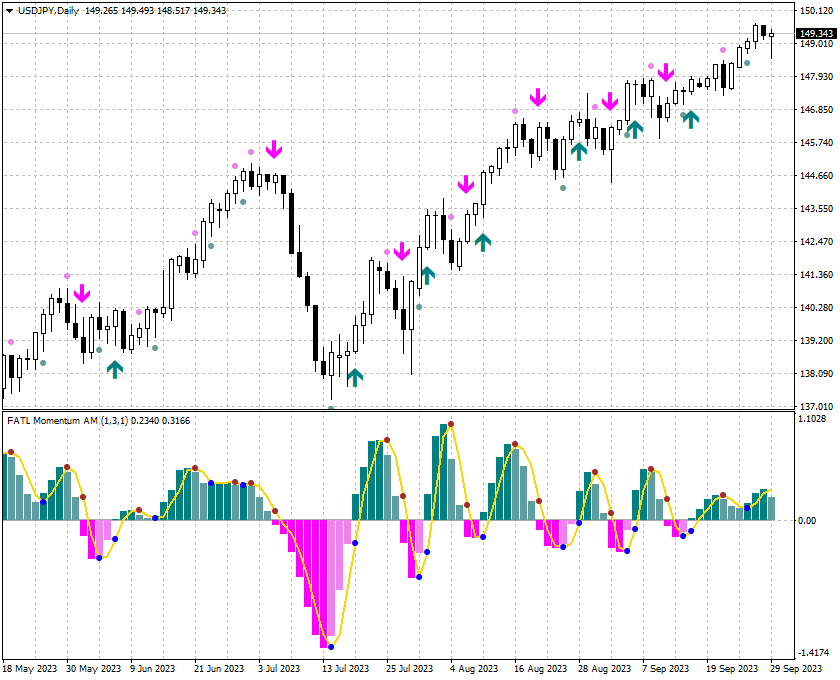
The presented indicator marks signals on the price chart with arrows in accordance with the data of the FATL Momentum AM indicator.
The indicator gives a signal and sends a notification to the mobile terminal and email.
The FATL Momentum AM indicator is the difference between the current price and the price some number of periods ago.
The difference from the classic indicator Momentum is the preliminary smoothing of prices by an adaptive digital filter - FATL.
Confirmation of the indicator signals is usually the price breaking the high (for buying) or low (for selling) of the bar on which the signal was given.